. 2018 May:89:139-148.
doi: 10.1016/j.jaut.2017.12.013. Epub 2018 Feb 1.

Treg-specific deletion of NKAP results in severe, systemic autoimmunity due to peripheral loss of Tregs

Affiliations

Treg-specific deletion of NKAP results in severe, systemic autoimmunity due to peripheral loss of Tregs

Barsha Dash et al. J Autoimmun. 2018 May.

Abstract

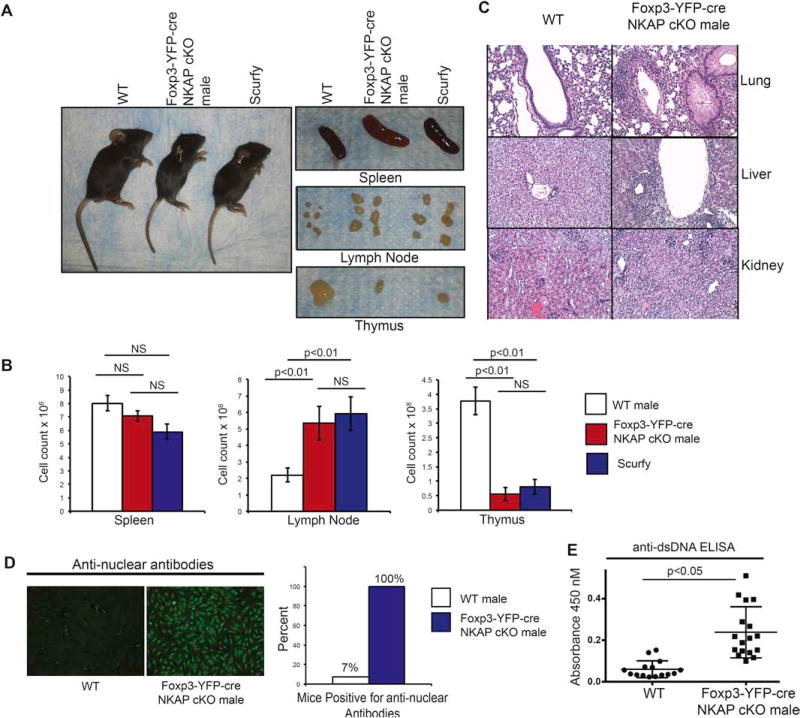
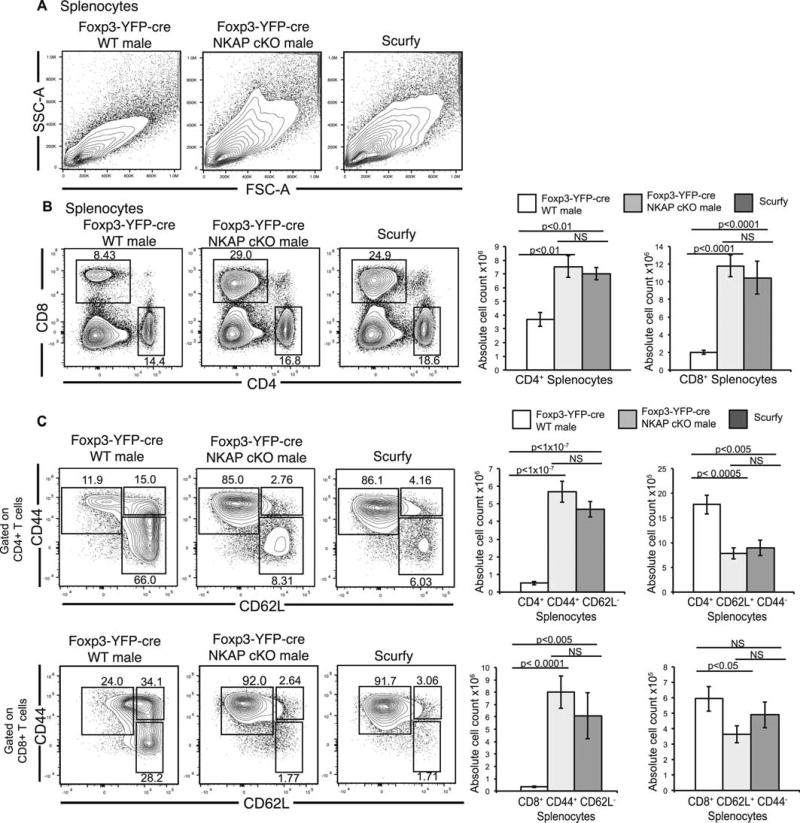
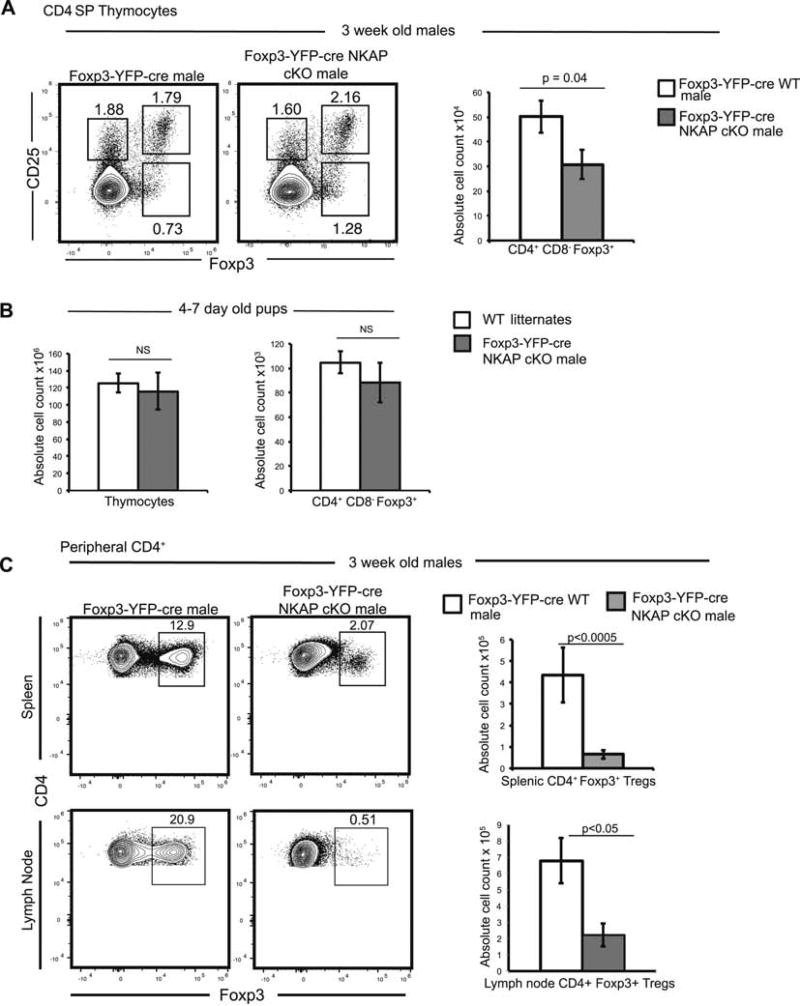
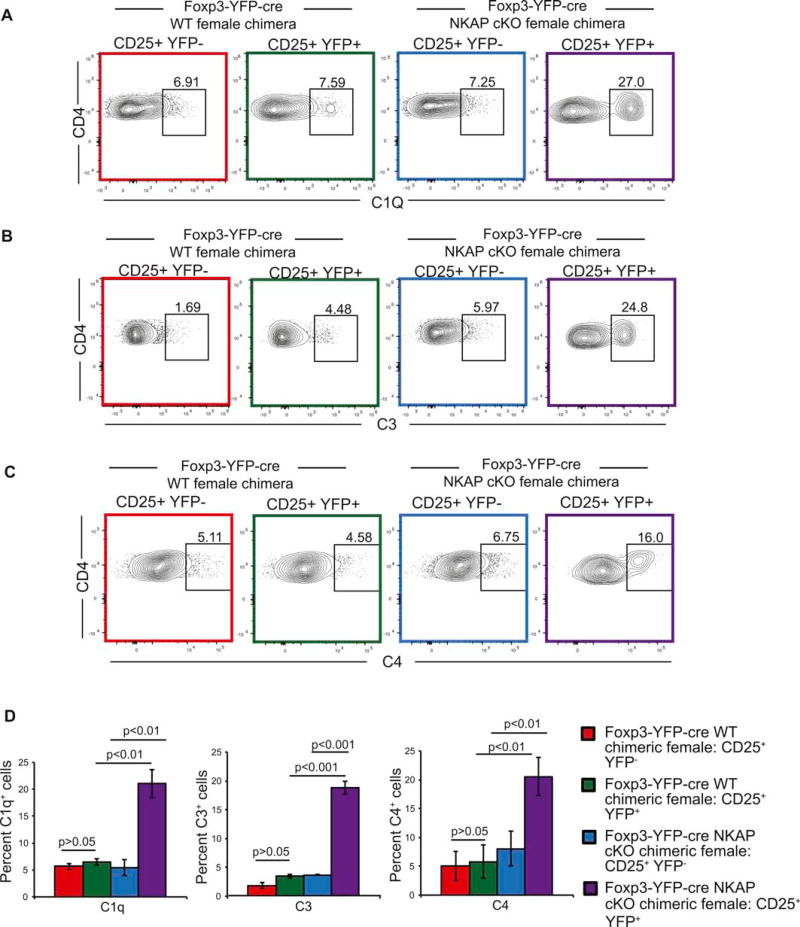
Regulatory T cells are critical for the generation and maintenance of peripheral tolerance. Conditional deletion of the transcriptional repressor NKAP in Tregs using Foxp3-YFP-cre NKAP conditional knockout mice causes aggressive autoimmunity characterized by thymic atrophy, lymphadenopathy, peripheral T cell activation, generation of autoantibodies, immune infiltration into several organs, and crusty skin at 3 weeks of age, similar to that of "scurfy" Foxp3-mutant mice. While Treg development in the thymus proceeds normally in the absence of NKAP, there is a severe loss of thymically-derived Tregs in the periphery. NKAP-deficient Tregs have a recent thymic emigrant phenotype, and are attacked by complement in a cell-intrinsic manner in the periphery. Previously, we demonstrated that NKAP is required for conventional T cell maturation as it prevents complement-mediated attack in the periphery. We now show that Tregs undergo a similar maturation process as conventional T cells, requiring NKAP to acquire complement resistance after thymic egress.

Keywords: Complement; NKAP; Scurfy; Tregs.


Conflict of interest statement

The authors declare no competing financial interests.

Figures

Figure 1
Figure 1. Treg-specific deletion of NKAP recapitulates the “scurfy” phenotype by the age of three weeks
(A) Foxp3-YFP-cre NKAP cKO male mice juxtaposed with wildtype (WT) and Foxp3 mutant scurfy mice as well as spleens, lymph nodes (LN) and thymi. (B) Examination of absolute cell counts of splenocytes, lymph node cells and thymocytes. Bar graphs are averaged absolute cell counts per organ from at least 5 independent experiments with at least 5 mice per group, and error bars are standard error of mean (SEM). (C) Hematoxylin and Eosin staining from sections from Foxp3-YFP-cre NKAP cKO male mice and WT littermate lungs, liver and kidneys at three weeks of age. Data is representative of three organs per genotype. (D) Presence of antinuclear antibodies (ANA) in WT or cKO serum was determined by incubating serum with irradiated HepG2 cells, followed by detection using fluorescent anti-mouse secondary antibody. Data is representative of 15 WT and 17 Foxp3-YFP-cre NKAP cKO male mice. (E) Detection of anti double stranded DNA (dsDNA) antibodies. Data is averaged from of 15 WT and 17 Foxp3-YFP-cre NKAP cKO male mice.
Figure 2
Figure 2. Treg-specific NKAP deletion results in lymphoproliferation and conventional T cell activation
(A) Forward scatter and side scatter analysis of splenocytes from Foxp3-YFP-cre WT, Foxp3-YFP cre NKAP cKO and scurfy mice. (B) Analysis of frequency and absolute numbers of CD4 and CD8 T cells from spleens of Foxp3-YFP-cre WT, Foxp3-YFP-cre NKAP cKO and scurfy mice. (C) Analysis of frequency and absolute numbers of activated memory (CD44+ CD62L) and naïve (CD44+ CD62L) CD4+ and CD8+ T cells from spleens of Foxp3-YFP-cre WT, Foxp3-YFP-cre NKAP cKO and scurfy mice. All data shown are representative of at least 6 independent experiments with 6–7 mice in each group. Bar graphs illustrate mean absolute cell counts and error bars are SEM.
Figure 3
Figure 3. NKAP deficient Tregs develop in the thymus but fail to persist in the periphery
(A) Examination of thymic development of Tregs at three weeks of age. Analysis of frequency of CD25+ Foxp3, CD25 Foxp3+ and CD25+ Foxp3+ cells and absolute cell count of CD4+ CD8 Foxp3+ thymic Tregs. Data is from at least 6 mice per genotype from 3 independent experiments, and bar graphs show mean absolute cell count and SEM. (B) Examination of Treg development in pups aged 4–7 days. Data is from a total of 5 experiments with at least 5 mice in each genotype, and bar graphs show average absolute cell count and SEM. (C) Examination of Treg frequency and absolute cell counts in peripheral lymphoid organs (spleen, and pooled brachial, inguinal and cervical LN). Data is from at least 4 representative independent experiments with at least 4 mice per group, and bar graphs show mean absolute cell count and SEM.
Figure 4
Figure 4. Loss of Tregs as a result of NKAP deficiency is a cell-intrinsic defect
(A) Analysis of Treg development in Foxp3-YFP-cre NKAP cKO chimeric females and Foxp3-YFP-cre WT chimeric females. Data is representative of 7 independent experiments with 7 mice in each group. (B) Analysis of splenic CD4+ CD25+ GITR+ YFP+ Treg and CD4+ CD25+ GITR+ YFP Treg frequencies and examination of expression of Nrp-1 in CD4+ CD25+ YFP+ Tregs, and CD4+ CD25+ YFP Tregs in Foxp3-YFP-cre NKAP cKO chimeric females and Foxp3-YFP-cre WT chimeric females. Data is representative of 6 experiments with 6 mice in each group. (C) Examination of CD44 and CD62L expression in CD4+ CD25+ YFP+ and CD4+ CD25+ YFP Tregs in Foxp3-YFP-cre WT and Foxp3-YFP-cre NKAP cKO female mice. Use of color to identify samples refers to gated populations in (B). Data is representative from 3 independent experiments with at least 3 mice per group. (D) Examination of Qa2 in CD4+ CD25+ YFP+ Tregs in Foxp3-YFP-cre NKAP cKO chimeric females and Foxp3-YFP-cre WT chimeric females. Use of color to identify samples refers to gated populations in (B). Data is representative from 3 independent experiments with at least 3 mice per group. (E) Analysis of TCR excision circle (TREC) performed on CD4+ CD25+ YFP+ cells sorted, from four pairs of mice, a Foxp3- YFP-cre NKAP cKO female chimeric mouse and a Foxp3-YFP cre WT female chimeric mouse. For the final analysis, DNA from one of the WT mice was chosen as a normalizer and a paired Student’s T test was used to determine significance.
Figure 5
Figure 5. Tregs are opsonized by complement proteins
(A–C) Increased deposition of complement components C1q (A), C3 (B) and C4 (C) on NKAP deficient Tregs. Data is from at least 3 independent experiments with at least 3 mice per group). (D) Enumeration of mean frequency of cells bound by complement. Data is from 3 independent experiments with 3 mice per genotype. Bar graphs are mean percent complement positive cells, and error bars are SEM. Throughout the figure, use of color to identify samples refers to gated populations in Figure 5(B).

Similar articles

Cited by

References

    1. Hogquist KA, Jameson SC. The self-obsession of T cells: how TCR signaling thresholds affect fate ‘decisions’ and effector function. Nat. Immunol. 2014;15:815–23. - PMC - PubMed
    1. Jordan MS, et al. Thymic selection of CD4+CD25+ regulatory T cells induced by an agonist self-peptide. Nat. Immunol. 2001;2:301–306. - PubMed
    1. Hsieh C-S, Zheng Y, Liang Y, Fontenot JD, Rudensky AY. An intersection between the self-reactive regulatory and nonregulatory T cell receptor repertoires. Nat. Immunol. 2006;7:401–410. - PubMed
    1. Hsieh C-SS, et al. Recognition of the Peripheral Self by Naturally Arising CD25+ CD4+ T Cell Receptors. Immunity. 2004;21:267–277. - PubMed
    1. Moran AE, et al. T cell receptor signal strength in Treg and iNKT cell development demonstrated by a novel fluorescent reporter mouse. J. Exp. Med. 2011;208:1279–1289. - PMC - PubMed

Publication types