. 2018 Mar 1;200(5):1737-1745.
doi: 10.4049/jimmunol.1701597. Epub 2018 Jan 24.

CD8+ T Cells Lack Local Signals To Produce IFN-γ in the Skin during Leishmania Infection

Affiliations

CD8+ T Cells Lack Local Signals To Produce IFN-γ in the Skin during Leishmania Infection

Fernanda O Novais et al. J Immunol. .

Abstract

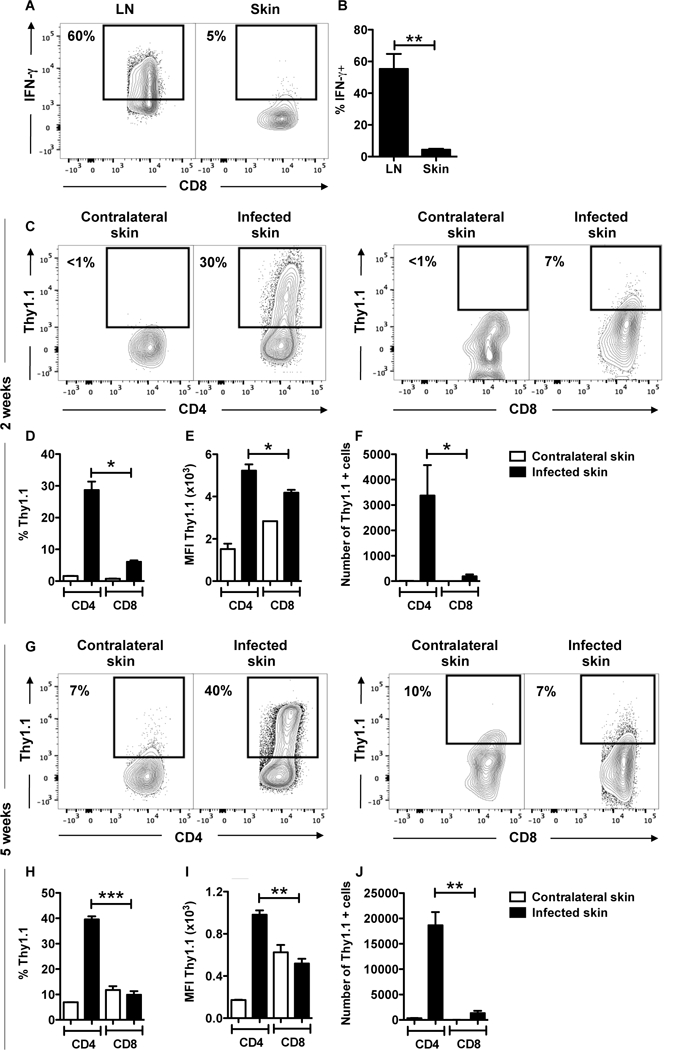
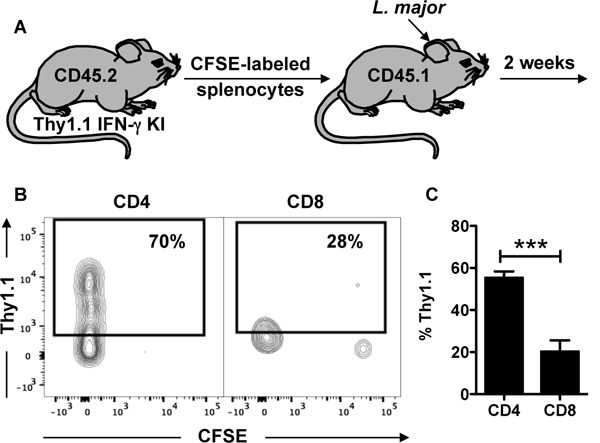
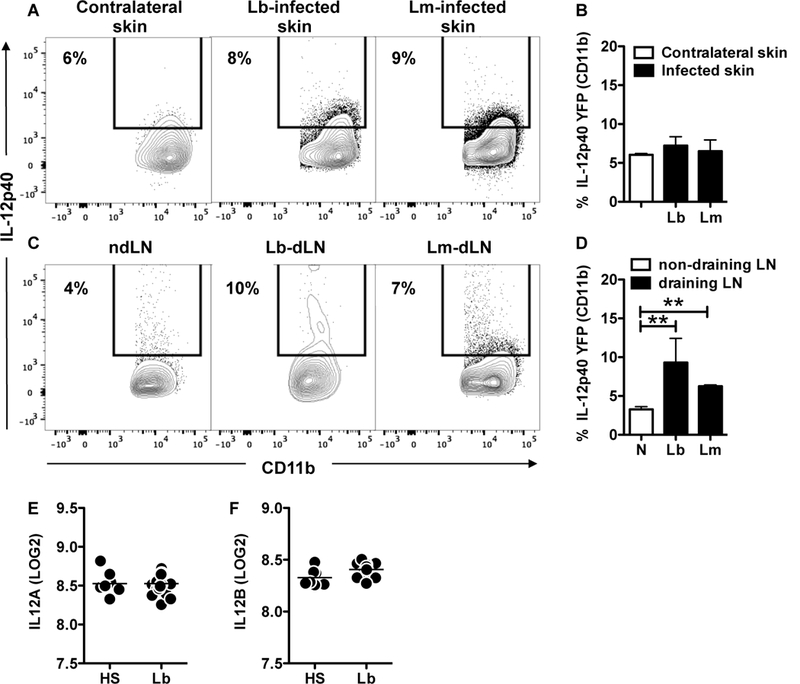
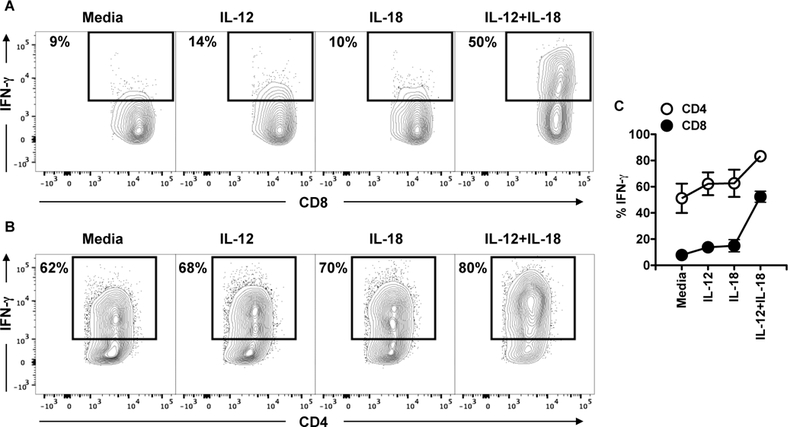
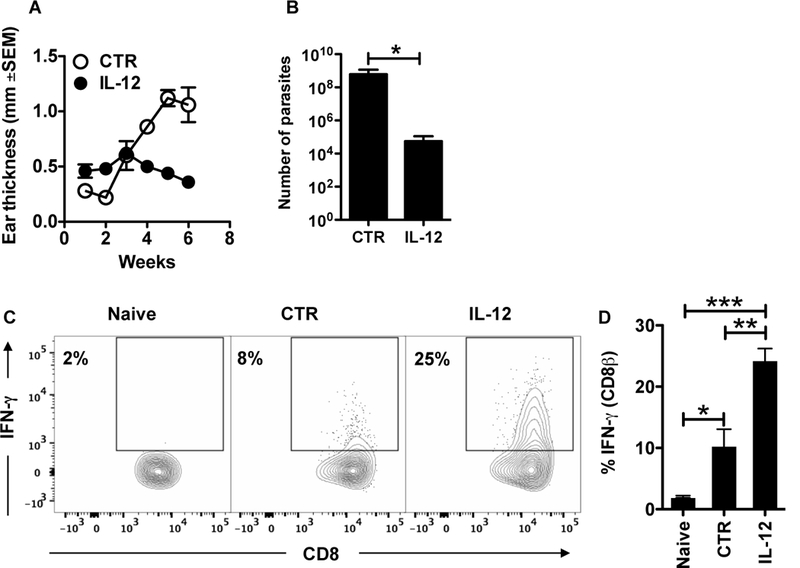
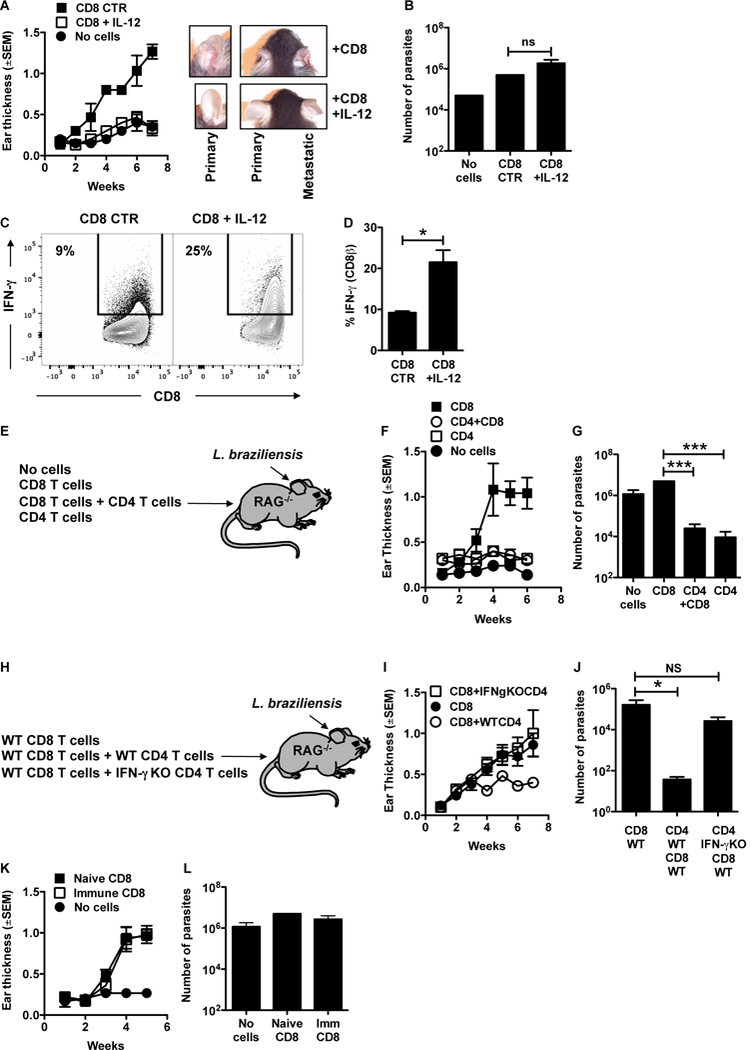
Resolution of leishmaniasis depends upon parasite control and limiting inflammation. CD4+ Th1 cells are required to control parasites, whereas CD8+ T cells play a dual role: they promote Th1 cell differentiation but can also increase inflammation at the site of infection as a consequence of cytolysis. Although CD8+ T cells taken from leishmanial lesions are cytolytic, in this study, we showed that only a few CD8+ T cells produced IFN-γ. Correspondingly, only low levels of IL-12 and/or IL-12 mRNA were present in lesions from infected mice, as well as patients. Addition of IL-12 increased IFN-γ production by CD8+ T cells isolated from leishmanial lesions, suggesting that a lack of IL-12 at the site of infection limits IFN-γ production by CD8+ T cells. To determine whether CD8+ T cells could promote resistance in vivo if IL-12 was present, we administered IL-12 to Leishmania-infected RAG mice reconstituted with CD8+ T cells. IL-12 treatment increased the ability of CD8+ T cells to make IFN-γ, but CD8+ T cells still failed to control the parasites. Furthermore, despite the ability of CD8+ T cells to promote immunity to secondary infections, we also found that CD8+ T cells from immune mice were unable to control Leishmania in RAG mice. Taken together, these results indicate that lesional CD8+ T cells fail to make IFN-γ because of a deficit in IL-12 but that, even with IL-12, CD8+ T cells are unable to control Leishmania in the absence of CD4+ T cells.


Figures

Figure 1:
Figure 1:
CD8+ T cells do not produce IFN-g in the skin in response to L. major. (A, B) C57BL/6 mice were infected in the skin with 106 L. major and 5 weeks post infection mice were euthanized. The expression of intracellular IFN-g in CD8+ T cells was measured by flow cytometry in the draining LNs (LN) and infected ears. Depicted are (A) representative contour plots and bar graphs showing (B) percentage of IFN-g expressing CD8+ T cells in the draining lymph nodes (LN) and infected skin. (C-J) IFN-g reporter (Thy1.1) mice were infected in the skin with 106 L. major and 2 (C-F) or 4 (G-J) weeks post infection mice were euthanized. The expression of Thy1.1 directly ex vivo in CD4+ and CD8+ T cells was measured by flow cytometry in contralateral and infected ears. Depicted are (C, G) representative contour plots and bar graphs showing (D, H) percentage, (E, I) mean fluorescence intensity (MFI) and (F, J) number of Thy 1.1 expressing CD4+ and CD8+ T cells. Flow plots pregated on live/singlets/CD3/CD8b or CD4. Representative data from 3 or more independent experiments (n = 3 – 5 mice per group) are presented. *p ≤ 0.05, **p ≤ 0.01 or *** p≤ 0.001
Figure 2:
Figure 2:
CD8+ T cells that have proliferated in response to L. major infection do not produce IFN-g in the skin. (A) Splenocytes from CD45.2 Thy1.1 IFN-g reporter mice were stained with CFSE and transferred into CD45.1 congenic mice infected with L. major. Two weeks post infection, mice were euthanized and donor cells were analyzed for CFSE dilution and IFN-g production. Depicted are (B) representative contour plots and (C) bar graph of Thy1.1 expressing donor CD4+ and CD8+ T cells. Flow plots pregated on live/singlets/CD3/CD8b or CD4. Representative data from 4 independent experiments (n = 3 mice) are presented. ***p ≤ 0.001
Figure 3:
Figure 3:
IL-12 is not produced in leishmania lesions from mice and humans. IL-12p40 reporter mice were infected in the skin with L. major or L. braziliensis and 2 weeks post infection mice were euthanized. Cells from the (A, B) contralateral (a combination between contralateral skin from Lb and Lm infected mice) and infected skin or (C, D) non-draining (ndLN, a combination between ndLN from Lb and Lm infected mice) and draining lymph nodes (dLN) were analyzed for IL-12p40 expression directly ex vivo by flow cytometry. Depicted are (A, C) representative contour plots and (B, D) bar graphs showing the percentage of IL-12p40+ CD11b cells. Flow plots pregated on live/singlets/CD11b.Representative data from 2 independent experiments (n = 3 mice per group) with similar results are presented. **p ≤ 0.01. LOG2 expression of (E) IL12A and (F) IL12B in the skin of healthy subjects (HS) and L. braziliensis patients (Lb). Data obtained from 10 HS and 25 Lb.
Figure 4:
Figure 4:
CD4+ and CD8+ T cells have different requirements for IFN-g in leishmania-infected skin. C57BL/6 were infected in the skin with 106 L. major and 2 weeks post infection mice were euthanized. Cells from the infected skin were cultured with media or cytokines overnight and BFA for the last 4 hours; the expression of IFN-g was measured by flow cytometry. CD4+ and CD8+ T cells were analyzed for the expression IFN-g by flow cytometry. Depicted are (A and B) representative contour plots and (C) graph showing expression of IFN-g. Representative data from 4 independent experiments (n = 3 mice per group) with similar results are presented.
Figure 5:
Figure 5:
IL-12 treatment enhances IFN-g production by CD8+ T cells in the skin. BALB/c mice were infected in the skin with 105 L. braziliensis in conjunction with a control (CTR) or IL-12 plasmid; (A) ear thickness was assessed weekly. Six weeks post infection mice were euthanized and the (B) number of parasites was determined in the skin and lesions were digested and used for flow cytometric analysis of intracellular IFN-g. Depicted are (C) representative contour plots and (D) bar graph of IFN-g intracelullar staining. Flow plots pregated on live/singlets/CD3/CD8b.Data from one experiment (n = 5 mice per group). *p ≤ 0.05, **p ≤ 0.01 or ***p ≤ 0.001
Figure 6:
Figure 6:
CD8+ T cells are unable to control leishmania infection. (A-D) RAG−/− mice were infected with L. braziliensis and reconstituted with CD8+ T cells or did not receive cells. At days 0 through 9 mice were treated with 0.5 mg/mouse of IL-12 i.p.; (A) course of infection and (B) number of parasites assessed in the skin at 7 weeks post infection. (C) Representative contour plots and (D) bar graphs of IFN-g expression in CD8+ T cells from the skin. Representative data from 4 independent experiments (n = 3 to 5 mice per group) with similar results are presented. Flow plots pregated on live/singlets/CD3/CD8b. (E) RAG−/− mice were infected with L. braziliensis and reconstituted with CD8+ T cells, CD4+ T cells or CD8+ and CD4+ T cells or did not receive cells. (F) Course of infection and (G) number of parasites assessed in the skin at 7 weeks post infection. Representative data from 2 independent experiments (n = 5 mice per group) with similar results are presented. (H) RAG−/− mice were infected with L. braziliensis and reconstituted with WT CD8+ T cells, WT CD8+ and WT CD4+ T cells or WT CD8+ and IFN-g KO CD4+ T cells or did not receive cells. (I) Course of infection and (J) number of parasites assessed in the skin at 7 weeks post infection. (K,L) C57BL/6 mice naive or infected with L. braziliensis for 10–15 weeks were euthanized and splenocytes were used as donors of CD8+ T cells. RAG−/− mice were infected with L. braziliensis and reconstituted with immune or naive CD8+ T cells or did not receive cells and (K) course of infection and (L) number of parasites assessed in the skin at 7 weeks post infection. Representative data from 3 independent experiments for the course of infection with similar results are presented; and one for the parasite titration (n = 5 mice per group) *p ≤ 0.05 or ***p ≤ 0.001; ns, non-significant

Similar articles

Cited by

References

    1. Alvar J, Velez ID, Bern C, Herrero M, Desjeux P, Cano J, Jannin J, den Boer M, and Team WHOLC. 2012. Leishmaniasis worldwide and global estimates of its incidence. PloS one 7: e35671. - PMC - PubMed
    1. Scott P, and Novais FO. 2016. Cutaneous leishmaniasis: immune responses in protection and pathogenesis. Nature reviews. Immunology 16: 581–592. - PubMed
    1. Heinzel FP, Schoenhaut DS, Rerko RM, Rosser LE, and Gately MK. 1993. Recombinant interleukin 12 cures mice infected with Leishmania major. The Journal of experimental medicine 177: 1505–1509. - PMC - PubMed
    1. Scott P, Natovitz P, Coffman RL, Pearce E, and Sher A. 1988. Immunoregulation of cutaneous leishmaniasis. T cell lines that transfer protective immunity or exacerbation belong to different T helper subsets and respond to distinct parasite antigens. The Journal of experimental medicine 168: 1675–1684. - PMC - PubMed
    1. Liew FY, Millott S, Parkinson C, Palmer RM, and Moncada S. 1990. Macrophage killing of Leishmania parasite in vivo is mediated by nitric oxide from L-arginine. Journal of immunology 144: 4794–4797. - PubMed

Publication types