. 2018 Jan;15(138):20170633.
doi: 10.1098/rsif.2017.0633.

The complexity of high-frequency electric fields degrades electrosensory inputs: implications for the jamming avoidance response in weakly electric fish

Affiliations

The complexity of high-frequency electric fields degrades electrosensory inputs: implications for the jamming avoidance response in weakly electric fish

Aaron R Shifman et al. J R Soc Interface. 2018 Jan.

Abstract

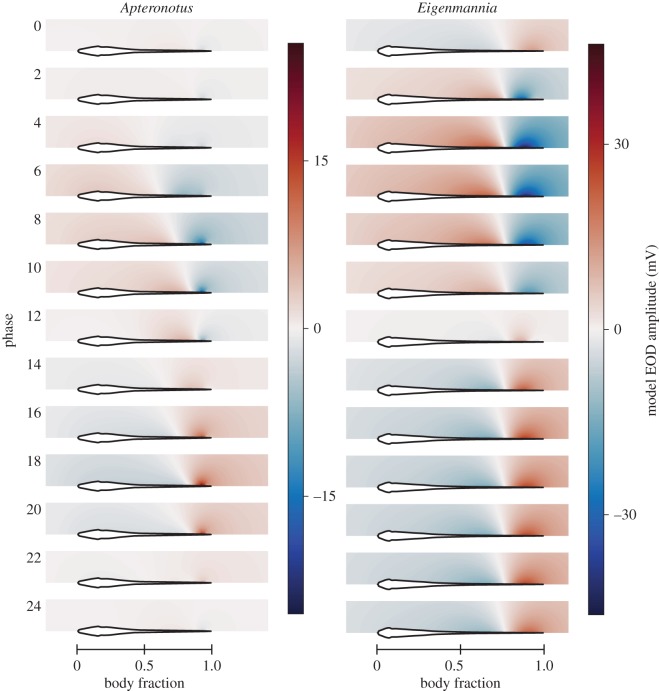
Sensory systems encode environmental information that is necessary for adaptive behavioural choices, and thus greatly influence the evolution of animal behaviour and the underlying neural circuits. Here, we evaluate how the quality of sensory information impacts the jamming avoidance response (JAR) in weakly electric fish. To sense their environment, these fish generate an oscillating electric field: the electric organ discharge (EOD). Nearby fish with similar EOD frequencies perform the JAR to increase the difference between their EOD frequencies, i.e. their difference frequency (DF). The fish determines the sign of the DF: when it has a lower frequency (DF > 0), EOD frequency is decreased and vice versa. We study the sensory basis of the JAR in two species: Apteronotus leptorhynchus have a high frequency (ca 1000 Hz), spatio-temporally heterogeneous electric field, whereas Eigenmannia sp. have a low frequency (ca 300 Hz), spatially uniform field. We show that the increased complexity of the Apteronotus field decreases the reliability of sensory cues used to determine the DF. Interestingly, Apteronotus responds to all JAR stimuli by increasing EOD frequency, having lost the neural pathway that produces JAR-related decreases in EOD frequency. Our results suggest that electric field complexity may have influenced the evolution of the JAR by degrading the related sensory information.

Keywords: Apteronotus; Eigenmannia; amplitude modulation; electrocommunication; signal interference.


Conflict of interest statement

We declare we have no competing interests

Figures

Figure 1.
Figure 1.
Spatio-temporal evolution of the EOD in both Eigenmannia and Apteronotus. Panels show model outputs (voltage map) for 12 phases of one EOD cycle over a representative domain 5 cm from the left of the nose to 30 cm to the right; rostral–caudal length is shown as body fraction in a 26 cm Eigenmannia (EODf = 300 Hz) and a 21 cm Apteronotus (EODf = 600 Hz). Voltage scale (mV) is indicated by the colourbar on the right in each case; note that the ‘zero-line’ is visible as a white (0 V) line separating positive (red) and negative (blue) regions. (Online version in colour.)
Figure 2.
Figure 2.
Computational rules for the jamming avoidance response. (a) Schematic illustration showing the phase precession of an AM signal (upper) due to a +DF, relative to an unmodulated carrier (lower); the ΔΦ is illustrated by the offset between pairs of vertical lines that indicate zero phase in each signal. (b) Phase modulation ΔΦ over an AM cycle for both +DF (green) and −DF (red). (c) Lissajous plots shown in the traditional Cartesian coordinates (left) as well as the polar coordinates used in this study (right). In both representations, ΔΦ is the phase modulation, and the AM is the envelope of the amplitude modulated signal. The arrows indicate the direction of rotation, which uniquely determines the sign of the DF. (Online version in colour.)
Figure 3.
Figure 3.
Sample amplitude modulated waveforms arising from a two-fish paradigm for Apteronotus (left) and Eigenmannia (right). The length of each fish is normalized (body fraction) to facilitate comparison. The AM is created by a pair of transverse electrodes playing a sine wave with DF 1% below the EODf (600 Hz and 300 Hz respectively). Waveforms are sampled at a body fraction of 0.1, 0.25, 0.4, 0.55 and 0.7 (dark to light colours respectively); the lower envelope is highlighted, and one AM cycle is displayed. (Online version in colour.)
Figure 4.
Figure 4.
Analysis of the JAR-related sensory inputs in a two-fish condition. Polar plots for phase and amplitude modulations in both species of fish at body locations as indicated (centre, same locations as those in figure 3). A pair of transverse electrodes play a sine wave with DF ±1% of the EODf. The angle of the polar plot is the phase modulation over time, and the radius is the absolute value of the lower envelope (AM). The arrow indicates rotational direction, and temporal progression through the AM cycle is indicated by the colourbar (beginning: black; end: yellow). The modulation is calculated using a reference location at body fraction of 0.5. (Online version in colour.)
Figure 5.
Figure 5.
Sample amplitude modulated waveforms arising from a three-fish paradigm for Apteronotus (left) and Eigenmannia (right). Similar to figure 3 except the AM is created by a pair of transverse electrodes playing two sine waves with DDF 1% below the EODf (600 Hz and 300 Hz for Apteronotus and Eigenmannia respectively). (Online version in colour.)
Figure 6.
Figure 6.
Analysis of the JAR-related sensory inputs in a three-fish condition. Polar plots for phase and amplitude modulations in both species of fish, similar to figure 4 except the pair of transverse electrodes plays the sum of two sine waves with DDF ±1% of the EODf. (Online version in colour.)
Figure 7.
Figure 7.
Normalized JAR predictions for the two-fish condition. Model predictions are based on the sensory information from the polar plots in figure 4. A positive JAR indicates a rise in frequency, and would be appropriate for a −DF. Multiple estimates of the JAR are calculated, each using a different location along the body as a reference. Results are plotted as mean ± s.d. over the different reference locations. (Online version in colour.)
Figure 8.
Figure 8.
Normalized SER predictions for the three-fish condition. Model predictions are illustrated as in figure 7, but are based on the sensory information from the polar plots in figure 6. (Online version in colour.)

Similar articles

Cited by

References

    1. Moller P. 1995. Electric fishes: history and behavior. London, UK: Chapman & Hall.
    1. Lissmann HW. 1958. On the function and evolution of electric organs in fish. J. Exp. Biol. 35, 156–191.
    1. Bennett M. 1971. Electroreception. In Fish physiology (eds WS Hoar, DL Randall), pp. 493–574. New: York, NY: Academic Press.
    1. Heiligenberg W, Baker C, Matsubara J. 1978. The jamming avoidance response in Eigenmannia revisited: the structure of a neuronal democracy. J. Comp. Physiol. 127, 267–286. (10.1007/BF01350117) - DOI
    1. Heiligenberg W. 1991. Neural nets in electric fish. Cambridge, MA: MIT Press.

Publication types

MeSH terms

LinkOut - more resources