Review
. 2018 Jan;15(138):20170736.
doi: 10.1098/rsif.2017.0736. Epub 2018 Jan 24.

Quantitative approaches to energy and glucose homeostasis: machine learning and modelling for precision understanding and prediction

Affiliations
Review

Quantitative approaches to energy and glucose homeostasis: machine learning and modelling for precision understanding and prediction

Thomas McGrath et al. J R Soc Interface. 2018 Jan.

Abstract

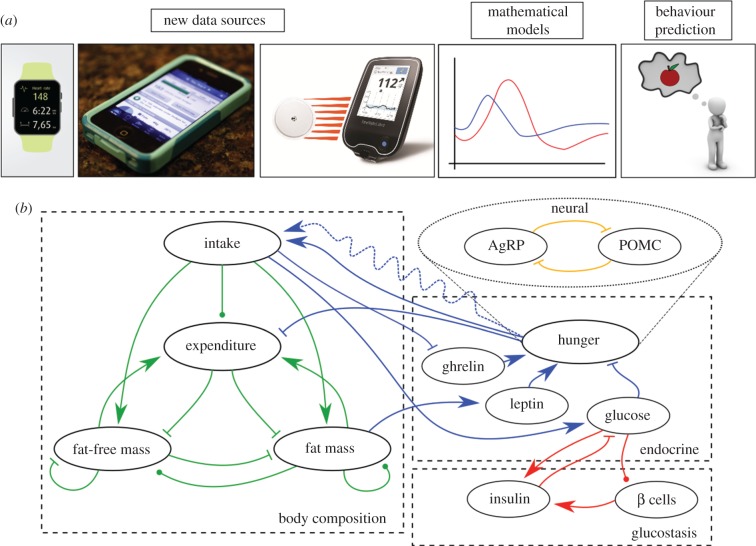
Obesity is a major global public health problem. Understanding how energy homeostasis is regulated, and can become dysregulated, is crucial for developing new treatments for obesity. Detailed recording of individual behaviour and new imaging modalities offer the prospect of medically relevant models of energy homeostasis that are both understandable and individually predictive. The profusion of data from these sources has led to an interest in applying machine learning techniques to gain insight from these large, relatively unstructured datasets. We review both physiological models and machine learning results across a diverse range of applications in energy homeostasis, and highlight how modelling and machine learning can work together to improve predictive ability. We collect quantitative details in a comprehensive mathematical supplement. We also discuss the prospects of forecasting homeostatic behaviour and stress the importance of characterizing stochasticity within and between individuals in order to provide practical, tailored forecasts and guidance to combat the spread of obesity.

Keywords: energy homeostasis; glucostasis; machine learning; mathematical biology.


Conflict of interest statement

We declare we have no competing interests.

Figures

Figure 1.
Figure 1.
New data sources need new modelling techniques to maximize their predictive ability. In particular, we can now work towards understanding the roles of inter-individual variation and stochasticity because of the finer temporal resolution allowed by personal omics devices (a). These can be fed into traditional physiological models, summarized in (b), to understand how observed feeding behaviour affects internal state, for example, blood glucose or endocrine levels. The state of the art across the literature is summarized here: each model in this review contains a subset of these entities and connections. Lines with arrowheads indicate positive effects, bar ends denote negative effects and circular ends can be positive or negative. Glucostatic models (red lines, §2) investigate the dynamics of glucose, insulin and pancreatic β cells in response to glucose infusion. Endocrine models (blue lines, §2) are a relatively recent development, and model how endocrine mechanisms mediate energy intake and expenditure. Energy balance models (green lines, §3) consider the distribution of calories within the body, but do not typically predict intake or expenditure. The link between physiological state and behaviour is often considered through the perspective of control theory (§4), although stochastic control policies (represented by the dashed line) have not received sufficient attention, leading to poor predictive ability.
Figure 2.
Figure 2.
(a) Dynamical systems models of glucostasis illustrate the importance of considering both short- and long-term behaviour. The schematic on the left illustrates the interplay between short-term glucostasis due to the action of insulin and the long-term effect of elevated glucose on the β cells in the pancreas. Initially, the glucose/insulin system is at a fixed point: glucose and insulin concentrations are stable. After receiving a glucose spike, for instance following a meal, the system evolves towards a new set point at a higher glucose concentration. Glucose levels above a certain level lead to pancreatic β cell death (shaded region) and the amount of time the system spends in this region, as well as the amount glucose levels exceed the threshold, determine the level of β cell damage. This damage reduces insulin secretion, which in turn moves the fixed point to a new value. The degree to which this movement occurs in a single cycle has been exaggerated to increase the clarity of the figure. (b) A similar model of leptin resistance, in which leptin receptor density depends nonlinearly on leptin concentration, also shows a rich phenomenology. As the effect of leptin concentration on food intake and the rate at which excess leptin concentration causes receptor desensitization are varied (as can happen when exposed to more palatable food and during ageing, respectively), the steady state of the system can vary sharply. A mouse with initial low body fat will return to a healthy steady state, whereas an obese one will return to obesity following a perturbation.
Figure 3.
Figure 3.
Multiple-compartment models can have different stability properties depending on the rules governing energy partitioning and expenditure. These stability properties can lead to significant differences in physiological outcomes—at a stable fixed point any disturbance, such as a change in energy intake, will lead to compensatory changes that return the system's state to the fixed point. Multiple fixed points are similar, except that the system will reach differing fixed points depending on its state, so potentially large nudges may be needed to move from one fixed point to another. The existence of two stable fixed points implies the existence of an unstable fixed point. Finally, the system is stable at all points along a stable manifold, so small perturbations allow the system to be nudged to other states on the manifold.
Figure 4.
Figure 4.
Apparent stochasticity in inter-meal intervals is partially explained by stomach fullness: when the stomach is empty, feeding bouts are very likely to commence. (a) Feeding bout data indicating time, duration and average feeding rate. Each meal is composed of multiple feeding bouts, and terminated with a longer pause. Shaded areas indicate dark period (1800–0600). Data are from a male Wistar rat recovering from a fast, observed using an open-circuit comprehensive laboratory animal monitoring system (CLAMS; Columbus Instruments, OH, USA). (b) Feeding data are converted to calculated stomach fullness by use of the model for gastric emptying in [104]. Daytime feeding terminates at a lower level than feeding in the dark period (shaded area, as above), and stomach fullness reaches a characteristic peak around midnight.

Similar articles

Cited by

References

    1. Zeevi D, et al. 2015. Personalized nutrition by prediction of glycemic responses. Cell 163, 1079–1094. (10.1016/j.cell.2015.11.001) - DOI - PubMed
    1. Bengio Y, Goodfellow IJ, Courville A. 2015. Deep learning. Nature 521, 436–444. (10.1038/nature14539) - DOI - PubMed
    1. Bishop CM. 2006. Pattern recognition. Mach. Learn. 128, 1–58.
    1. Friedman J, Hastie T, Tibshirani R. 2001. The elements of statistical learning, Vol. 1 Series in statistics Springer Berlin, Germany: Springer.
    1. Murphy KP. 2012. Machine learning: a probabilistic perspective. Cambridge, MA: MIT press.

Publication types