. 2018 Mar 14;92(7):e01918-17.
doi: 10.1128/JVI.01918-17. Print 2018 Apr 1.

Epstein-Barr Virus (EBV) Latent Protein EBNA3A Directly Targets and Silences the STK39 Gene in B Cells Infected by EBV

Affiliations

Epstein-Barr Virus (EBV) Latent Protein EBNA3A Directly Targets and Silences the STK39 Gene in B Cells Infected by EBV

Quentin Bazot et al. J Virol. .

Abstract

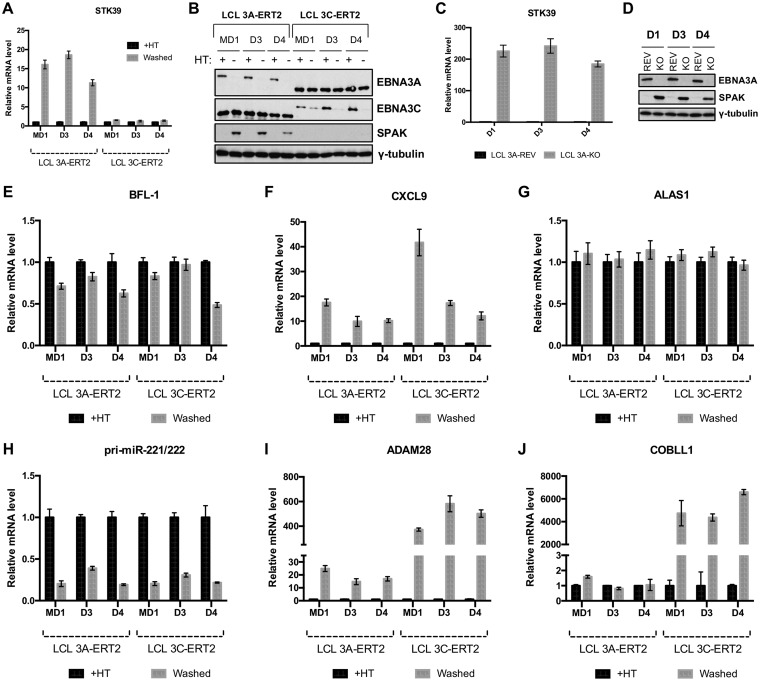
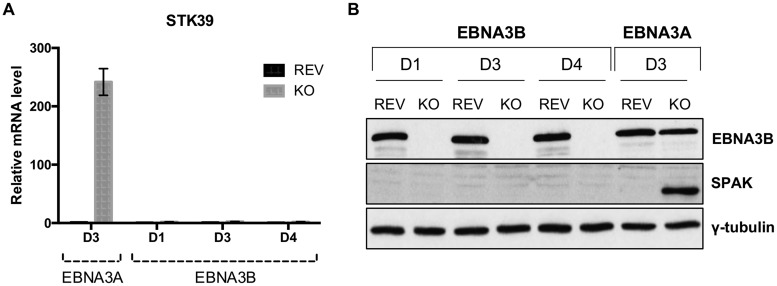
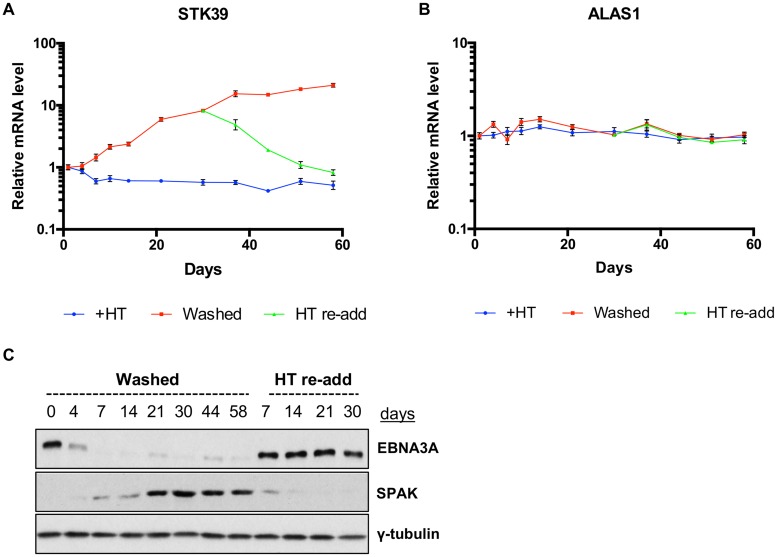
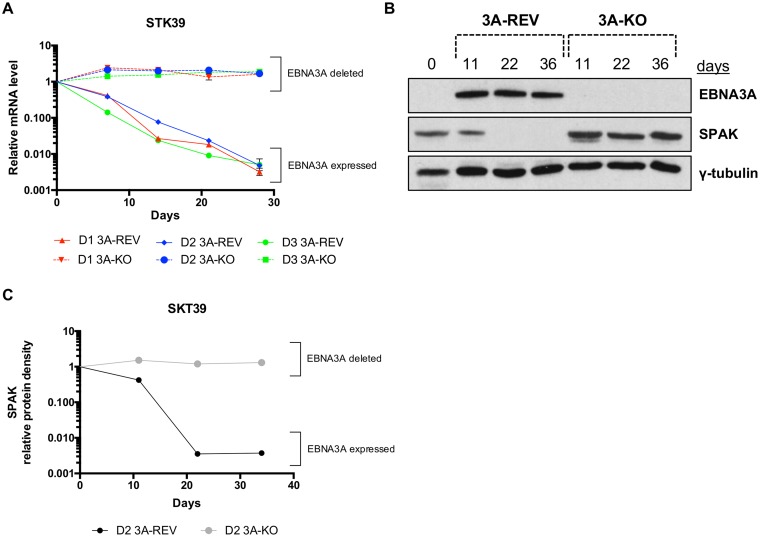
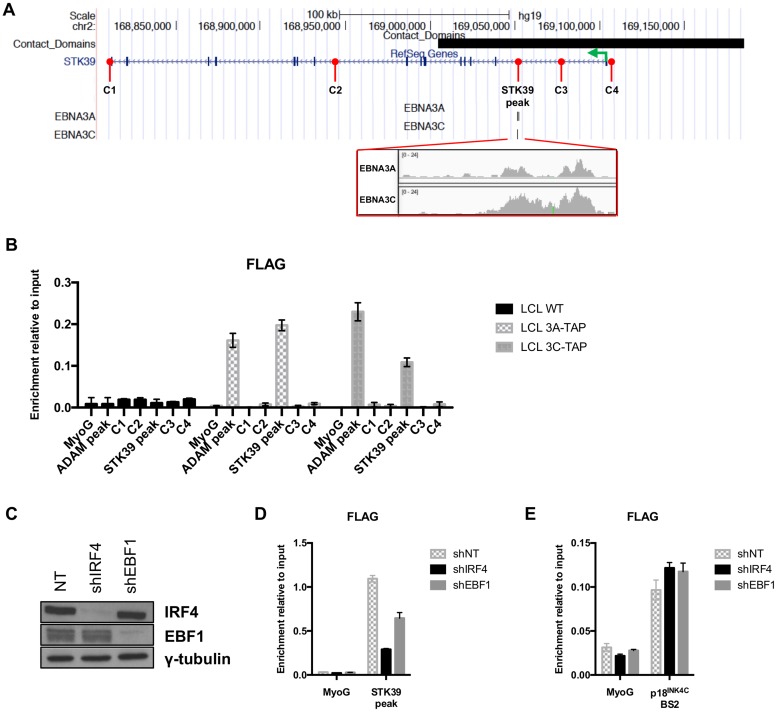
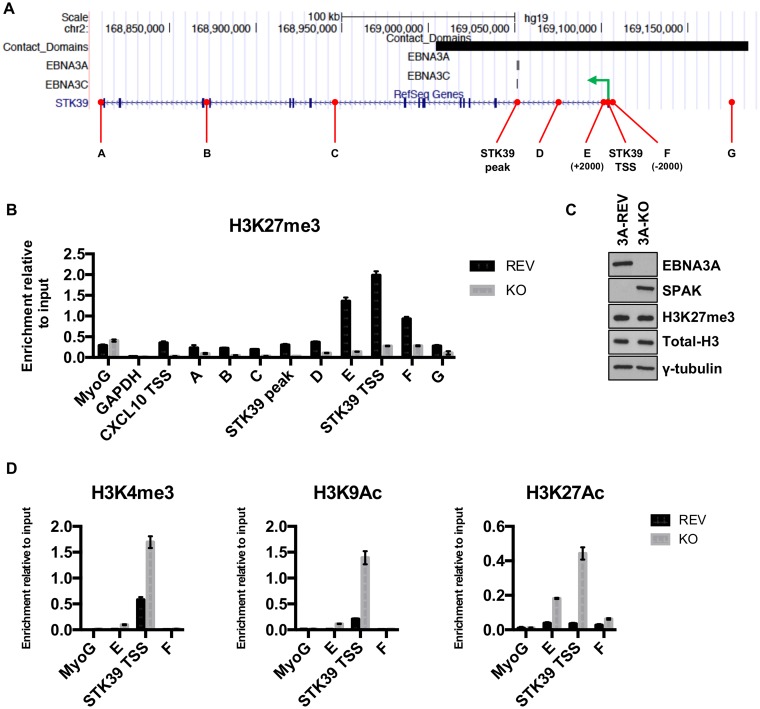
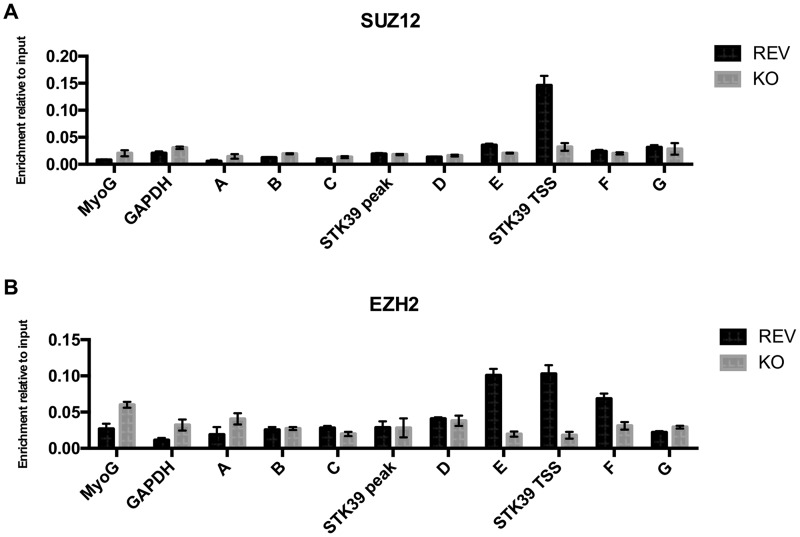
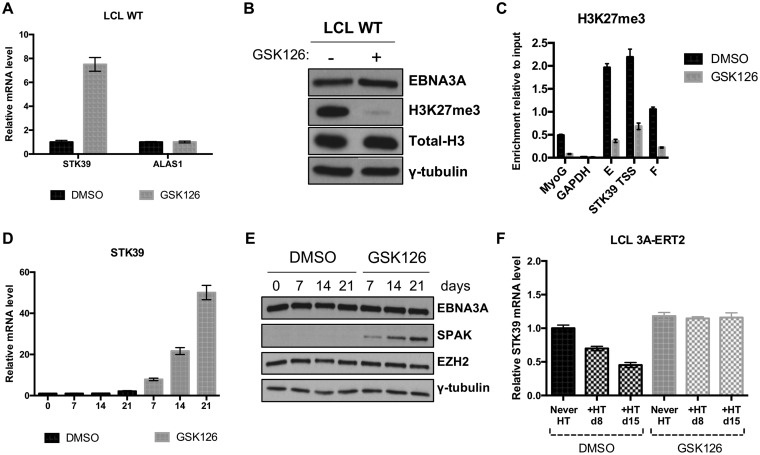
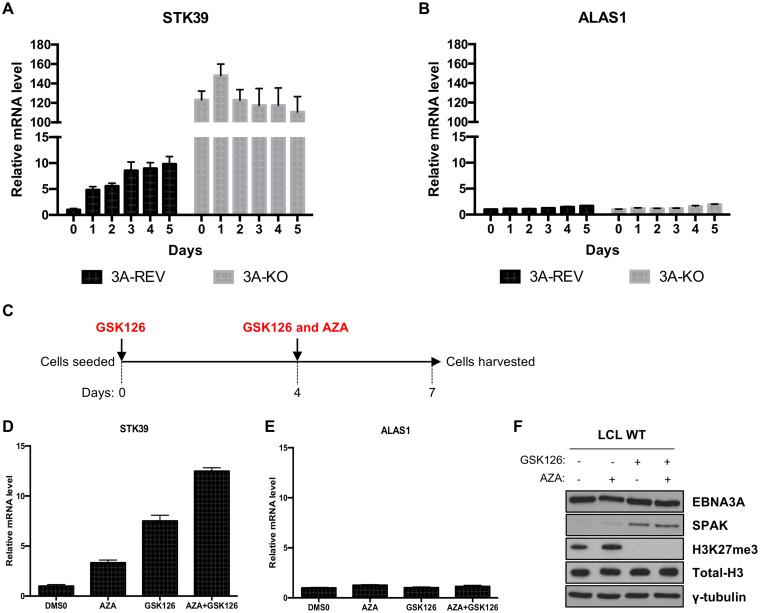
Epstein-Barr virus (EBV) establishes latent infection in human B cells and is associated with a wide range of cancers. The EBV nuclear antigen 3 (EBNA3) family proteins are critical for B cell transformation and function as transcriptional regulators. It is well established that EBNA3A and EBNA3C cooperate in the regulation of cellular genes. Here, we demonstrate that the gene STK39 is repressed only by EBNA3A. This is the first example of a gene regulated only by EBNA3A in EBV-transformed lymphoblastoid cell lines (LCLs) without the help of EBNA3C. This was demonstrated using a variety of LCLs carrying either knockout, revertant, or conditional EBNA3 recombinants. Investigating the kinetics of EBNA3A-mediated changes in STK39 expression showed that STK39 becomes derepressed quickly after EBNA3A inactivation. This derepression is reversible as EBNA3A reactivation represses STK39 in the same cells expressing a conditional EBNA3A. STK39 is silenced shortly after primary B cell infection by EBV, and no STK39-encoded protein (SPAK) is detected 3 weeks postinfection. Chromatin immunoprecipitation (ChIP) analysis indicates that EBNA3A directly binds to a regulatory region downstream of the STK39 transcription start site. For the first time, we demonstrated that the polycomb repressive complex 2 with the deposition of the repressive mark H3K27me3 is not only important for the maintenance of an EBNA3A target gene (STK39) but is also essential for the initial establishment of its silencing. Finally, we showed that DNA methyltransferases are involved in the EBNA3A-mediated repression of STK39IMPORTANCE EBV is well known for its ability to transform B lymphocytes to continuously proliferating lymphoblastoid cell lines. This is achieved in part by the reprogramming of cellular gene transcription by EBV transcription factors, including the EBNA3 proteins that play a crucial role in this process. In the present study, we found that EBNA3A epigenetically silences STK39 This is the first gene where EBNA3A has been found to exert its repressive role by itself, without needing its coregulators EBNA3B and EBNA3C. Furthermore, we demonstrated that the polycomb repressor complex is essential for EBNA3A-mediated repression of STK39 Findings in this study provide new insights into the regulation of cellular genes by the transcription factor EBNA3A.

Keywords: EBNA3; Epstein-Barr virus; transcriptional regulation; virology.


Figures

FIG 1
FIG 1
EBNA3A is required to repress the STK39 gene. (A) STK39 mRNA expression in three independent EBNA3A-ERT2 LCLs as well as three independent EBNA3C-ERT2 LCLs (MD1, D3, and D4) cultured for 28 days with (+HT) or without (Washed) HT. STK39 gene expression was normalized to the endogenous control GNB2L1 and is shown relative to LCL 3A-ERT2 MD1 (+HT), the STK39 level of which was set to 1. (B) EBNA3A, EBNA3C, SPAK, and γ-tubulin protein expression in EBNA3A-ERT2 and EBNA3C-ERT2 LCLs used in the experiment in panel A. (C) STK39 mRNA expression in three independent EBNA3A-KO and EBNA3A-REV LCLs (D1, D3, and D4). STK39 gene expression was normalized to the endogenous control GNB2L1 and is shown relative to LCL 3A-REV D1, the STK39 level of which was set to 1. (D) EBNA3A, SPAK, and γ-tubulin protein expression in EBNA3A-KO and EBNA3A-REV LCLs used in the experiment in panel C. (E to J) Expression levels of BFL-1 (E), CXCL9 (F), ALAS1 (G), pri-miR-221/222 (H), ADAM28 (I), and COBLL1 (J) were determined in 3 independent 3A-ERT2 LCLs and 3C-ERT2 LCLs used in the experiment in panel A.
FIG 2
FIG 2
EBNA3B does not regulate STK39 expression. (A) STK39 mRNA expression for LCL EBNA3A-KO and EBNA3A-REV D3 and three independent EBNA3B-KO and EBNA3B-REV LCLs (D1, D3, and D4). (B) EBNA3B, SPAK, and γ-tubulin protein expression in LCLs used in the experiment in panel A.
FIG 3
FIG 3
Kinetics of STK39 derepression in EBNA3A conditional cell line. (A and B) Time course using EBNA3A-conditional LCL 3A-ERT2 MD1. Cells were grown over 60 days either in the presence of HT (+HT), in the absence of HT (washed), or with HT readded after 30 days in the washed state (HT re-add). Gene expression for STK39 (A) and ALAS1 (B) was normalized to the endogenous control GNB2L1 and is shown relative to +HT at day 0. Data are representative of two independent time course experiments. (C) EBNA3A, SPAK, and γ-tubulin protein expression during LCL 3A-ERT2 MD1 time course in the absence of HT (washed) or after readdition of HT after 30 days in the washed state (HT re-add).
FIG 4
FIG 4
Repression of STK39 after infection of primary B cells with EBV. (A) CD19+ purified B cells from three independent donors (D1, D2, and D3) were infected with EBNA3A-KO or EBNA3A-REV recombinant EBV and cultured for 30 days. RNA samples were taken at the times indicated after infection, and qPCR analysis was performed on each. STK39 mRNA expression was normalized to the endogenous control GNB2L1, and fold changes are shown relative to uninfected B cells at day 0. (B) EBNA3A, SPAK, and γ-tubulin protein expression during primary B cell infection with EBNA3A-KO or EBNA3A-REV recombinant EBV. (C) SPAK Western blot protein bands shown in panel B were analyzed by ImageJ software and represented based on the internal loading control γ-tubulin.
FIG 5
FIG 5
EBNA3A binds the STK39 locus. (A) Schematic of the STK39 genomic locus generated from the UCSC Genome Browser with the EBNA3A and EBNA3C peaks and contact domain (black rectangle). Sequencing reads are also shown around the EBNA3A and EBNA3C binding site (red rectangle). The green arrow shows the transcription start site of STK39. Positions of control primer (C1, C2, C3, and C4) pairs as well as the STK39 peak primer pair used for qPCR to analyze precipitated DNA from ChIP are also shown in red. (B) ChIP qPCR analyses using anti-FLAG antibody to precipitate 3A-TAP or 3C-TAP and chromatin associated with it in LCL 3A-TAP or LCL 3C-TAP were performed. As a control for antibody specificity, a similar ChIP assay was performed using an LCL infected with wild type (B95.8-BAC; LCL WT). Primers for the Myoglobin promoter (MyoG) were used for qPCR as a negative control, whereas primers for known EBNA3A/3C binding sites at the ADAM28/ADAMDEC1 intergenic enhancer (ADAM peak) were used as positive controls of EBNA3A/3C binding. Values represent ratios of chromatin precipitated, after correction for IgG, relative to 2.5% of input. Standard deviations are calculated from qPCR triplicates for each sample. (C) IRF4, EBF1, and γ-tubulin protein expression after infection of LCL 3A-TAP with lentiviruses carrying shRNA nontargeting (NT) control, shIRF4, or shEBF1 for 8 days. (D) LCL 3A-TAP infected with lentiviruses carrying a control nontargeting (NT) shRNA or shRNA directed against IRF4 (shIRF4) and EBF1 (shEBF1) for 8 days was subjected to ChIP qPCR analyses using anti-FLAG antibody as in panel B, to precipitate 3A-TAP and chromatin associated at the STK39 peak. (E) Same as the experiment in panel D but using primers for the p18INK4C site.
FIG 6
FIG 6
The STK39 genomic locus is epigenetically modified by EBNA3A. (A) Schematic of the STK39 genomic locus generated from the UCSC Genome Browser with the EBNA3A and EBNA3C peaks and contact domain (black rectangle). The green arrow shows the transcription start site of STK39. Positions of primer pairs used for qPCR to analyze precipitated DNA from ChIP are shown in red. (B) ChIP was performed on extracts from EBNA3A-KO and EBNA3A-REV LCLs (D3), and antibody specific for H3K27me3 was used. Primer pairs for Myoglobin (MyoG) and GAPDH were used as positive and negative controls, respectively, whereas a primer pair for the CXCL10 TSS was used as a control for the cell lines. Values represent ratios of chromatin precipitated, after correction for IgG, relative to 2.5% of input. Standard deviations are calculated from qPCR triplicates for each sample. (C) EBNA3A, SPAK, H3K27me3, total H3, and γ-tubulin protein expression in LCL EBNA3A-KO or EBNA3A-REV carrying recombinant EBV used in panel B. (D) ChIP was performed on extracts from EBNA3A-KO and EBNA3A-REV LCLs used in panel B, and antibodies specific for H3K4me3, H3K9Ac, and H3K27Ac were used. Values represent ratios of chromatin precipitated, after correction for IgG, relative to 2.5% of input. Standard deviations are calculated from qPCR triplicates for each sample.
FIG 7
FIG 7
PRC2 is recruited to the STK39 locus in LCL EBNA3A-REV. ChIP was performed on extracts from EBNA3A-KO and EBNA3A-REV LCL (D3), and antibodies specific for SUZ12 (A) and EZH2 (B) were used. Values represent ratios of chromatin precipitated, after correction for IgG, relative to 2.5% of input. Standard deviations are calculated from qPCR triplicates for each sample.
FIG 8
FIG 8
PRC2 and the histone modification H3K27me3 play an essential role in the EBNA3A-mediated repression of STK39. (A) An established wild-type (WT) (B95.8-BAC) LCL was treated with either the vehicle control DMSO or the EZH2 inhibitor GSK126 for 7 days. Analysis of expression of STK39 and ALAS1 was performed by qPCR, and mRNA expression was normalized to the endogenous control GNB2L1 and is shown relative to each DMSO treatment. Standard deviations are calculated from qPCR triplicates for each sample. Data are representative of at least 3 independent experiments. (B) Western blotting extracts of the same cells as in the experiments in panel A show expression of EBNA3A, H3K27me3, total H3, and γ-tubulin. (C) H3K27me7 level was assessed by ChIP assay on cells used in the experiment in panel A. Values represent ratios of chromatin precipitated, after correction for IgG, relative to 2.5% of input. Standard deviations are calculated from qPCR triplicates for each sample. (D) Time course using WT LCL. Cells were grown over 21 days with either the vehicle control DMSO or GSK126. RNA samples were taken at the days indicated after infection, and qPCR analysis was performed on each. Gene expression for STK39 was normalized to the endogenous control GNB2L1 and is shown relative to day 0. Standard deviations are calculated from qPCR triplicates for each sample. (E) Western blotting extracts of the same cells used in the experiment in panel D show expression of EBNA3A, SPAK, EZH2, and γ-tubulin. (F) STK39 mRNA expression using LCL 3A-ERT2 established without HT (Never HT). Cells were grown for 5 days with either the vehicle control DMSO or GSK126 before adding HT or not for 15 days. Gene expression for STK39 was normalized to the endogenous control GNB2L1 and is shown relative to the DMSO-treated 3A-ERT2 Never HT LCL. Standard deviations are calculated from qPCR triplicates for each sample.
FIG 9
FIG 9
DNA methyltransferases are involved in the EBNA3A-mediated silencing of STK39. (A and B) LCL EBNA3A-REV and LCL EBNA3A-KO were treated with 5-azacytidine for 5 days. RNA samples were taken every day, and qPCR analysis was performed on each. STK39 (A) and ALAS1 (B) gene expression was normalized to the endogenous control GNB2L1 and is shown relative to LCL 3A-REV at day 0. (C) Schematic of the experimental protocol of the dual drug treatment. WT LCLs were seeded at day 0 and treated with either DMSO or GSK126. At day 4, cells were split in half and treated with either DMSO, GSK126, DMSO with AZA, or GSK with AZA for 3 days before being harvested for analysis. (D and E) STK39 (D) and ALAS1 (E) gene expression was measured by qPCR, was normalized to the endogenous control GNB2L1, and is shown relative to each DMSO treatment at day 7. Standard deviations are calculated from qPCR triplicates for each sample. (F) Western blotting extracts of the same cells as used in the experiments in panels D and E show expression of EBNA3A, SPAK, H3K27me3, total H3, and γ-tubulin.

Similar articles

Cited by

References

    1. Kutok JL, Wang F. 2006. Spectrum of Epstein-Barr virus-associated diseases. Annu Rev Pathol Mech Dis 1:375–404. doi:10.1146/annurev.pathol.1.110304.100209. - DOI - PubMed
    1. Young LS, Yap LF, Murray PG. 2016. Epstein-Barr virus: more than 50 years old and still providing surprises. Nat Rev Cancer 16:789–802. doi:10.1038/nrc.2016.92. - DOI - PubMed
    1. Forte E, Luftig MA. 2011. The role of microRNAs in Epstein-Barr virus latency and lytic reactivation. Microbes Infect 13:1156–1167. doi:10.1016/j.micinf.2011.07.007. - DOI - PMC - PubMed
    1. Seto E, Moosmann A, Grömminger S, Walz N, Grundhoff A, Hammerschmidt W. 2010. Micro RNAs of Epstein-Barr virus promote cell cycle progression and prevent apoptosis of primary human B cells. PLoS Pathog 6:e1001063. doi:10.1371/journal.ppat.1001063. - DOI - PMC - PubMed
    1. Albanese M, Tagawa T, Buschle A, Hammerschmidt W. 2017. MicroRNAs of Epstein-Barr virus control innate and adaptive antiviral immunity. J Virol 91:e01667-. doi:10.1128/JVI.01667-16. - DOI - PMC - PubMed

Publication types

MeSH terms

Substances