

Che-1 is targeted by c-Myc to sustain proliferation in pre-B-cell acute lymphoblastic leukemia
- PMID: 29367285
- PMCID: PMC5835840
- DOI: 10.15252/embr.201744871
Che-1 is targeted by c-Myc to sustain proliferation in pre-B-cell acute lymphoblastic leukemia
Abstract
Despite progress in treating B-cell precursor acute lymphoblastic leukemia (BCP-ALL), disease recurrence remains the main cause of treatment failure. New strategies to improve therapeutic outcomes are needed, particularly in high-risk relapsed patients. Che-1/AATF (Che-1) is an RNA polymerase II-binding protein involved in proliferation and tumor survival, but its role in hematological malignancies has not been clarified. Here, we show that Che-1 is overexpressed in pediatric BCP-ALL during disease onset and at relapse, and that its depletion inhibits the proliferation of BCP-ALL cells. Furthermore, we report that c-Myc regulates Che-1 expression by direct binding to its promoter and describe a strict correlation between Che-1 expression and c-Myc expression. RNA-seq analyses upon Che-1 or c-Myc depletion reveal a strong overlap of the respective controlled pathways. Genomewide ChIP-seq experiments suggest that Che-1 acts as a downstream effector of c-Myc. These results identify the pivotal role of Che-1 in the control of BCP-ALL proliferation and present the protein as a possible therapeutic target in children with relapsed BCP-ALL.
Keywords: BCP‐ALL; Che‐1; c‐Myc; leukemogenesis; proliferation.
© 2018 The Authors.
Figures
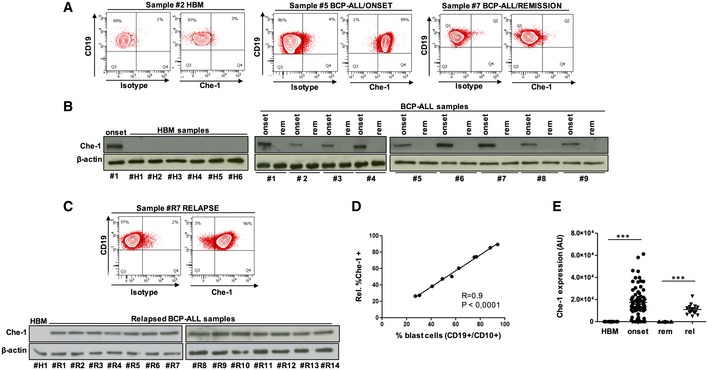
FACS analysis for Che‐1 expression in the CD19+/CD10+ cellular subsets of representative HBM (#2), BCP‐ALL/ONSET (#5), and BCP‐ALL/REMISSION (#7) samples.
Evaluation of Che‐1 expression by Western blot (WB) in six representative samples of HBMs (#H1–#H6) and in nine samples of BCP‐ALL BM analyzed at time of diagnosis (onset) and at time of remission (rem) (#1–#9). β‐actin was used as loading control. #1 BCP‐ALL sample (onset) was used as positive control.
Representative FACS analysis of a RELAPSE sample (#R7) (upper panel). WB analysis of Che‐1 in the BM from 14 samples at time of relapse (#R1–#R14). β‐actin was used as loading control. #H1 sample was used as negative control (bottom panel).
Graphic representation of the direct correlation existing between the percentage of blast cells and the percentage of Che‐1 expressing cells, evaluated by FACS analysis.
Distribution of Che‐1 expression (arbitrary units, AU) in the total number of HBMs (15), BCP‐ALL BMs (80), BCP‐ALL/REMISSION (28), and RELAPSE (14). ***P ≤ 0.001 by Mann‐Whitney U‐test.
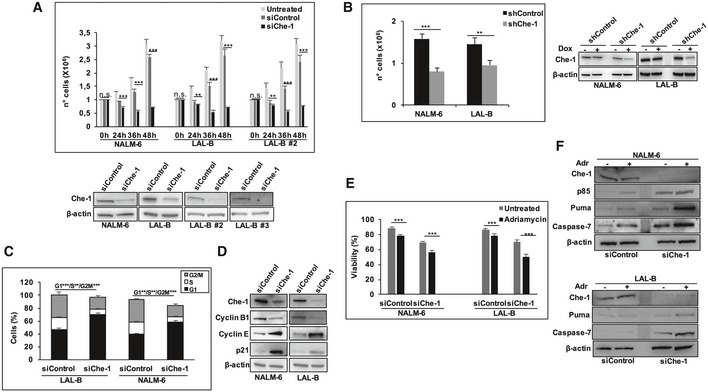
Proliferation assay was performed in NALM‐6, LAL‐B, and LAL‐B#2 cells upon 24, 36, and 48 h of siRNA nucleoporation. Error bars represent the standard error of three different experiments (upper panel). WB analysis of total cell extracts (TCEs) from NALM‐6, LAL‐B, LAL‐B#2, LAL‐B#3 cells transiently transfected by nucleo‐electroporation with siRNA targeting Che‐1 (siChe‐1) or with siRNA for a control sequence (siControl) for 36 h. β‐actin was used as loading control (bottom panel).
NALM‐6 and LAL‐B cells were infected with LV‐THsh/Che‐1 (shChe‐1) or LV/THsh/Control (shControl) and LV‐tTR‐KRAB lentiviruses. TCEs from cells induced (+Dox) or not (−Dox) were analyzed by cell number (left panel) and WB (right panel). Error bars represent the standard error of three different experiments.
Cells treated as in (A) were fixed and stained with propidium iodide (PI) and analyzed for DNA content by flow cytometry. Error bars represent the standard error of three different experiments.
TCEs from NALM‐6 and LAL‐B cells nucleoporated as in (A) were blotted and analyzed with the indicated Abs. β‐actin was used as loading control.
Viability assay performed in NALM‐6 and LAL‐B cells interfered for Che‐1 expression and treated for 48 h with adriamycin (2 μM) at the same time. Error bars represent the standard error of three different experiments.
TCEs from NALM‐6 and LAL‐B cells treated as in (E) were blotted and analyzed with the indicated Abs. β‐actin was used as loading control.
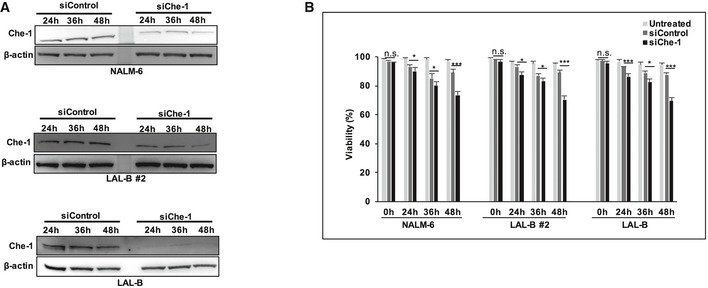
WB analysis of Che‐1 silencing performed 24, 36, and 48 h postnucleoporation in NALM‐6, LAL‐B, and LAL‐B #2 cell lines.
Viability assay performed in NALM‐6, LAL‐B, and LAL‐B #2 cell lines treated as in (A). Data are presented as the means and standard deviation (SD) from three independent experiments. *P ≤ 0.05; ***P ≤ 0.001 by Student's t‐test.
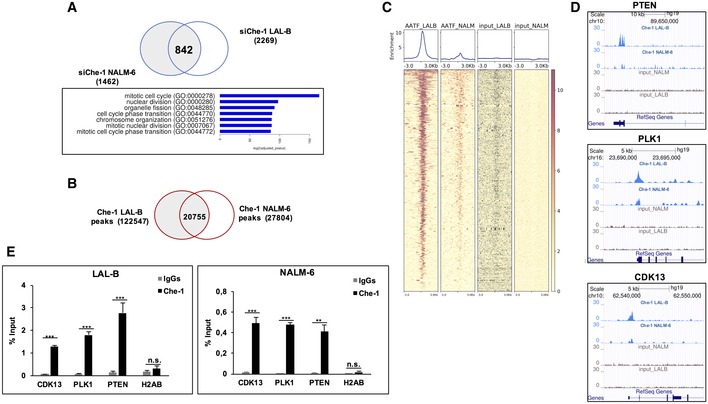
Intersection of spike‐in‐normalized differential expressed genes in LAL‐B and NALM‐6 cell lines. The 842 genes downregulated in both cell lines show a strong enrichment in several functional clusters.
Venn diagram of Che‐1 peak sets in LAL‐B and NALM‐6 cell lines computed by bedtools intersect.
ChIP‐seq signal, centered on 2,205 TSS sites extracted from the 842 RNA‐seq downregulated signature. The Deeptools Heatmap plot shows an enrichment of Che‐1 position with respect to both inputs.
Genome Browser Screenshots of ChIP‐seq bigWig signal on cell‐cycle‐related genes promoters.
Quantitative ChIP analysis (ChIP–qPCR) of Che‐1 enrichment on CDK13, PLK1, and PTEN promoters in NALM‐6 and LAL‐B cells. H2AB (Histone Cluster 2 H2A Family Member B) was used as negative control. Data are expressed as percent of input. Error bars represent the standard error of three different experiments. **P ≤ 0.01; ***P ≤ 0.001 by Student's t‐test.
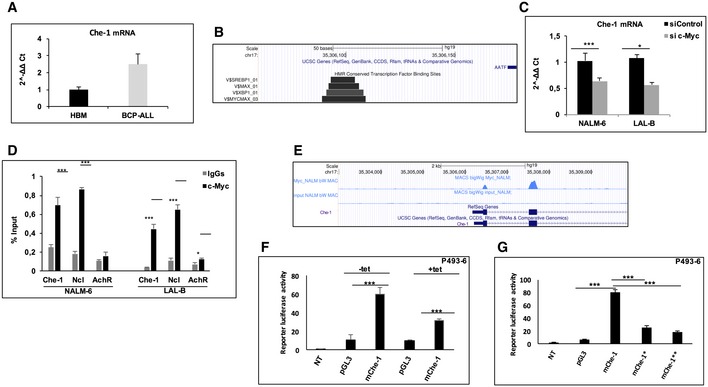
Che‐1 mRNA levels were analyzed by quantitative RT–PCR (qRT–PCR) in eight bone marrows samples collected at diagnosis from BCP‐ALL patients and were compared with five HBMs samples. Values were normalized with actin mRNA levels using the ∆∆C t method.
Genome Browser Screenshot showing conserved transcription factor binding sites of Che‐1 promoter, computed from Transfac/Biobase.
Che‐1 mRNA levels were analyzed by qRT–PCR in NALM‐6 and LAL‐B cell lines interfered for c‐Myc expression by siRNA. Data are presented as the means and standard deviation (SD) from three independent experiments.
ChIP–qPCR analysis of c‐Myc enrichment on the Che‐1 promoter in LAL‐B and NALM‐6 cells. Ncl (nucleolin) and AchR (acetylcholine receptor) were used as positive and negative controls, respectively. Data are expressed as percent of input. Error bars represent the standard error of three different experiments.
c‐Myc binding to Che‐1 promoter in NALM‐6 cell line by ChIP‐seq assay.
P493‐6 cells were transfected with pGL3 basic vector, used as control, or with the plasmid containing the firefly luciferase reporter under the control of murine Che‐1 promoter (mChe‐1). Che‐1 promoter activity was analyzed in high c‐Myc (−tet) or low c‐Myc (+tet) conditions. Data are presented as the means ± SD from three independent experiments.
Luciferase assay performed upon two different mutations in the E‐box sequence on mChe‐1 promoter (mChe‐1*, mChe‐1**). Data are presented as the means ± standard deviation (SD) from three independent experiments.
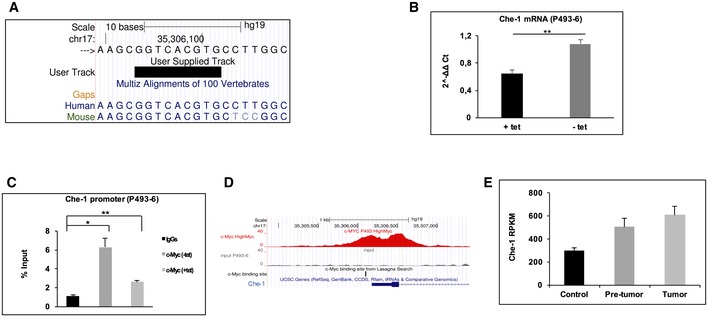
Genome Browser Screenshot of Che‐1 promoter, showing E‐box conservation among human and mouse.
qRT–PCR experiment performed in P493‐6 cell line untreated (−tet) or treated with 0.1 μg/ml tetracycline for 72 h (+tet). Values were normalized with actin mRNA levels using the ∆∆C t method. Error bars represent the standard error of three different experiments.
Cross‐linked chromatin derived from P493‐6 cells untreated or treated with 0.1 μg/ml tetracycline for 72 h was immunoprecipitated with c‐Myc antibody or in the absence of antibody and analyzed by qRT–PCR (ChIP–qPCR). Data are expressed as a percentage of input. Error bars represent the standard error of three different experiments.
c‐Myc binds Che‐1 promoter in P493‐6 cell line. Data from Amati's group deposited at GSE51011, UCSC Genome Browser Screenshot showing only portion of MACS2‐generated bigWig.
Che‐1 expression (RPKM) increasing along with tumorigenesis. RNA‐seq processed data from Sabo et al 20 Data are presented as the means and SD from three independent experiments (GSE51011).
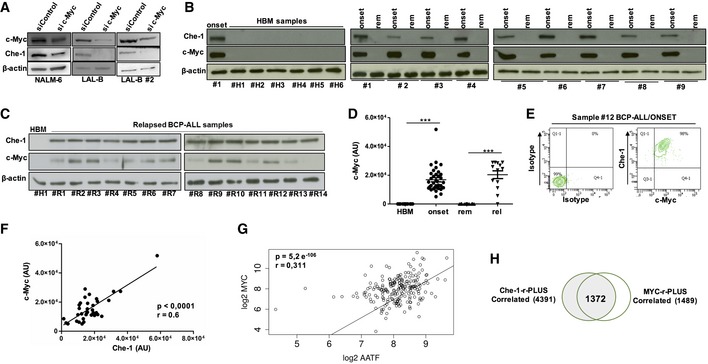
WB analysis of Che‐1 expression in c‐Myc‐interfered NALM‐6, LAL‐B, and LAL‐B#2 cell lines.
Evaluation of c‐Myc expression by WB in six representative samples of HBM and in nine BM samples of BCP‐ALL analyzed at time of diagnosis (onset) and at time of remission (rem). β‐actin was used as loading control. #1 BCP‐ALL sample was used as positive control.
WB analysis for c‐Myc expression in BMs from relapsing patients (#R1–#R14). β‐actin was used as loading control. #H1 sample was used as negative control.
c‐Myc distribution in HBM samples (15), BCP‐ALL samples collected at diagnosis (35), at remission (28), and at time of relapse (13). ***P ≤ 0.001 by Mann‐Whitney U‐test.
FACS analysis of c‐Myc and Che‐1 co‐expression in a BCP‐ALL sample collected at diagnosis (#12).
Che‐1/c‐Myc correlation in 35 BCP‐ALL samples analyzed.
Scatter plot of Che‐1 and c‐Myc expression levels in Murphy's 207 BCP‐ALL patient's dataset. The two transcripts show a significant (P‐value = 5.2e‐06) positive (R: 0.31) correlation.
Venn diagram for the Che‐1‐r‐Plus and c‐Myc‐r‐Plus sets.
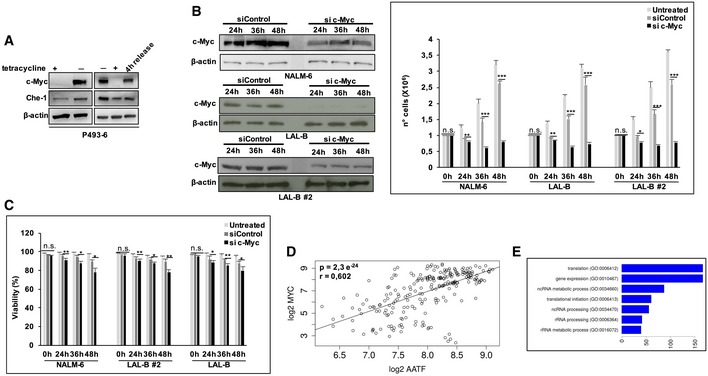
WB analysis of P493‐6 cells untreated (−tet), treated with tetracycline for 72 h (+tet) and 4 h after release. β‐actin was used as loading control.
WB and proliferation assay of c‐Myc silencing performed 24, 36, and 48 h postnucleoporation in NALM‐6, LAL‐B, and LAL‐B #2 cell lines. Data are presented as the means and standard deviation (SD) from three independent experiments.
Viability assay performed in NALM‐6, LAL‐B, and LAL‐B #2 cell lines treated as in (B). Data are presented as the means and standard deviation (SD) from three independent experiments.
Che‐1/c‐Myc transcript correlation in the “Exp B Cells” dataset comprising of several hematological samples.
Gene Ontology enrichment for the 1,372 gene Che‐1/c‐Myc‐r‐PLUS overlap showed in Fig 5H.
- A
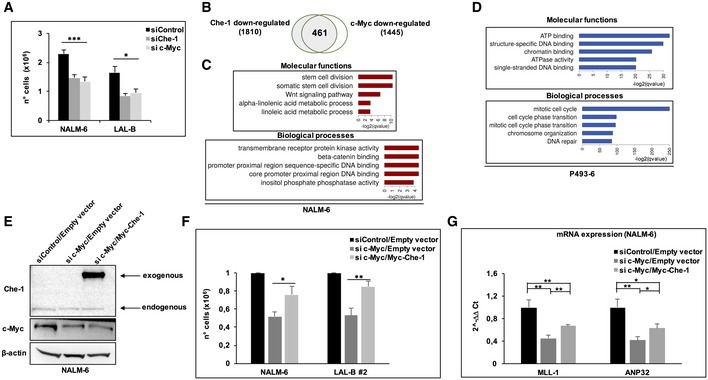
Cell number analysis performed 36 h postnucleoporation of NALM‐6 and LAL‐B cells nucleoporated with siRNA targeting Che‐1 (siChe‐1), c‐Myc (si c‐Myc), or with control siRNA (siControl). Error bars represent the standard error of three different experiments.
- B
Venn diagram for Cuffdiff differentially expressed genes (q‐value < 0.1) in both siChe‐1 and si c‐Myc conditions, in NALM‐6 cells.
- C, D
Biological processes and molecular functions enrichment for downregulated signatures in siChe‐1 and si c‐Myc, or +/− tetracycline, in NALM‐6 and P493‐6 cell lines, respectively. Clusters computed via Enrichr API.
- E
NALM‐6 cells were nucleoporated with Control siRNA (siControl) in combination with a Myc‐tagged empty vector (Empty vector) or with siRNA c‐Myc (si c‐Myc) in combination with empty vector, or with si c‐Myc and Myc‐tagged Che‐1 expressing vector (Myc‐Che‐1), and harvested after 36 h. WB analysis of TCEs with the indicated Abs is shown. It is representative of three independent experiments.
- F
Cell number analysis performed in NALM‐6 and LAL‐B2 cells treated as in (E). Data are presented as means ± SD from three independent experiments.
- G
Quantitative RT–PCR (qRT–PCR) for the indicated genes was performed in NALM‐6 cells nucleoporated as in (E). Values were normalized to actin expression. Error bars represent the standard error of three different experiments.
- A
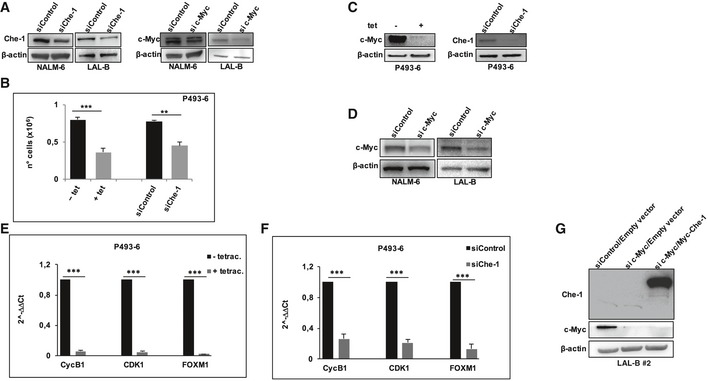
WB analysis of NALM‐6 and LAL‐B cell lines nucleoporated with siRNA targeting Che‐1 (siChe‐1), c‐Myc (si c‐Myc), or with control siRNA (siControl), and subjected to cell number analysis (Fig 6A). β‐actin was used as loading control.
- B
Cell number analysis performed on P493‐6 cells transiently transfected either with siRNA targeting Che‐1 (siChe‐1) or with control siRNA (siControl), and untreated or treated with tetracycline for 72 h. Data are presented as the means ± SD from three independent experiments.
- C
WB analysis of P493‐6 cells treated as in (B).
- D
WB analysis of NALM‐6 and LAL‐B cell lines treated as in (A), and subjected to RNA‐seq experiment (Fig 6B).
- E, F
qRT–PCR analysis performed in P493‐6 cells treated as in (B), to validate the downregulation of some genes (Cyclin B1, Cdk1, Foxm1) emerged from the RNA‐seq experiment. Error bars represent the standard error of three different experiments.
- G
LAL‐B #2 cells were nucleoporated with Control siRNA (siControl) in combination with a Myc‐tagged empty vector (Empty vector) or with siRNA c‐Myc (si c‐Myc) in combination with empty vector, or with si c‐Myc and Myc‐tagged Che‐1 expressing vector (Myc‐Che‐1), and harvested after 36 h. WB analysis of TCEs with the indicated Abs is shown. It is representative of three independent experiments.
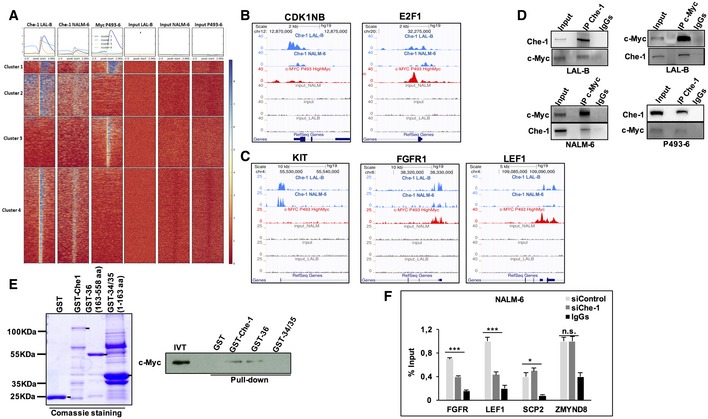
Deeptools‐generated co‐localization heatmap for a merged peak set (Che‐1 union c‐Myc), showing bigWig enrichment for Che‐1_LALB, Che‐1_NALM, c‐Myc_P493‐6 PLUS input tracks. K‐means clustering (K = 4) has been applied. Cluster 1 (blue) comprises of broad peaks present in all three libraries. Cluster 2 (azure) contains mostly Che‐1‐specific broad domains. Cluster 3 (green) is associated with Myc‐specific narrow peaks. Cluster 4 (orange), again, contains Che‐1‐specific domains, but way narrower when compared to cluster 2.
ChIP‐seq data for Che‐1 and c‐Myc on CDK1NB and the transcription factor E2F1 shown here, extracted from panel (A), cluster 1. Both the proteins bind the TSS area of the genes with different intensities.
ChIP‐seq data from co‐downregulated genes in siChe‐1‐sic‐Myc present in stem cell division cluster of Fig 6D.
Co‐immunoprecipitation experiments with anti‐c‐Myc or anti‐Che‐1 antibodies resolved with reciprocal antibodies, in NALM‐6, P493‐6, and LAL‐B cells.
GST pull‐down assay performed between GST‐Che‐1, GST‐Che‐1‐deleted fusion proteins (GST‐36, GST‐34‐35), and in vitro translated (IVT) c‐Myc protein. GST sample was used as negative control. GST fusion protein expression is shown by Comassie blue staining.
ChIP‐seq assay with c‐Myc antibody in Che‐1‐interfered NALM‐6 cell line, resolved by qRT–PCR with FGFR1, LEF1, SCP2, and ZMYND8 primers. Data are presented as the means and standard deviation (SD) from three independent experiments. *P ≤ 0.05; ***P ≤ 0.001 by Student's t‐test.
References
-
- Locatelli F, Schrappe M, Bernardo ME, Rutella S (2012) How I treat relapsed childhood acute lymphoblastic leukemia. Blood 120: 2807–2816 - PubMed
-
- Uderzo C, Conter V, Dini G, Locatelli F, Miniero R, Tamaro P (2001) Treatment of childhood acute lymphoblastic leukemia after the first relapse: curative strategies. Haematologica 86: 1–7 - PubMed
-
- Zhou Y, Kanagal‐Shamanna R, Zuo Z, Tang G, Medeiros LJ, Bueso‐Ramos CE (2016) Advances in B‐lymphoblastic leukemia: cytogenetic and genomic lesions. Ann Diagn Pathol 23: 43–50 - PubMed
Publication types
MeSH terms
Substances
LinkOut - more resources
Full Text Sources
Other Literature Sources
Molecular Biology Databases
Research Materials
Miscellaneous
