. 2018 Feb;30(2):429-446.
doi: 10.1105/tpc.17.00759. Epub 2018 Jan 24.

Interregulation of CDKA/CDK1 and the Plant-Specific Cyclin-Dependent Kinase CDKB in Control of the Chlamydomonas Cell Cycle

Affiliations

Interregulation of CDKA/CDK1 and the Plant-Specific Cyclin-Dependent Kinase CDKB in Control of the Chlamydomonas Cell Cycle

Kenneth C Atkins et al. Plant Cell. 2018 Feb.

Abstract

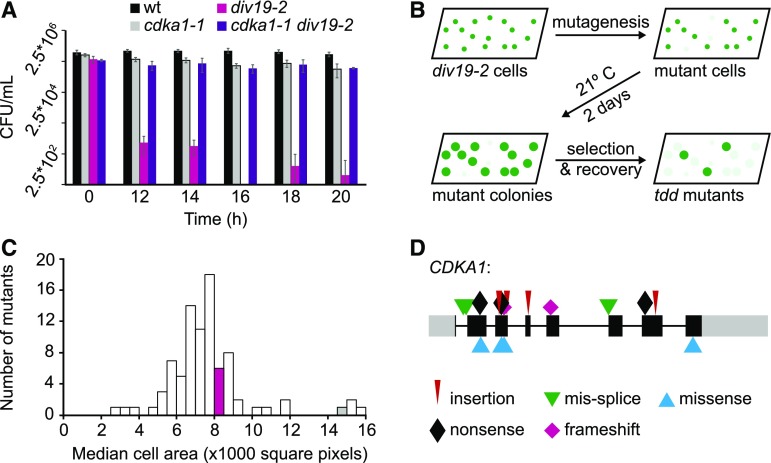
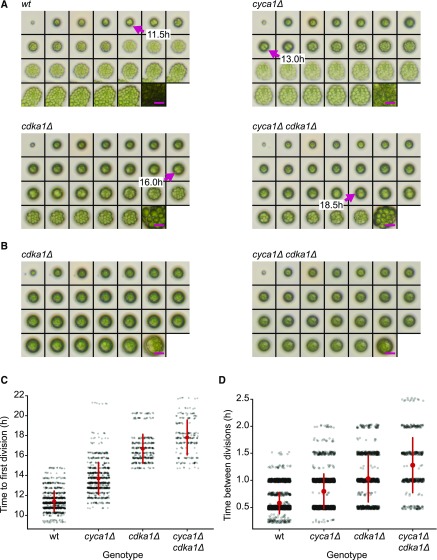
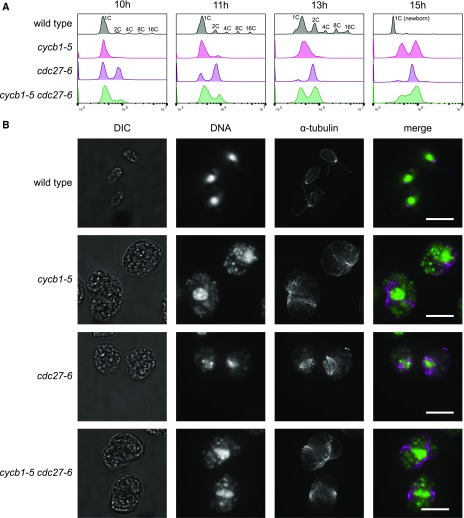
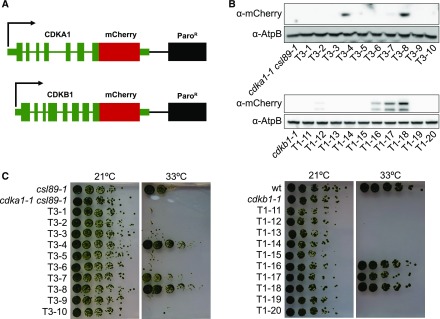
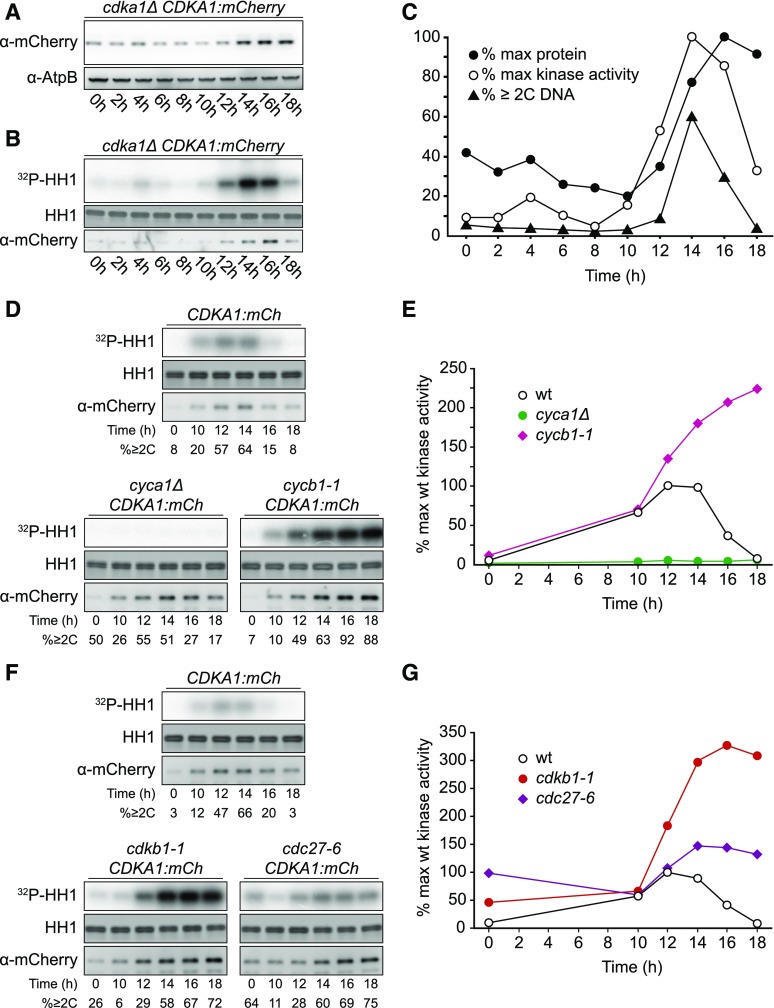
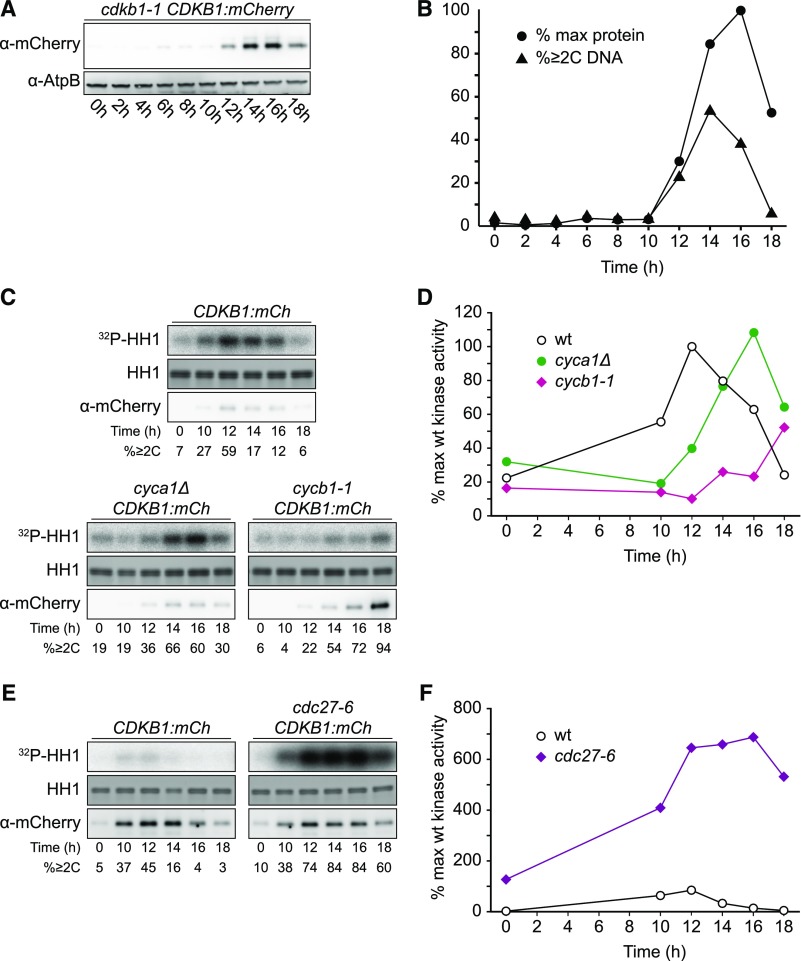
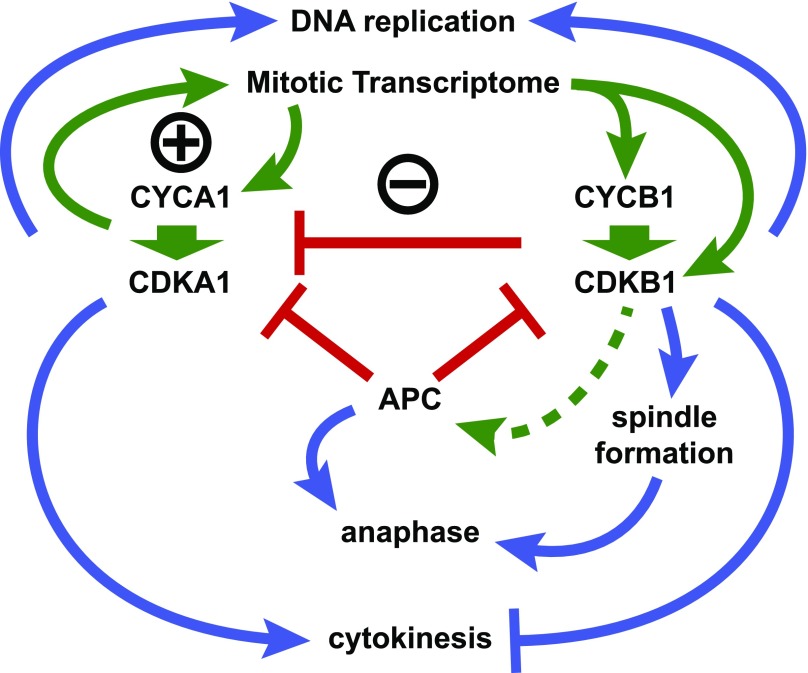
The cyclin-dependent kinase CDK1 is essential for mitosis in fungi and animals. Plant genomes contain the CDK1 ortholog CDKA and a plant kingdom-specific relative, CDKB. The green alga Chlamydomonas reinhardtii has a long G1 growth period followed by rapid cycles of DNA replication and cell division. We show that null alleles of CDKA extend the growth period prior to the first division cycle and modestly extend the subsequent division cycles, but do not prevent cell division, indicating at most a minor role for the CDK1 ortholog in mitosis in Chlamydomonas. A null allele of cyclin A has a similar though less extreme phenotype. In contrast, both CDKB and cyclin B are essential for mitosis. CDK kinase activity measurements imply that the predominant in vivo complexes are probably cyclin A-CDKA and cyclin B-CDKB. We propose a negative feedback loop: CDKA activates cyclin B-CDKB. Cyclin B-CDKB in turn promotes mitotic entry and inactivates cyclin A-CDKA. Cyclin A-CDKA and cyclin B-CDKB may redundantly promote DNA replication. We show that the anaphase-promoting complex is required for inactivation of both CDKA and CDKB and is essential for anaphase. These results are consistent with findings in Arabidopsis thaliana and may delineate the core of plant kingdom cell cycle control that, compared with the well-studied yeast and animal systems, exhibits deep conservation in some respects and striking divergence in others.


Figures

Figure 1.
Figure 1.
Death Delay Screen and Mutant Characterization. (A) Viability of the wild type, cdka1-1, div19-2, and cdka1-1 div19-2 after exposure to 33°C. Error bars represent the sd of four technical replicates. (B) Schematic of the death delay screen. (C) Distribution of median cell area for a representative set of tdd mutants after 20 h at 33°C. The magenta and gray bars indicate the cell area of the div19-2 and cdka1-1 div19-2 mutants, respectively. (D) Mutations in CDKA1 in large-cell arresting tdd mutants (>12,000 square pixels). Colored symbols show the type of mutation. Gray boxes, 5′ and 3′ untranslated regions; black boxes, exons; gray lines, introns.
Figure 2.
Figure 2.
Delay of Cell Division in cdka1Δ and cyca1Δ Mutants. (A) and (B) Montages of time-lapse microscopy. Time points: 0-h, 10- to 22-h at 0.5-h intervals, and 35 h. Magenta arrows in (A) show the first divisions. Magenta bars = 25 μm. Hatching from the mother cell wall (see wild type 14.5-h and 15.0-h images) allows cells to spread, taking up more area in the image. Some cdka1Δ and cyca1Δ cdka1Δ cells grow very large (B), but fail to divide even after 35 h (Supplemental Table 2). Bars = 25 μm. (C) Time to first division in wild-type, cyca1Δ, cdka1Δ, and cyca1Δ cdka1Δ cells. At time zero, saturated TAP cultures were spotted on a plate and transferred to 33°C. Each data point represents a single quantified division time. Red circle and bars indicate mean and sd. Differences between all groups are significant (Mann-Whitney U test, P < 0.001). Pooled results from two segregants of each genotype. (D) Time between divisions following the first division in the wild type, cyca1Δ, cdka1Δ, and cyca1Δ cdka1Δ. Differences between all groups are significant (Mann-Whitney U test, P < 0.001). Red circle and bars indicate mean and sd.
Figure 3.
Figure 3.
Dependence of DNA Replication and Spindle Formation on CYCB1 and the APC. (A) and (B) Cells were blocked by nitrogen deprivation and released at 33°C. (A) DNA content analyzed by flow cytometry. Wild-type cells undergo multiple rounds of DNA synthesis and mitosis within the mother cell wall, producing cell clusters with 2, 4, 8, or 16C DNA content, before hatching to produce small 1C newborn cells. The apparent DNA content of these cells compared with predivision 1C cells is shifted to the left (Tulin and Cross, 2014). (B) From a separate experiment, cells at 13.5 h after release were processed for anti-α-tubulin immunofluorescence and DNA localization by SYTOX staining. DIC, differential interference contrast image. Bars = 10 μm. Quantification is shown in Supplemental Table 3.
Figure 4.
Figure 4.
Generation of Functional mCherry-Tagged CDKA1 and CDKB1. (A) DNA used for transformation. The native sequences, including promoter, terminator, and introns were used for both CDKA1 and CDKB1. The sequence encoding the mCherry tag was added at the 5′ end of the coding sequence following a 3x GGGGS linker sequence. Paromomycin was used to select for transformants. (B) Immunoblot showing expression of the tagged CDK transgenes in random transformants. AtpB was used as a loading control. (C) Complementation of temperature sensitivity of cdka1-1 csl89-1 and cdkb1-1 in the transformants from (B).
Figure 5.
Figure 5.
Regulation of CDKA1 Abundance and Kinase Activity. Strains of the indicated genotypes were synchronized by nitrogen deprivation and released at 33°C. The contrast was adjusted such that images can be compared within but not between subfigures. (A) Immunoblot detection of CDKA1-mCherry. (B) Kinase activity of immunoprecipitated CDKA1-mCherry on a histone H1 substrate. Note: Background kinase activity in immunoprecipitates from untagged cells was low and varied little through the cell cycle (data not shown). (C) Quantification of (A) and (B) and the fraction of cells/cell clusters with ≥2C DNA content as determined by flow cytometry. (D) and (E) Cyclin dependence of CDKA1-associated kinase activity. See also Supplemental Figure 7A. (F) and (G) CDKB1 and APC negatively regulate CDKA1-associated kinase activity.
Figure 6.
Figure 6.
CDKA1 Is Localized to the Nucleus and the Base of Flagella. Confocal micrographs from a population of live, cycling cdka1ΔCDKA1:mCherry cells. Contrast was adjusted separately for each image, so intensities should not be compared across images. Cytoplasmic background fluorescence in the mCherry channel was also observed in cells lacking the transgene (data not shown). (A) CDKA1 localization in newborn cells. CDKA1 was found in nuclei (magenta arrows) and in small puncta at the apical end of the cell body (white arrows), possibly at the base of the flagella. Images are average intensity z-projections. Bar =10 μm. (B) In dividing cells, CDKA1 was primarily found in small puncta. Bar = 5 μm. Images are average intensity z-projections. (C) CDKA1 puncta in dividing cells were adjacent to nuclei. Images are rotations from a brightest point 3D projection of the cell cluster in (B). Bar = 5 μm.
Figure 7.
Figure 7.
Regulation of CDKB1 Abundance and Associated Kinase Activity Strains of the indicated genotypes were synchronized by nitrogen deprivation and released at 33°C. Contrast was adjusted such that images can be compared within but not between subfigures. (A) Immunoblot detection of CDKB1-mCherry. (B) Quantification of (A) and fraction of cells with ≥2C DNA content as determined by flow cytometry. (C) and (D) Cyclin dependence of CDKB1-associated kinase activity. See also Supplemental Figure 7B. (E) and (F) APC negatively regulates CDKB1-associated kinase activity. Note: Background kinase activity in immunoprecipitates from untagged cells was low and varied little through the cell cycle (data not shown).
Figure 8.
Figure 8.
CDKB1 Is a Nuclear Protein during Division Cycles. Confocal micrographs from a population of live cells expressing CDKB1:mCherry and ble-GFP as a nuclear marker (Y. Li et al., 2016). All images are average intensity z-projections. Contrast was adjusted separately for each trans and nuclear (GFP) image for clarity. CDKB1 images are contrast adjusted to the maximum of the group, so intensities can be compared. The non-nuclear signal in the mCherry channel was observed at similar levels in control strains lacking the transgene (data not shown). (A) Newborn cell with no detectable CDKB1. (B) to (E) The 1-, 2-, 4-, and 8-cell clusters, respectively, with CDKB1 in all nuclei. Bars = 10 μm. (F) The 16-cell cluster of postmitotic newborn cells (just before hatching) lack CDKB1. (G) Nuclear concentration of CDKB1 as a function of number of cells per cluster (see Supplemental Methods). Bar = 10 μm.
Figure 9.
Figure 9.
Proposed Model for Chlamydomonas Cell Cycle Regulation by CYCA1-CDKA1 and CYCB1-CDKB1. We hypothesize that the main in vivo cyclin-CDK complexes are CYCA1-CDKA1 and CYCB1-CDKB1. The APC negatively regulates CYCA1-CDKA1 and CYCB1-CDKB1; CYCB1-CDKB1 also negatively regulates CYCA1-CDKA1 (red bars). We propose CYCA1 and CYCB1 as predominant, specific in vivo activators of CDKA1 and CDKB1, respectively (heavy green arrows). CDKA1 activation of CYCA1 transcription represents a possible positive feedback loop (circled +); CDKA1 activation of CYCB1-CDKB1 with ensuing repression of CYCA1-CDKA1 by CYCB1-CDKB1 represents a possible negative feedback loop (circled −). Blue arrows, promotion of cell division cycle events; blue bars, inhibition of cell division cycle events; green arrows, activation of control circuitry; red bars, inhibition of control circuitry; dashed green line, possible activation of APC by CYCB1-CDKB1.

Comment in

Similar articles

Cited by

References

    1. Bisova K., Krylov D.M., Umen J.G. (2005). Genome-wide annotation and expression profiling of cell cycle regulatory genes in Chlamydomonas reinhardtii. Plant Physiol. 137: 475–491. - PMC - PubMed
    1. Bloom J., Cross F.R. (2007). Multiple levels of cyclin specificity in cell-cycle control. Nat. Rev. Mol. Cell Biol. 8: 149–160. - PubMed
    1. Boudolf V., et al. (2009). CDKB1;1 forms a functional complex with CYCA2;3 to suppress endocycle onset. Plant Physiol. 150: 1482–1493. - PMC - PubMed
    1. Boudolf V., Vlieghe K., Beemster G.T.S., Magyar Z., Torres Acosta J.A., Maes S., Van Der Schueren E., Inzé D., De Veylder L. (2004). The plant-specific cyclin-dependent kinase CDKB1;1 and transcription factor E2Fa-DPa control the balance of mitotically dividing and endoreduplicating cells in Arabidopsis. Plant Cell 16: 2683–2692. - PMC - PubMed
    1. Breker M., Lieberman K., Tulin F., Cross F.R. (2016). High-throughput robotically assisted isolation of temperature-sensitive lethal mutants in Chlamydomonas reinhardtii. J. Vis. Exp. 118: e54831. - PMC - PubMed

Publication types

MeSH terms

LinkOut - more resources