. 2018 Mar 9;293(10):3839-3848.
doi: 10.1074/jbc.RA117.001042. Epub 2018 Jan 24.

An essential thioredoxin is involved in the control of the cell cycle in the bacterium Caulobacter crescentus

Affiliations

An essential thioredoxin is involved in the control of the cell cycle in the bacterium Caulobacter crescentus

Camille V Goemans et al. J Biol Chem. .

Abstract

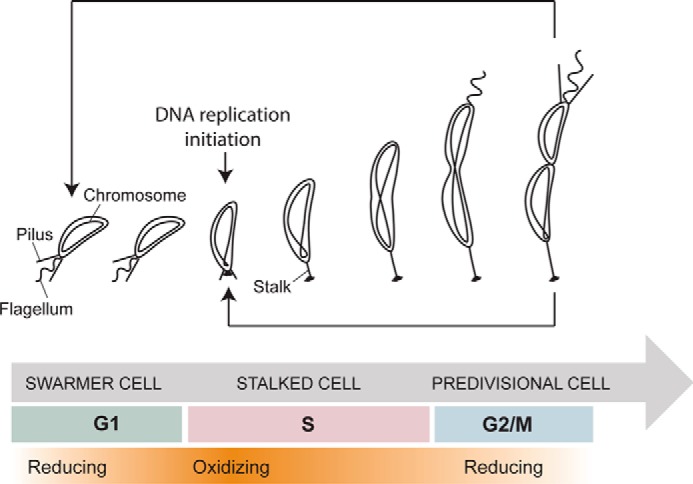
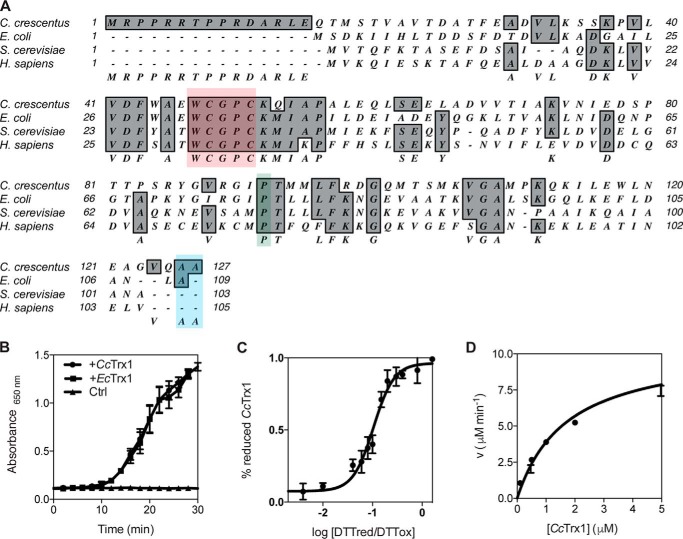
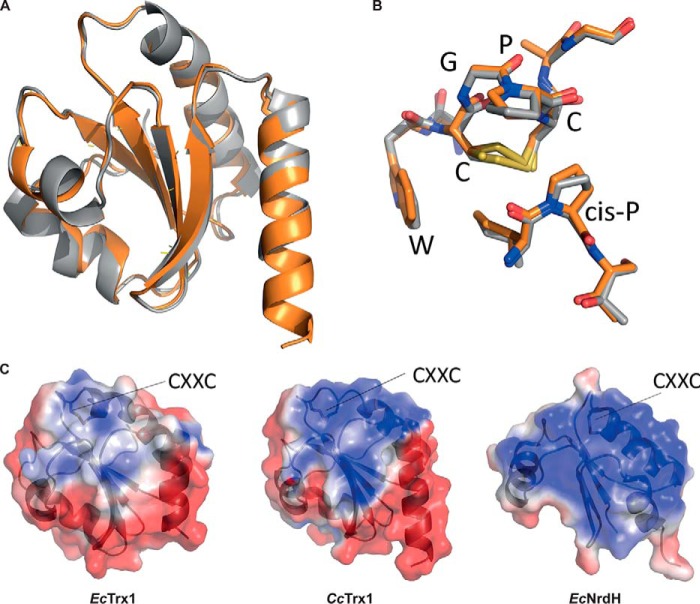
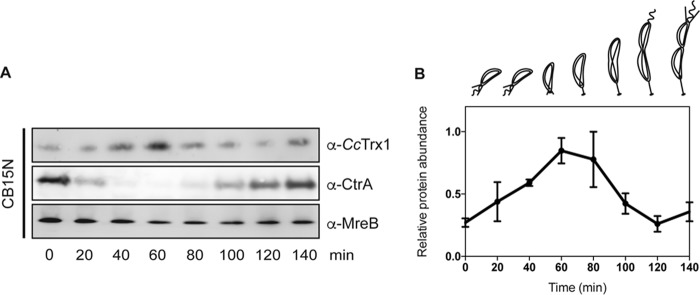
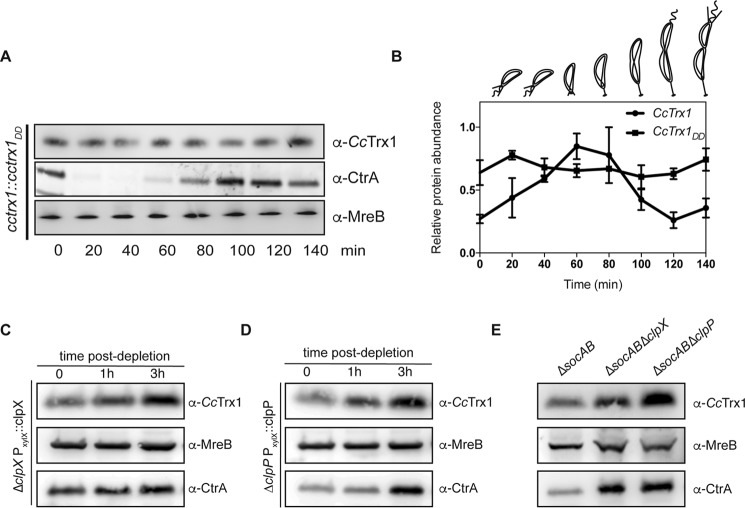
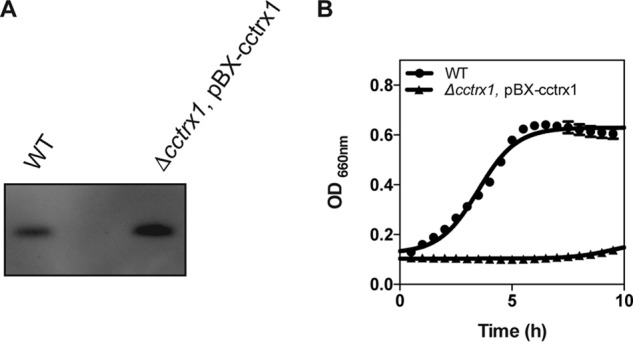
Thioredoxins (Trxs) are antioxidant proteins that are conserved among all species. These proteins have been extensively studied and perform reducing reactions on a broad range of substrates. Here, we identified Caulobacter crescentus Trx1 (CCNA_03653; CcTrx1) as an oxidoreductase that is involved in the cell cycle progression of this model bacterium and is required to sustain life. Intriguingly, the abundance of CcTrx1 varies throughout the C. crescentus cell cycle: although the expression of CcTrx1 is induced in stalked cells, right before DNA replication initiation, CcTrx1 is actively degraded by the ClpXP protease in predivisional cells. Importantly, we demonstrated that regulation of the abundance of CcTrx1 is crucial for cell growth and survival as modulating CcTrx1 levels leads to cell death. Finally, we also report a comprehensive biochemical and structural characterization of this unique and essential Trx. The requirement to precisely control the abundance of CcTrx1 for cell survival underlines the importance of redox control for optimal cell cycle progression in C. crescentus.

Keywords: Caulobacter crescentus; antioxidant; bacteria; crystal structure; oxidation-reduction (redox); redox regulation; thioredoxin.


Conflict of interest statement

The authors declare that they have no conflicts of interest with the contents of this article

Figures

Figure 1.
Figure 1.
Schematic representation of the cell cycle of C. crescentus. The swarmer cell (in G1 phase) differentiates into a stalked cell, which then initiates DNA replication (S phase). This leads to the formation of predivisional cells and division (G2/M phase). The redox state of the cell fluctuates with more reducing (white) or oxidizing phases (orange) during the cycle.
Figure 2.
Figure 2.
CcTrx1 exhibits the biochemical properties of a classical Trx. A, alignment of CcTrx1 with well studied Trxs from E. coli (NP_418228.2), S. cerevisiae (P22217), and H. sapiens (P10599.3) using MacVector 12.0.1. The catalytic WCGPC motif is highlighted in red, the cis-proline is in green, and the two C-terminal alanines are in blue. B, CcTrx1 catalyzes the reduction of insulin by DTT as measured by following the increase in absorbance at 650 nm. EcTrx1 was used as a positive control, and a sample without any Trx (Ctrl) was used as a negative control. This graph shows the mean of three independent experiments, and the error bars represent the S.E. C, the redox potential of CcTrx1 is −275 mV. It was determined by equilibrating the protein in redox buffers containing different DTTred/DTTox ratios. The redox potential was calculated from the ratio between the amounts of oxidized and reduced CcTrx1 present at equilibrium and determined using AMS trapping experiments. The data shown are the mean ± S.E. of three independent experiments. D, the Km of CcTrxR for CcTrx1 is 1.71 μm. The reduction of CcTrx1 by CcTrxR was monitored by measuring the decrease in absorbance at 340 nm, corresponding to the decrease in reduced NADPH (the experimental conditions are described under “Experimental procedures”). We measured the initial velocities (v) of CcTrx1 reduction by CcTrxR to determine the kinetic parameters of the reaction. This plot shows the mean ± S.E. of three independent experiments and a fit of the data to the Michaelis-Menten equation.
Figure 3.
Figure 3.
CcTrx1 has a Trx fold with a positive surface potential in the substrate contact area. A, overlay of CcTrx1 (Protein Data Bank code 6ESX; orange) with EcTrx1 (Protein Data Bank code 2TRX; gray) shows a structurally conserved Trx fold. B, overlay of the active-site sequence motif of CcTrx1 and EcTrx1. C, electrostatic surface potentials (from −2 (red) to +2kT/e (blue)) mapped to the surface of EcTrx1 (Protein Data Bank code 2TRX), CcTrx1 (Protein Data Bank code 6ESX), and EcNrdH (Protein Data Bank code 1H75). Figure panels were prepared with open-source PyMOL 1.8.x (A and B) and using Adaptive Poisson-Boltzmann Solver (APBS) tools after PDB2PQR file conversion (C).
Figure 4.
Figure 4.
CcTrx1 is cell cycle–regulated. A, a WT cell (CB15N) culture was synchronized, and samples were withdrawn every 20 min. Immunoblotting detection shows the levels of CcTrx1 over the cell cycle. MreB is used as a loading control, and CtrA serves as a synchrony control. This experiment was performed in triplicate, and this panel shows representative results. The additional experiments are presented in Fig. S3. B, quantification of the levels of CcTrx1. Bands were detected by immunoblotting and quantified using ImageJ. This graph shows the mean of three independent experiments. Error bars represent S.E.
Figure 5.
Figure 5.
CcTrx1 is degraded by the ClpXP machinery. A, in the cctrx1::cctrx1DD strain, the levels of CcTrx1 do not fluctuate over the cell cycle. A culture was synchronized, and samples were withdrawn every 20 min. Immunoblotting detection shows the levels of CcTrx1 over the cell cycle. MreB is used as a loading control, and CtrA serves as a synchrony control. This experiment was performed in triplicate, and this panel shows representative results. The additional experiments are present in Fig. S3. B, quantification of the levels of CcTrx1. Bands were detected by immunoblotting and quantified using ImageJ. This graph shows the mean of three independent experiments. Error bars represent S.E. C, CcTrx1 accumulates in a ClpX depletion strain. ΔclpX xylX::Pxyl-clpX cells were grown under permissive conditions before xylose was washed out to start the ClpX depletion. Samples were withdrawn after 1, 2, and 3 h. CcTrx1 was detected by immunoblotting. MreB serves as a loading control, and CtrA is a known substrate of ClpXP. This experiment was performed in triplicate, and this panel shows representative results. D, CcTrx1 accumulates in a ClpP depletion strain. ΔclpP xylX::Pxyl-clpP cells were grown under permissive conditions before xylose was washed out to start the ClpP depletion. Samples were withdrawn after 1, 2, and 3 h. CcTrx1 was detected by immunoblotting. MreB serves as a loading control, and CtrA is a known substrate of ClpXP. This experiment was performed in triplicate, and this panel shows representative results. E, CcTrx1 accumulates in the absence of ClpX or ClpP. The CB15N ΔsocAB, CB15N ΔsocAB ΔclpX, and CB15N ΔsocAB ΔclpP mutants were grown until A660 nm reached 0.3. CcTrx1 levels were assessed by immunoblotting. MreB serves as a loading control, and CtrA is a known substrate of ClpXP. This experiment was performed in triplicate, and this panel shows representative results.
Figure 6.
Figure 6.
Overexpression of CcTrx1. A, expression levels of CcTrx1 in a WT and an overexpression strain (Δcctrx1 pBX-cctrx1). This experiment was performed in triplicate, and this panel shows representative results. B, the growth curves of a WT and an overexpression strain (Δcctrx1 pBX-cctrx1) show that accumulation of CcTrx1 prevents cell growth. Cells were grown in M2G at 30 °C in a 96-well plate, and growth curves were monitored using a Biotek Synergy H1 Hybrid microplate reader. This graph shows the mean of three independent experiments. Error bars represent S.E.

References

    1. Collet J. F., and Messens J. (2010) Structure, function, and mechanism of thioredoxin proteins. Antioxid. Redox Signal. 13, 1205–1216 10.1089/ars.2010.3114 - DOI - PubMed
    1. Laurent T. C., Moore E. C., and Reichard P. (1964) Enzymatic synthesis of deoxyribonucleotides. IV. Isolation and characterization of thioredoxin, the hydrogen donor from Escherichia coli B. J. Biol. Chem. 239, 3436–3444 - PubMed
    1. Moore E. C., Reichard P., and Thelander L. (1964) Enzymatic synthesis of deoxyribonucleotides. V. Purification and properties of thioredoxin reductase from Escherichia coli B. J. Biol. Chem. 239, 3445–3452 - PubMed
    1. Arts I. S., Vertommen D., Baldin F., Laloux G., and Collet J. F. (2016) Comprehensively characterizing the thioredoxin interactome in vivo highlights the central role played by this ubiquitous oxidoreductase in redox control. Mol. Cell. Proteomics 15, 2125–2140 10.1074/mcp.M115.056440 - DOI - PMC - PubMed
    1. Christen B., Abeliuk E., Collier J. M., Kalogeraki V. S., Passarelli B., Coller J. A., Fero M. J., McAdams H. H., and Shapiro L. (2011) The essential genome of a bacterium. Mol. Syst. Biol. 7, 528 10.1038/msb.2011.58 - DOI - PMC - PubMed

Publication types

MeSH terms

LinkOut - more resources