Comparative Study
. 2018 Mar 9;293(10):3849-3859.
doi: 10.1074/jbc.RA117.000849. Epub 2018 Jan 24.

Systems analysis of the glycoside hydrolase family 18 enzymes from Cellvibrio japonicus characterizes essential chitin degradation functions

Affiliations
Comparative Study

Systems analysis of the glycoside hydrolase family 18 enzymes from Cellvibrio japonicus characterizes essential chitin degradation functions

Estela C Monge et al. J Biol Chem. .

Abstract

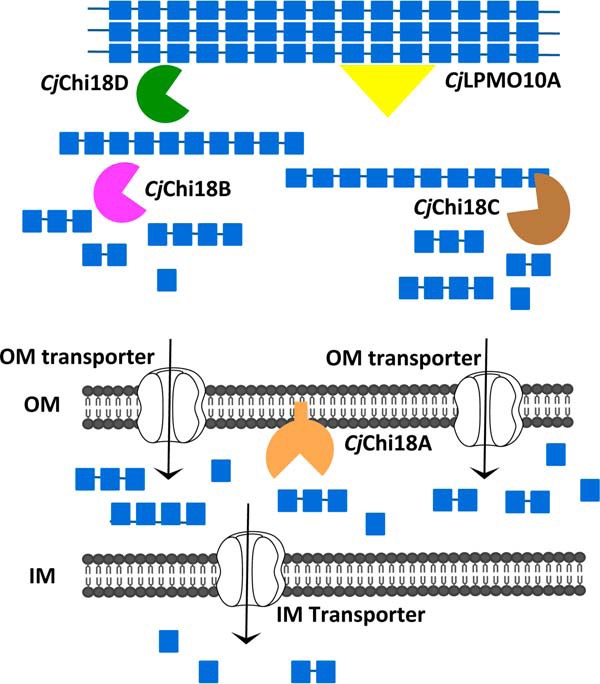
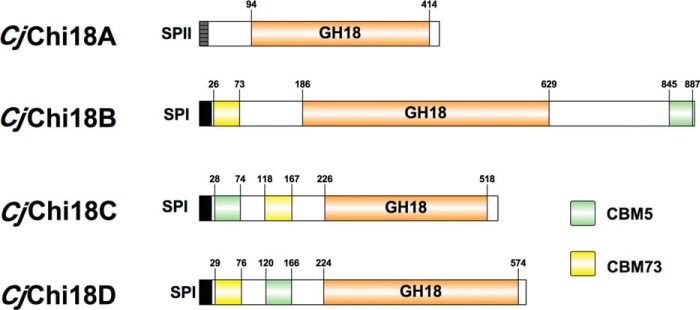
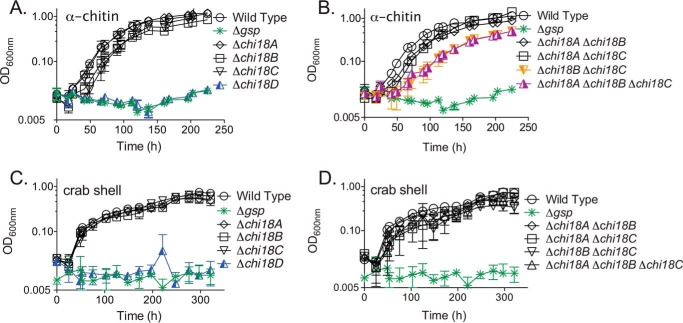
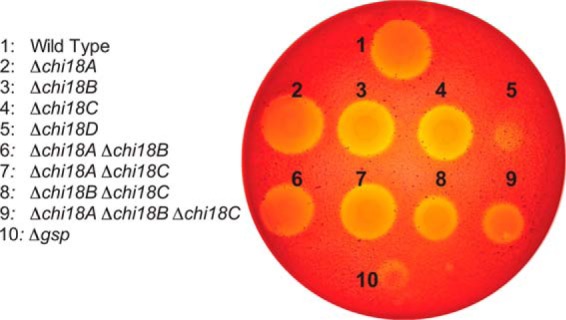
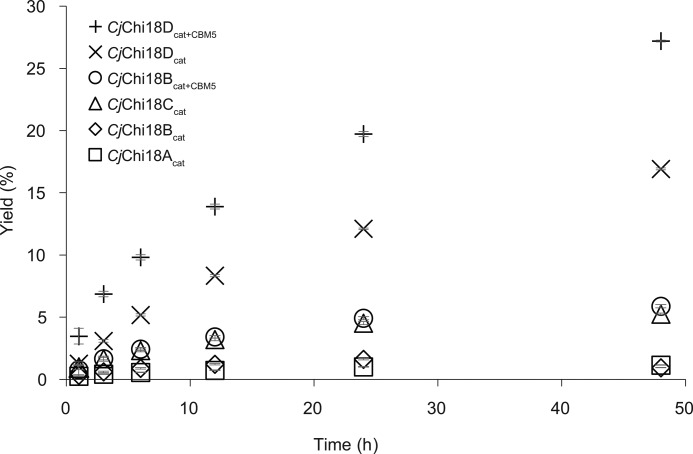
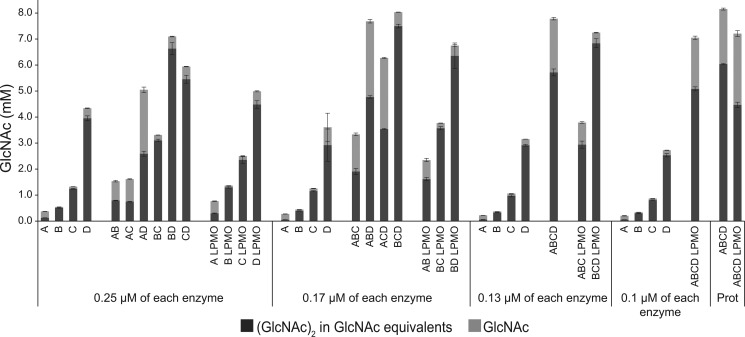
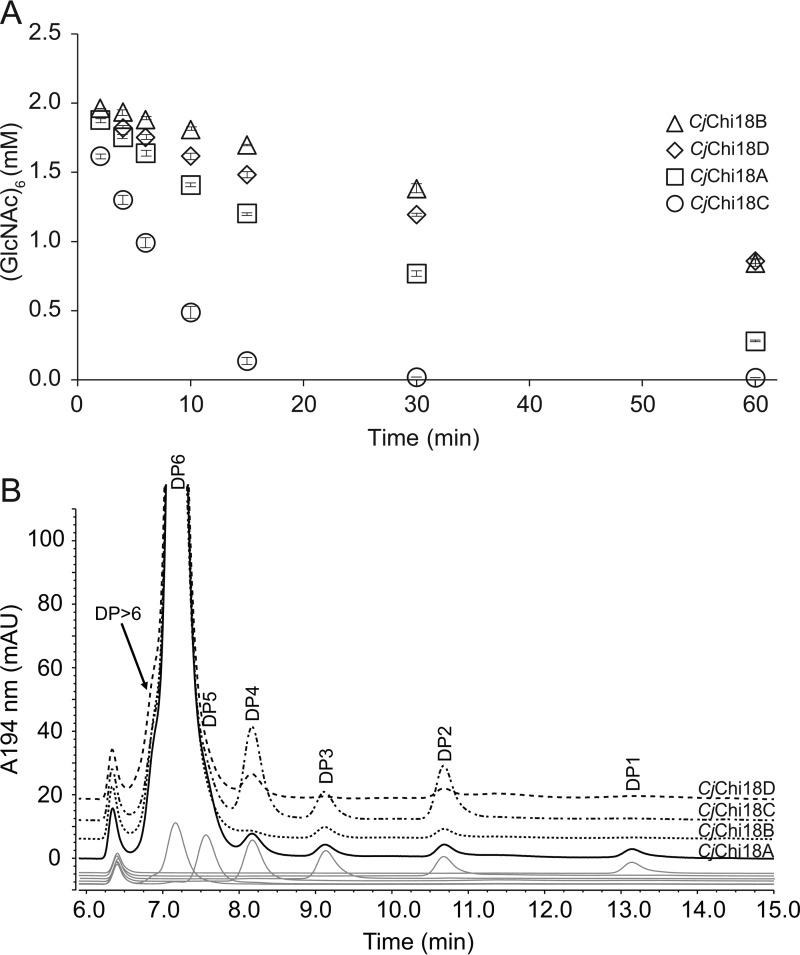
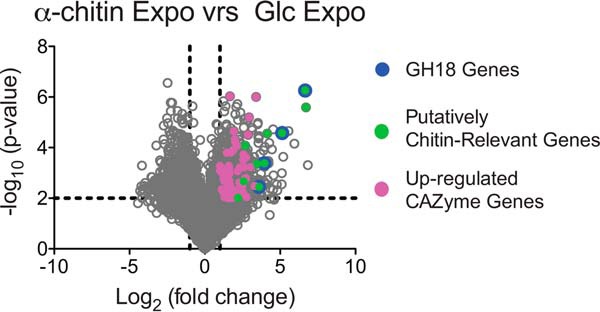
Understanding the strategies used by bacteria to degrade polysaccharides constitutes an invaluable tool for biotechnological applications. Bacteria are major mediators of polysaccharide degradation in nature; however, the complex mechanisms used to detect, degrade, and consume these substrates are not well-understood, especially for recalcitrant polysaccharides such as chitin. It has been previously shown that the model bacterial saprophyte Cellvibrio japonicus is able to catabolize chitin, but little is known about the enzymatic machinery underlying this capability. Previous analyses of the C. japonicus genome and proteome indicated the presence of four glycoside hydrolase family 18 (GH18) enzymes, and studies of the proteome indicated that all are involved in chitin utilization. Using a combination of in vitro and in vivo approaches, we have studied the roles of these four chitinases in chitin bioconversion. Genetic analyses showed that only the chi18D gene product is essential for the degradation of chitin substrates. Biochemical characterization of the four enzymes showed functional differences and synergistic effects during chitin degradation, indicating non-redundant roles in the cell. Transcriptomic studies revealed complex regulation of the chitin degradation machinery of C. japonicus and confirmed the importance of CjChi18D and CjLPMO10A, a previously characterized chitin-active enzyme. With this systems biology approach, we deciphered the physiological relevance of the glycoside hydrolase family 18 enzymes for chitin degradation in C. japonicus, and the combination of in vitro and in vivo approaches provided a comprehensive understanding of the initial stages of chitin degradation by this bacterium.

Keywords: Cellvibrio japonicus; bacterial genetics; bacterial metabolism; chitin; chitinase; glycoside hydrolase; polysaccharide.


Conflict of interest statement

The authors declare that they have no conflicts of interest with the contents of this article

Figures

Figure 1.
Figure 1.
Proposed model for chitin utilization in C. japonicus. CjChi18D (green) and CjLPMO10A (yellow) work together to disrupt the crystalline structure of chitin and degrade less accessible chitin fibers, whereas CjChi18B (magenta) and CjChi18C (brown) are acting on the more accessible chitin fibers to produce chito-oligosaccharides, which are taken up into the periplasm space. CjChi18A (orange) generates GlcNAc, and this lipoprotein may be acting in the periplasmic space (as shown here) or may be located on the outer side of the outer membrane and act outside the cell. IM, inner membrane; OM, outer membrane. Transporter icons (white) and phospholipids (gray) are adapted from Servier Medical Art under a Creative Commons Attribution 3.0 Unported License (https://creativecommons.org/licenses/by/3.0/).
Figure 2.
Figure 2.
Diverse architecture of the family GH18 chitinases of C. japonicus. CAZy domain representation of the family GH18 chitinases of C. japonicus is shown. The indicated domains are as follows: GH18, family GH18 catalytic domain; CBM5, chitin-binding domain; CBM73, chitin-binding domain; SPI, signal peptide, type I; SPII, signal peptide, type II. This image was generated using IBS Illustrator (65).
Figure 3.
Figure 3.
Growth of C. japonicus mutants on chitin. Deletion mutants were grown using MOPS minimal medium supplemented with 0.25% α-chitin (A and B) or 4% crab shell (C and D). A and C show single mutants; B and D show multiple mutants. All experiments were performed in biological triplicate; error bars represent standard deviations but in many cases are too small to be observed. These growth experiments were performed simultaneously but are separated into multiple panels for clarity. As a consequence, the same control strains (wildtype and Δgsp) are repeated in each panel for a given substrate.
Figure 4.
Figure 4.
Chitinase secretion of C. japonicus GH18 mutants. Strains were grown on a plate that contained MOPS with 1.5% agar, 2% colloidal chitin, and 0.2% glucose. After incubation at 30 °C for 5 days, the plates were stained with Congo red. This experiment was conducted in biological triplicate, and quantification of the clearing zones is shown in Table S2.
Figure 5.
Figure 5.
Degradation of α-chitin. Degradation of α-chitin (15 g/liter) at 30 °C was tested in 20 mm BisTris, pH 6.5, 0.1 mg/ml BSA. The enzyme concentration was 0.5 μm, and samples were taken at different time points. The yield refers to the degree of chitin solubilization. The α-chitin used contained 6.43% ash and 5.42% moisture, and this was taken into account when calculating yields. Each reaction was performed in triplicate; standard deviations are shown as error bars but are difficult to see because they are low and are partly covered by the symbols.
Figure 6.
Figure 6.
Synergy experiments. The catalytic domains of all chitinases and the CjLPMO10A were mixed in different ways to investigate possible synergistic effects in reactions with α-chitin (15 g/liter). The maximum total enzyme load was 0.5 μm with equal amounts of each enzyme, as indicated in the figure. In the reactions where the ratio was determined by protein quantification data from a previous proteomics study (Prot) (22), the total enzyme loading was also 0.5 μm. In the proteomics reaction without CjLPMO10A, the ratio was 21% CjChi18A, 4% CjChi18B, 22% CjChi18C, and 52% CjChi18D. In the proteomics reaction with CjLPMO10A, the ratio was 14% CjChi18A, 3% CjChi18B, 15% CjChi18C, 35% CjChi18D, and 33% CjLPMO10A. The CjLPMO10A was Cu2+-saturated before use. Reaction mixtures were incubated at 30 °C in 20 mm BisTris, pH 6.5, 0.1 mg/ml BSA, and samples were taken after 24 h. In reactions with CjLPMO10A, 0.5 mm ascorbate was added as an external electron donor. Production of GlcNAc and (GlcNAc)2 was quantified, and the amount of (GlcNAc)2 is given in GlcNAc equivalents. Three parallel reactions were done for each condition and standard deviations are shown as error bars. Reaction mixtures that contained the LPMO showed minor amounts of oxidized (GlcNAc)2, which were not quantified.
Figure 7.
Figure 7.
Hydrolysis of (GlcNAc)6. A, hydrolysis of (GlcNAc)6 over time. The slopes of the linear parts of these curves were used to calculate the initial rates. Standard deviations are shown as error bars. B, chromatograms showing the product profile obtained 2 min after mixing chitinases with substrate. DP1–DP6 represent (GlcNAc)1–6. Chromatograms for various standards are shown as gray lines at the bottom. These experiments were done with the catalytic domains of the chitinases. The reactions contained 2 mm (GlcNAc)6, 10 mm BisTris, pH 6.5, 0.1 mg/ml BSA, and 50 nm enzyme and were done in triplicate at 30 °C. Chromatograms for samples taken after 60 min are shown in Fig. S4.
Figure 8.
Figure 8.
Differential gene expression for C. japonicus during exponential growth. This volcano plot shows the log2(fold change) plotted against the −log10(p value) for every gene in C. japonicus during exponential growth on glucose compared with α-chitin, where each gray circle represents the expression of a single gene. The black dashed lines indicate the significance cutoff values: −log10(p value) > 2 and log2(fold change)> 1. The genes colored magenta represent CAZyme genes, and the complete list of these genes can be found in Table S3A.

References

    1. Gooday G. W., Humphreys A. M., and McIntosh W. H. (1986) Roles of chitinases in fungal growth. In Chitin in Nature and Technology (Muzzarelli R., Jeuniaux C., and Gooday G. W., eds.) pp. 83–91, Springer-Verlag, New York Inc., New York
    1. Beier S., and Bertilsson S. (2013) Bacterial chitin degradation-mechanisms and ecophysiological strategies. Front. Microbiol. 4, 149 - PMC - PubMed
    1. Khor E., and Lim L. Y. (2003) Implantable applications of chitin and chitosan. Biomaterials 24, 2339–2349 10.1016/S0142-9612(03)00026-7 - DOI - PubMed
    1. Francesko A., and Tzanov T. (2011) Chitin, chitosan and derivatives for wound healing and tissue engineering. Adv. Biochem. Eng. Biotechnol. 125, 1–27 - PubMed
    1. Matroodi S., Motallebi M., Zamani M., and Moradyar M. (2013) Designing a new chitinase with more chitin binding and antifungal activity. World J. Microbiol. Biotechnol. 29, 1517–1523 10.1007/s11274-013-1318-0 - DOI - PubMed

Publication types

MeSH terms