. 2018 Mar 5;215(3):941-961.
doi: 10.1084/jem.20161714. Epub 2018 Jan 24.

GPR56/ADGRG1 regulates development and maintenance of peripheral myelin

Affiliations

GPR56/ADGRG1 regulates development and maintenance of peripheral myelin

Sarah D Ackerman et al. J Exp Med. .

Abstract

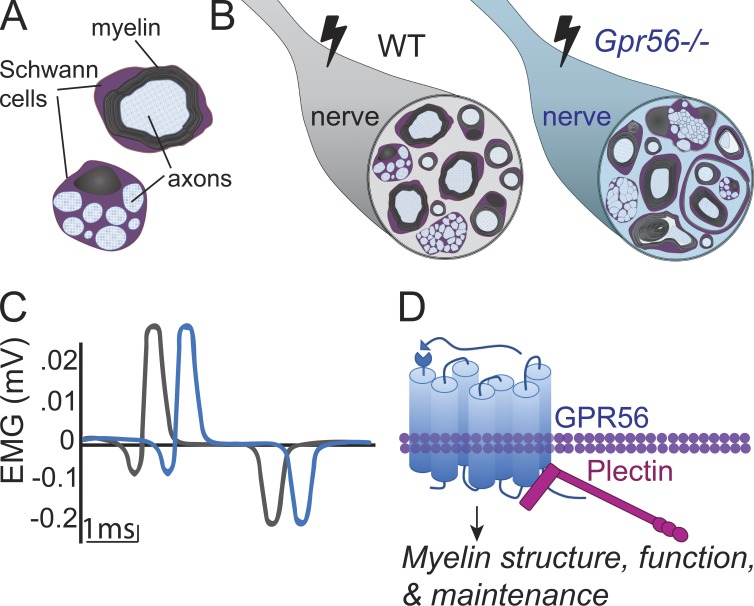
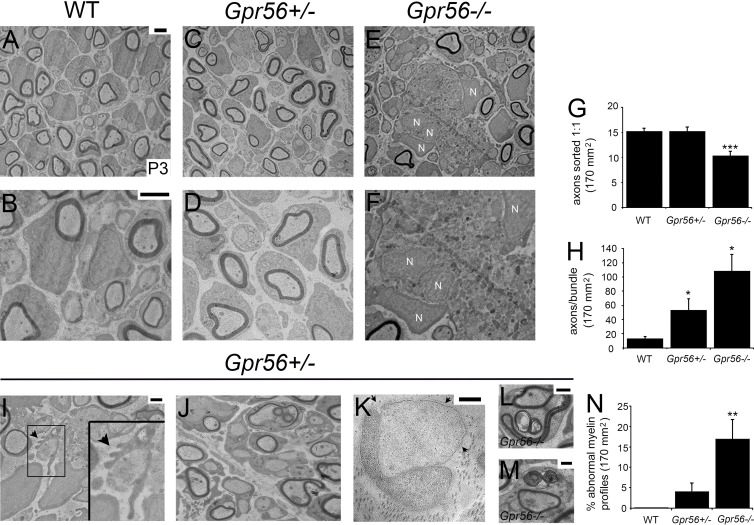
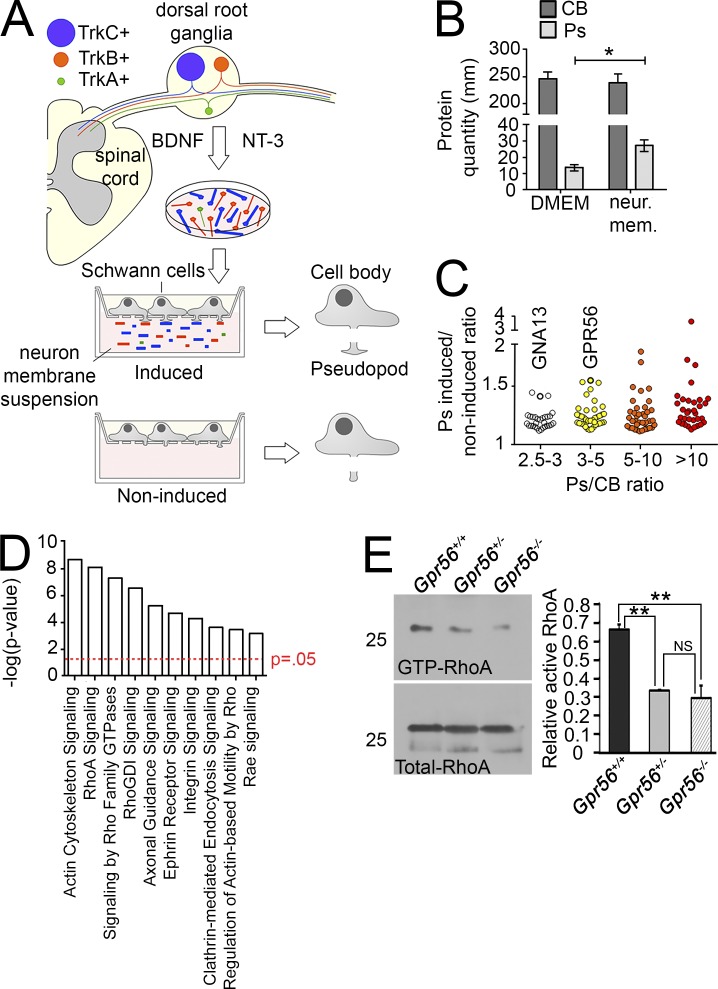
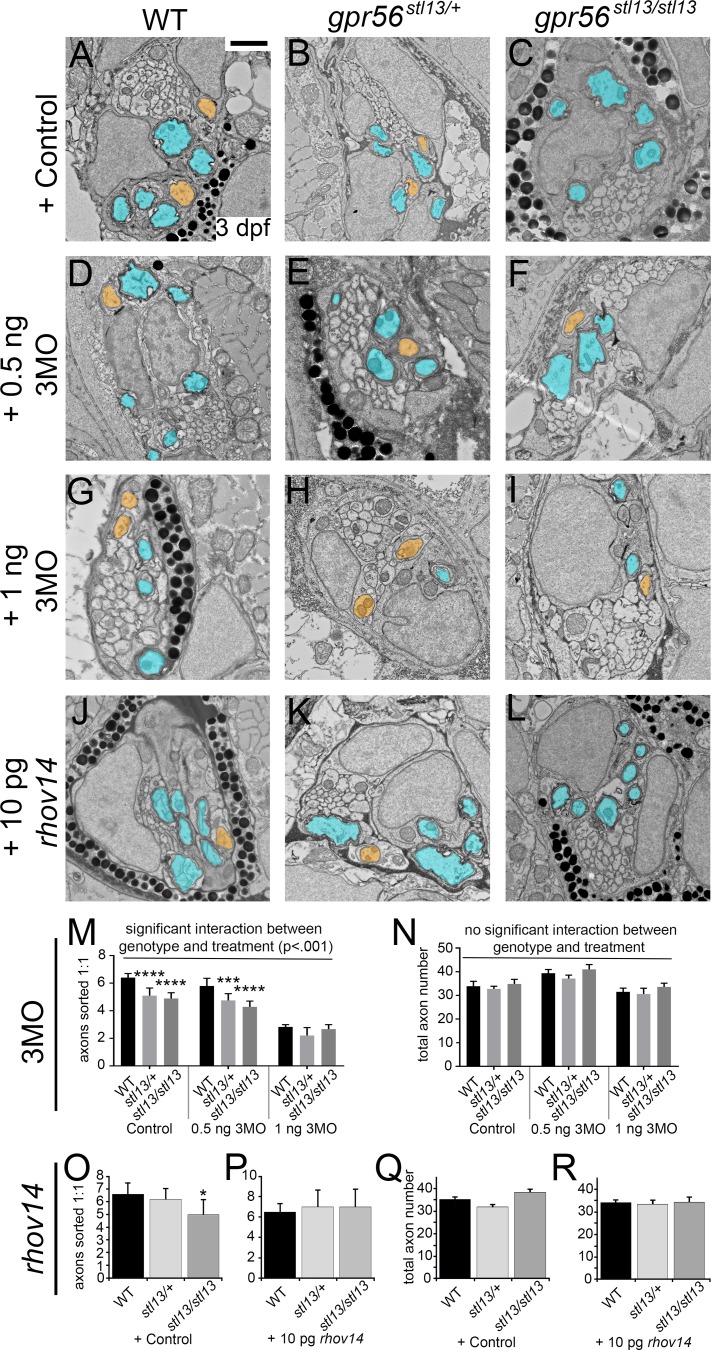
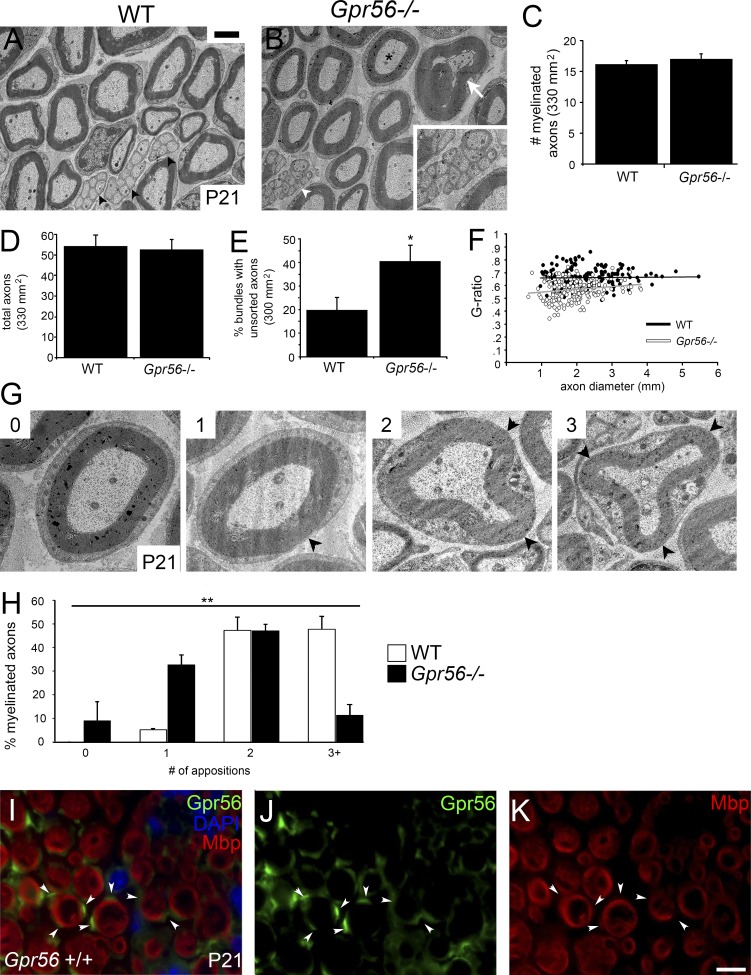
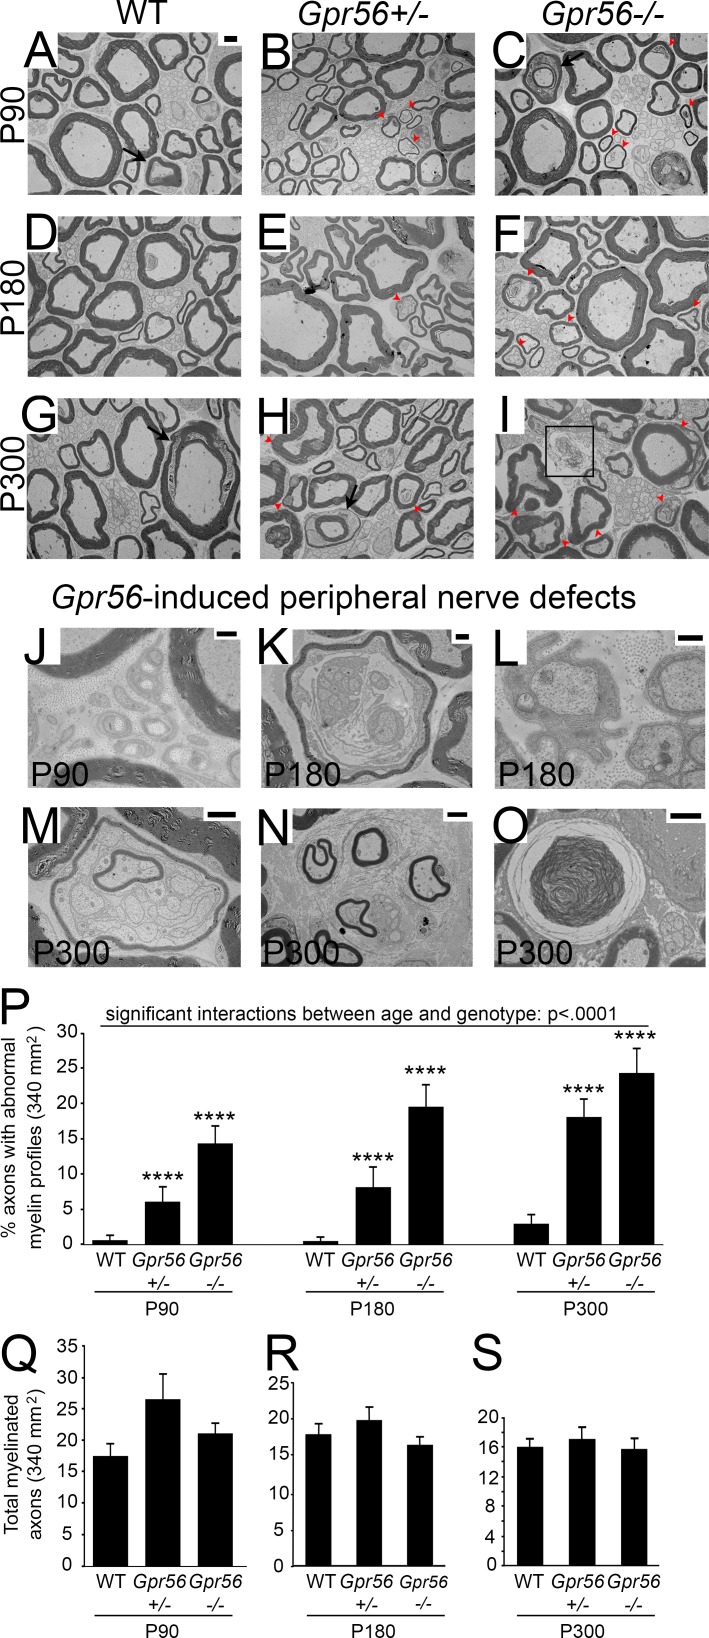
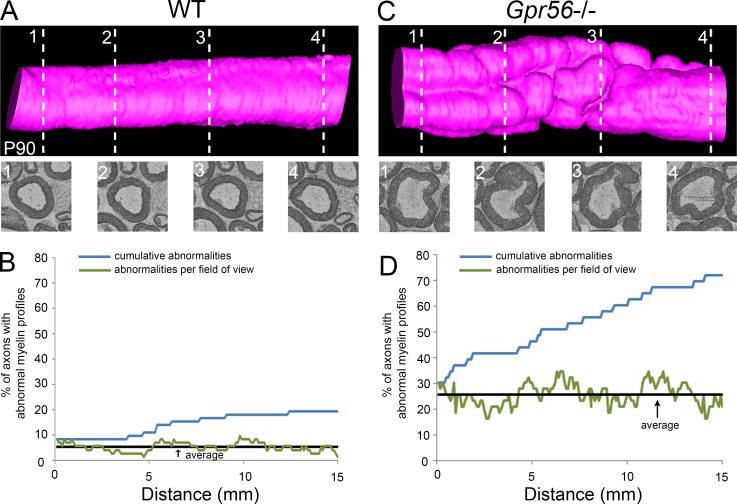
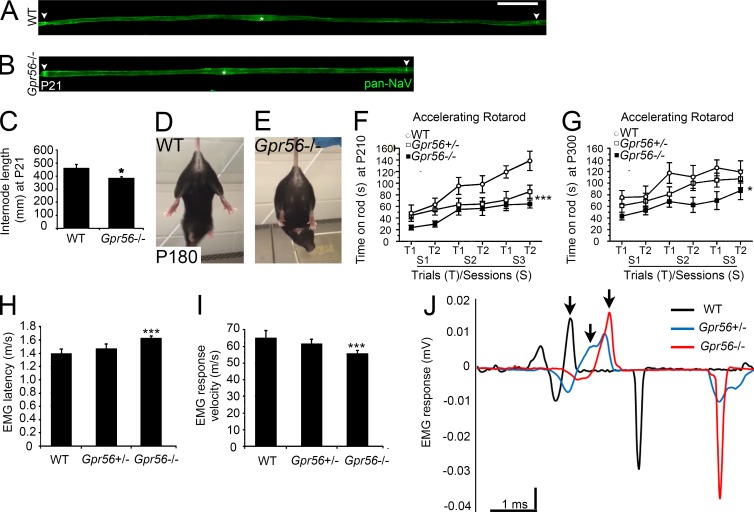
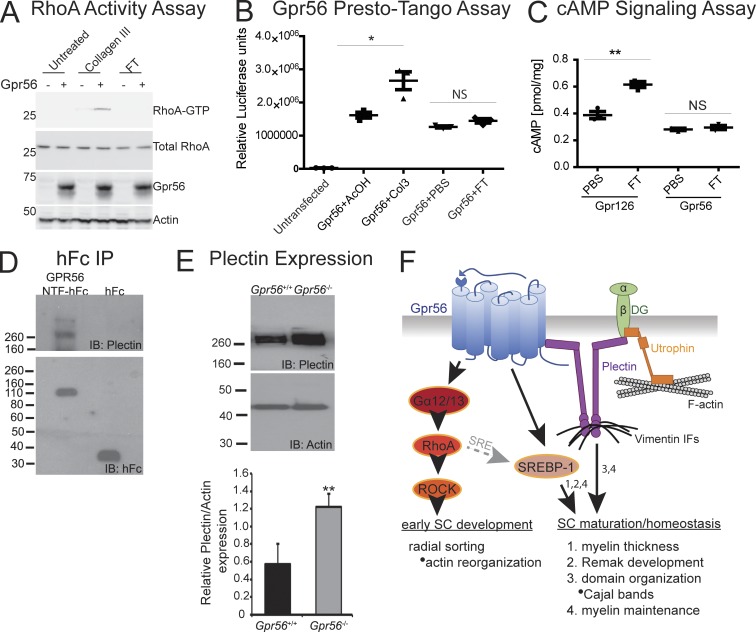
Myelin is a multilamellar sheath generated by specialized glia called Schwann cells (SCs) in the peripheral nervous system (PNS), which serves to protect and insulate axons for rapid neuronal signaling. In zebrafish and rodent models, we identify GPR56/ADGRG1 as a conserved regulator of PNS development and health. We demonstrate that, during SC development, GPR56-dependent RhoA signaling promotes timely radial sorting of axons. In the mature PNS, GPR56 is localized to distinct SC cytoplasmic domains, is required to establish proper myelin thickness, and facilitates organization of the myelin sheath. Furthermore, we define plectin-a scaffolding protein previously linked to SC domain organization, myelin maintenance, and a series of disorders termed "plectinopathies"-as a novel interacting partner of GPR56. Finally, we show that Gpr56 mutants develop progressive neuropathy-like symptoms, suggesting an underlying mechanism for peripheral defects in some human patients with GPR56 mutations. In sum, we define Gpr56 as a new regulator in the development and maintenance of peripheral myelin.


Figures

None
Graphical abstract
Figure 1.
Figure 1.
GPR56 is required for efficient radial sorting. (A–F) TEM images of SN from (A and B) WT (n = 3), (C and D) Gpr56+/− (n = 3), and (E and F) Gpr56−/− mice (n = 4) on P3. SC precursor nuclei (N) surrounding and within axon bundles in Gpr56−/− nerves. Higher magnification images: B, D, and F. Bars, 2 µm. (G) Quantification of axons sorted 1:1 with SCs (***, P < 0.0002, one-way ANOVA). (H) Quantification of the number of axons per unsorted bundle (*, P < 0.04, one-way ANOVA). (I–M) TEM images of P3 SN Gpr56−/− (n = 4) animals. Bars: (I, J, L, and M) 1 µm; (I inset and K) 500 nm. (I) Large bundles of unsorted axons surrounded by SC processes are observed in a Gpr56−/− SN. Some SCs also exhibited abnormal cytoplasmic protrusions (arrowhead). Higher magnification of the boxed in region shown within the inset. In addition, (J, L, and M) myelin abnormalities (outfoldings) and (K) nearly naked axons associated with SCs and partially surrounded by SC basal lamina (arrows) were often observed. (N) Quantification of the percent of axons with myelin abnormalities revealed a significant increase in myelin defects in Gpr56−/− nerves compared with WT controls (**, P < 0.002, one-way ANOVA). (G, H, and N) Error bars represent SEM.
Figure 2.
Figure 2.
GPR56 and interacting proteins are enriched in pseudopods after induction by membranes of DRG neurons dependent on BDNF and NT-3. (A) Schematic representation of the pseudopod assay. DRG were dissected from E15.5 rats. Neurons were selected with BDNF and NT-3 growth factors. After purification, neurons were collected and homogenized. SCs were induced or not with neuronal membrane suspension. Pseudopods (Ps) were isolated from cell bodies (CBs), and both were analyzed by MS. (B) Quantification by bicinchoninic acid assay of the protein content of SC pseudopods and CBs after induction. Data are shown as mean ± SD; n (independent experiment) = 3. *, P < 0.05. (C) Distribution of proteins enriched by neuronal membranes. The abscissa axis indicates relative polarization of a protein between P and CB. The ordinate axis indicates relative enrichment of a protein by neuronal membranes in comparison to noninduced condition. Both GPR56 and GNA13 are found enriched in SC Ps after neuronal membranes induction. (D) Protein ontology analysis of the pathways most enriched in SC Ps. RhoA signaling is enriched by neuronal membranes. For more complete listings, see Dataset 1. Student’s t test (unpaired) was used to test for statistical significance. (E) GTP-RhoA pull-down assay revealed a significant decrease in the proportion of GTP-RhoA (active) to total RhoA in Gpr56−/− and Gpr56+/− animals relative to WT controls on P6 (**, P < 0.01, unpaired Student’s t test; data are shown as mean ± SEM; n = 4 nerves from n = 2 animals per technical replicate; n = 3 technical replicates).
Figure 3.
Figure 3.
Gpr56 signals through Gα12/13 and RhoA to promote radial sorting. (A–I) TEM images of the pLLn of WT, gpr56stl13/+, and gpr56stl13/stl13 larvae injected with (A–C) phenol red control (n = 6 animals per genotype), (D–F) 0.5 ng 3MOs targeting Gα12/13 signaling (3MO = gna12-MO, gna13a-MO, and gna13b-MO; n = 6 WT, n = 5 gpr56stl13/+, and n = 5 gpr56stl13/stl13 animals examined), or (G–I) 1 ng 3MO (n = 3 animals per genotype). (J–L) In a separate series of experiments, animals were injected with constitutively active rhov14 (rhov14: n = 3 animals per genotype; control: n = 3 each WT and gpr56stl13/+, n = 4 gpr56stl13/stl3). Sorted axons are pseudocolored orange. Myelinated axons are pseudocolored blue. (A–L) Bar, 1 µm. (M) Two-way ANOVA analysis revealed a significant interaction between genotype and treatment for 3MO experiments (****, P < 0.0001). Tukey’s multiple comparisons test was also performed and found a significant reduction in the number of sorted axons between control WT embryos and control heterozygous (****, P < 0.0001) as well as control mutant embryos (****, P < 0.0001). A significant decrease in sorted axon number was observed between 0.5-ng 3MO-treated WT and -treated heterozygous (***, P < 0.001) and -treated mutant embryos (****, P < 0.0001). No significant comparisons were found in the 1-ng 3MO condition. (N) Total axon number is unaffected by genotype or treatment (two-way ANOVA). (O) Quantification of the number of axons sorted 1:1 in phenol red controls (P < 0.03, unpaired Student’s t test) compared with (P) rhov14-injected embryos (no significant differences). (Q and R) Total axon number was unchanged by test condition (unpaired Student’s t test). Data reflect two independent experimental replicates. (M–R) Error bars represent SEM.
Figure 4.
Figure 4.
GPR56 regulates mature myelin ultrastructure and domain organization. (A and B) TEM images of WT (n = 3) and Gpr56 mutant mouse (n = 3) SNs on P21. Bar, 2 µm. White arrow denotes myelin outfolding. Black arrowheads denote morphologically WT Remak bundles, which are incompletely formed in Gpr56 mutants (B, white arrowhead/inset). The asterisk marks an axon with no appositions. (C–E) Quantification of (C) total number of myelinated axons (P < 0.45, one-way ANOVA), (D) overall axon number (P < 0.81, one-way ANOVA), and (E) percentage of bundles containing axons that are not fully sheathed in Gpr56 mutants and WT sibling nerves (*, P < 0.03, one-way ANOVA). Error bars represent SEM. (F) Plots of G-ratios in mutants and WT controls (P < 0.002, one-way ANOVA). (G) TEM images of Gpr56−/− myelinated axons with 0, 1, 2, or 3 appositions. (H) Distribution of the percentage of myelinated axons (mean ± SD) per apposition number in WT (white bars) and Gpr56−/− SNs (black bars, **, P < 0.002, one-way ANOVA). (I–K) IHC showing GPR56 (green), DAPI (nuclear stain, blue), and MBP (marker of mature myelin) localization on P21 SNs. In WT SNs, GPR56 is detected in pockets (arrowheads) outside of MBP-positive rings but absent from mature axons. (J) GPR56 stain alone. (K) MBP stain alone. Bar, 5 µm.
Figure 5.
Figure 5.
Gpr56 mutant mice show progressive accumulation of myelin abnormalities. (A–C) TEM images of SNs from (A) WT (n = 3), (B) Gpr56+/− (n = 3), and (C) Gpr56−/− (n = 4) mice on P90. (D–F) TEM images of SNs from (D) WT, (E) Gpr56+/−, and (F) Gpr56−/− mice on P180 (n = 3 animals per genotype). (G–I) TEM images of SNs from (G) WT, (H) Gpr56+/−, and (I) Gpr56−/− mice on P300 (n = 3 animals per genotype). Red arrowheads denote abnormal myelin profiles. Black arrows mark Schmidt-Lanterman incisures. Black box highlights myelin debris observed by P300. (A–I) Bar, 2 µm. (J–O) SC defects and pathologies observed in Gpr56 heterozygous and mutant peripheral nerves included bands of Büngner (J; bar, 500 nm), aberrant myelination of other SCs (K; bar, 2 µm), abnormal cytoplasmic protrusions (L; bar, 500 nm), myelinated Remak bundles (M; bar, 4 µm), minifascicles (N; bar, 2 µm), and myelin debris accumulation (O; bar, 2 µm). (P) Two-way ANOVA analysis revealed a significant interaction between age and genotype (****, P < 0.0001). Dunnett's multiple comparisons test also showed significant increases in the percent of axons with abnormal myelin profiles in Gpr56+/− and Gpr56−/− animals compared with WT at each time point (****, P < 0.0001). (Q–S) No significant differences between total myelinated axon number in WT and Gpr56−/− (P90: P < 0.15; P180: P < 0.44; P300: P < 0.89), nor between Gpr56+/− and Gpr56−/− (P90: P < 0.14; P180: P < 0.13; P300: P < 0.52) at any stage. Unpaired Student’s t test. (P–S) Error bars represent SEM.
Figure 6.
Figure 6.
Gpr56 is required for myelin stability. (A–D) Serial scanning EM images (350, 100 nm apart) of WT and Gpr56−/− mouse SN on P90 (n = 3 animals per genotype) were acquired and reconstructed to generate the WT and Gpr56−/− models shown in A and C, respectively. Single sections taken from multiple locations along the nerve (1–4) are shown below each model (dashed lines show approximate locations). The percentage of axons with abnormal myelin profiles was calculated per section over a 15-µm distance for the WT (B) and Gpr56 mutant (D) reconstruction and is graphed to show the percentage of abnormalities per section (green line), the average percentage of abnormalities over all sections (black line) and the cumulative percentage of abnormalities (percentage of axons that show at least one abnormality over 15 µm [blue line]).
Figure 7.
Figure 7.
Gpr56 mutants display neuropathy-like symptoms. (A and B) IHC on teased nerve fibers from WT (n = 3) and Gpr56−/− (n = 4) mouse SNs on P21 stained for Pan-NaV to mark nodes of Ranvier (arrowheads). Bar, 50 µm. (C) Quantification of internode length on P21 (P < 0.05, one-way ANOVA). (D and E) Hindlimb clasping observed in Gpr56 mutants (n = 8/11) but not WT siblings on P180 (n = 1/11). (F and G) Quantification of time on rotarod to assess sensorimotor control on P180 (genotype effect: ***, P < 0.001, two-way ANOVA; n = 11 WT, n = 16 Gpr56+/−, n = 13 Gpr56−/−) and P300 (genotype effect, *, P < 0.02, two-way ANOVA; n = 10 WT, n = 15 Gpr56+/−, n = 12 Gpr56−/−). Error bars represent SEM. (H) Quantification of EMG latency (m/s) in animals aged P200–P300 (***, P < 0.001, one-way ANOVA). Error bars represent SD. (I) Quantification of EMG response velocity (m/s) in animals aged P200–P300 (***, P < 0.001, one-way ANOVA). Error bars represent SD. (J) Representative traces from EMG recordings from WT (black, n = 5), Gpr56+/− (blue, n = 12), and Gpr56−/− (red, n = 11) SNs. Arrows denote the point of the first positive deflection.
Figure 8.
Figure 8.
Plectin and GPR56 physically and genetically interact in peripheral nerve. (A) GTP-RhoA assay to assess Gpr56 signaling in response to exogenous ligands. Addition of collagen III, a known activating ligand of Gpr56, to HEK 293T cells coexpressing Gpr56 result in elevation of GTP-RhoA levels over control (untransfected). Addition of prion protein (FT) does not induce Gpr56 signaling through RhoA. (B) Gpr56 Presto-Tango luciferase assay to assess Gpr56 signaling in HTLA cells. Addition of collagen III results in a significant elevation of luciferase compared with AcOH alone control (*, P < 0.05, unpaired Student’s t test). Addition of FT did not result in a significant elevation of luciferase relative to PBS controls (P = 0.0647, unpaired Student’s t test). (C) cAMP ELISA assay to assess cAMP signaling through Gpr56 and Gpr126 (positive control) after addition of FT. Addition of FT to HEK 293T cells expressing Gpr126 results in a significant elevation of cAMP (**, P < 0.01, unpaired Student’s t test) compared with PBS controls. Addition of FT to cells expressing Gpr56 does not induce cAMP signaling (P = 0.4575, unpaired Student’s t test). (A–C) Data are representative of three biologically independent experiments. Error bars represent SEM. (D) Co-IP to assess interactions between GPR56 and plectin in P5 WT SNs (n = 8 nerves from four animals per replicate; n = 3 replicates). Lane 1: plectin coimmunoprecipitates with GPR56 when the NTF of GPR56 fused to human IgG Fc (NTF-hFc) is used as a bait but not when pulling down with hFc alone (lane 2). (E) Analysis of plectin levels in P6 SNs. Plectin is significantly increased in Gpr56−/− nerves over sibling controls (**, P < 0.002, unpaired Student’s t test, n = 12 nerves from six animals; error bars represent SEM). (F) Graphic model: Gpr56 promotes function of developing and mature SCs. During early SC development, Gpr56 signals through Gα12/13 and RhoA to modulate the actin cytoskeleton for efficient radial sorting of axons. During SC maturation/homeostasis, Gpr56 functions upstream of SREBP1 to regulate myelin thickness and Remak SC biology, potentially through SRE signaling downstream of RhoA (gray dashed arrow). Concordantly, Gpr56 regulates mature myelin domain organization and myelin maintenance through direct interactions with the cytolinker protein plectin, which has been shown to physically interact with additional regulators of myelin domain organization (utrophin and β-dystroglycan). We therefore hypothesize that plectin serves as a docking center for cell signaling molecules that govern the partitioning of myelin into mature subdomains (Cajal bands and appositions) and helps generate these structures through its interactions with the cytoskeleton.

Similar articles

Cited by

References

    1. Ackerman, S.D., Garcia C., Piao X., Gutmann D.H., and Monk K.R.. 2015. The adhesion GPCR Gpr56 regulates oligodendrocyte development via interactions with Gα12/13 and RhoA. Nat. Commun. 6:6122. 10.1038/ncomms7122 - DOI - PMC - PubMed
    1. Amano, M., Ito M., Kimura K., Fukata Y., Chihara K., Nakano T., Matsuura Y., and Kaibuchi K.. 1996. Phosphorylation and activation of myosin by Rho-associated kinase (Rho-kinase). J. Biol. Chem. 271:20246–20249. 10.1074/jbc.271.34.20246 - DOI - PubMed
    1. An, B., Zhang M., Johnson R.W., and Qu J.. 2015. Surfactant-aided precipitation/on-pellet-digestion (SOD) procedure provides robust and rapid sample preparation for reproducible, accurate and sensitive LC/MS quantification of therapeutic protein in plasma and tissues. Anal. Chem. 87:4023–4029. 10.1021/acs.analchem.5b00350 - DOI - PubMed
    1. Anders, S., and Huber W.. 2010. Differential expression analysis for sequence count data. Genome Biol. 11:R106. 10.1186/gb-2010-11-10-r106 - DOI - PMC - PubMed
    1. Bae, B.I., Tietjen I., Atabay K.D., Evrony G.D., Johnson M.B., Asare E., Wang P.P., Murayama A.Y., Im K., Lisgo S.N., et al. . 2014. Evolutionarily dynamic alternative splicing of GPR56 regulates regional cerebral cortical patterning. Science. 343:764–768. 10.1126/science.1244392 - DOI - PMC - PubMed

Publication types

MeSH terms

Associated data