

Within country inequalities in caesarean section rates: observational study of 72 low and middle income countries
- PMID: 29367432
- PMCID: PMC5782376
- DOI: 10.1136/bmj.k55
Within country inequalities in caesarean section rates: observational study of 72 low and middle income countries
Abstract
Objective: To provide an update on economic related inequalities in caesarean section rates within countries.
Design: Secondary analysis of demographic and health surveys and multiple indicator cluster surveys.
Setting: 72 low and middle income countries with a survey conducted between 2010 and 2014 for analysis of the latest situation of inequality, and 28 countries with a survey also conducted between 2000 and 2004 for analysis of the change in inequality over time.
Participants: Women aged 15-49 years with a live birth during the two or three years preceding the survey.
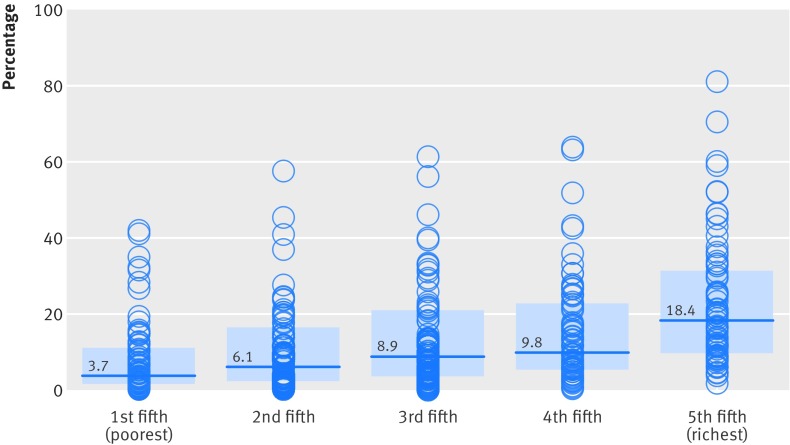
Main outcome measures: Data on caesarean section were disaggregated by asset based household wealth status and presented separately for five subgroups, ranging from the poorest to the richest fifth. Absolute and relative inequalities were measured using difference and ratio measures. The pace of change in the poorest and richest fifths was compared using a measure of excess change.
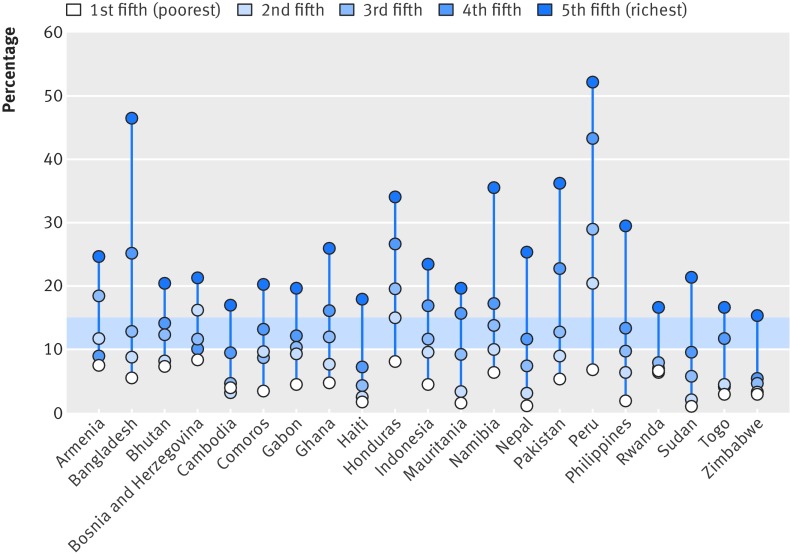
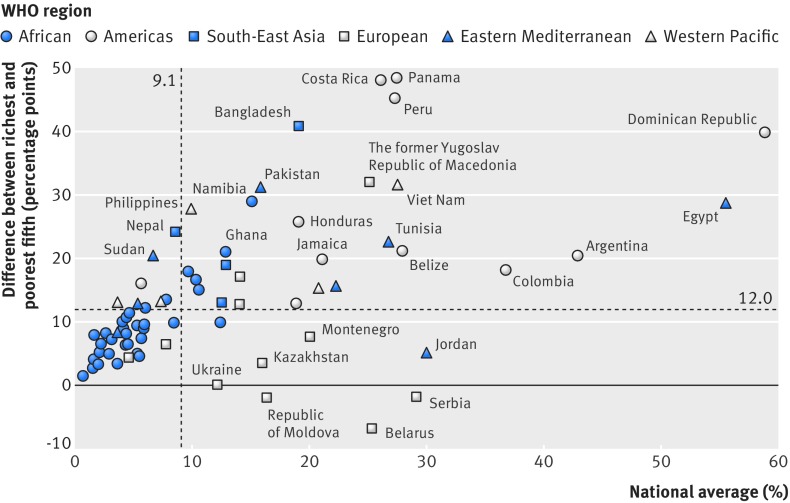
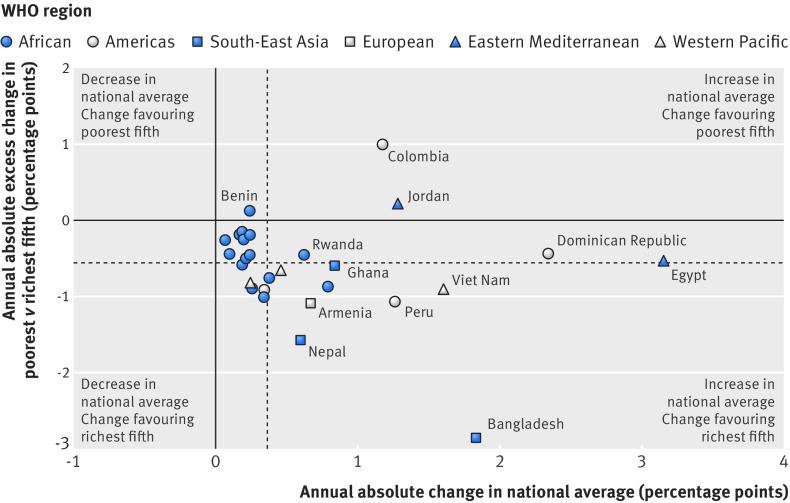
Results: National caesarean section rates ranged from 0.6% in South Sudan to 58.9% in the Dominican Republic. Within countries, caesarean section rates were lowest in the poorest fifth (median 3.7%) and highest in the richest fifth (median 18.4%). 18 out of 72 study countries reported a difference of 20 percentage points or higher between the richest and poorest fifth. The highest caesarean section rates and greatest levels of absolute inequality were observed in countries from the region of the Americas, whereas countries from the African region had low levels of caesarean use and comparatively lower levels of absolute inequality, although relative inequality was quite high in some countries. 26 out of 28 countries reported increases in caesarean section rates over time. Rates tended to increase faster in the richest fifth (median 0.9 percentage points per year) compared with the poorest fifth (median 0.2 percentage points per year), indicating an increase in inequality over time in most of these countries.
Conclusions: Substantial within country economic inequalities in caesarean deliveries remain. These inequalities might be due to a combination of inadequate access to emergency obstetric care among the poorest subgroups and high levels of caesarean use without medical indication in the richest subgroups, especially in middle income countries. Country specific strategies should address these inequalities to improve maternal and newborn health.
Published by the BMJ Publishing Group Limited. For permission to use (where not already granted under a licence) please go to http://group.bmj.com/group/rights-licensing/permissions.
Conflict of interest statement
Competing interests: All authors have completed the ICMJE uniform disclosure form at www.icmje.org/coi_disclosure.pdf and declare: no support from any organisation for the submitted work; no financial relationships with any organisations that might have an interest in the submitted work in the previous three years; no other relationships or activities that could appear to have influenced the submitted work.
Figures

References
-
- WHO Maternal Health and Safe Motherhood Programme. Mother-baby package: implementing safe motherhood in countries. World Health Organization, 1996.
-
- UNICEF WHO, UNFPA. Guidelines for monitoring the availability and use of obstetric service. United Nations Children's Fund, 1997.
-
- WHO UNFPA, UNICEF, AMDD. Monitoring emergency obstetric care: a handbook. World Health Organization, 2009.
Publication types
MeSH terms
Grants and funding
LinkOut - more resources
Full Text Sources
Other Literature Sources
Medical