. 2018 Mar 15;29(6):722-735.
doi: 10.1091/mbc.E17-06-0412. Epub 2018 Jan 24.

Interaction between the Caenorhabditis elegans centriolar protein SAS-5 and microtubules facilitates organelle assembly

Affiliations

Interaction between the Caenorhabditis elegans centriolar protein SAS-5 and microtubules facilitates organelle assembly

Sarah Bianchi et al. Mol Biol Cell. .

Abstract

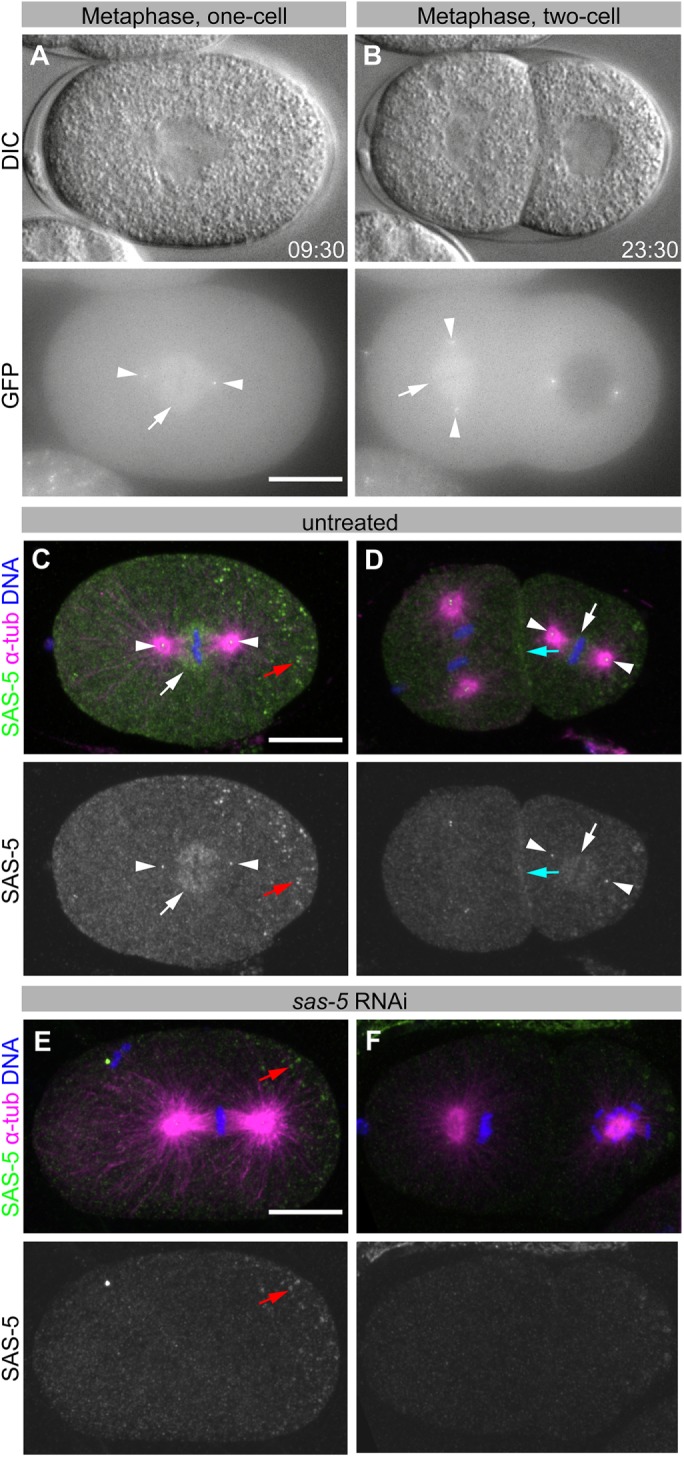
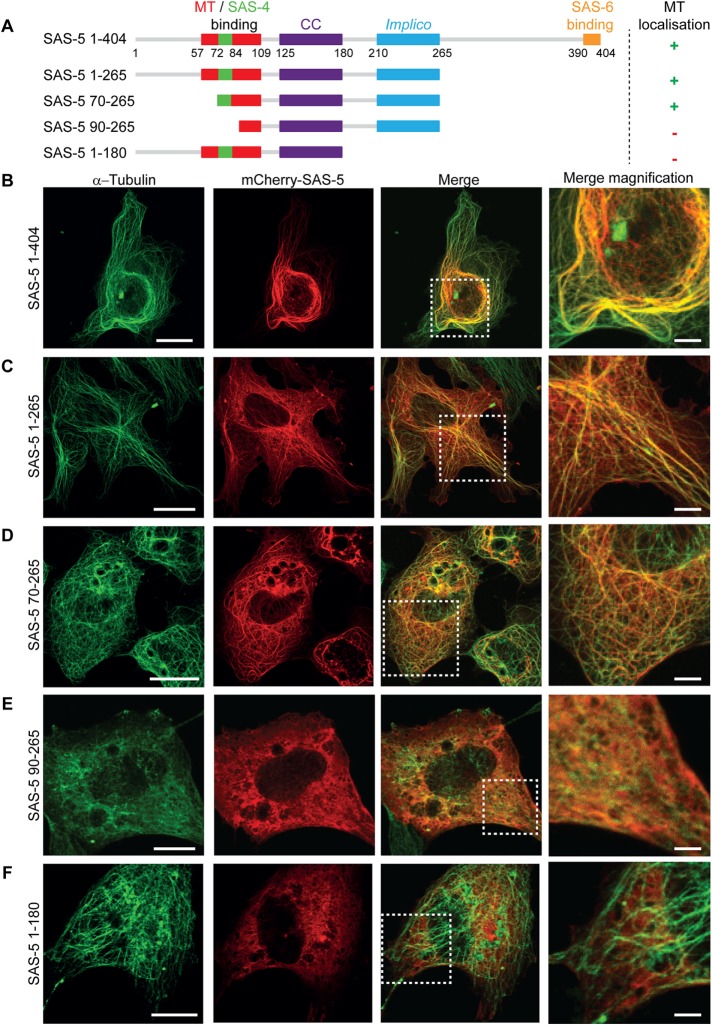
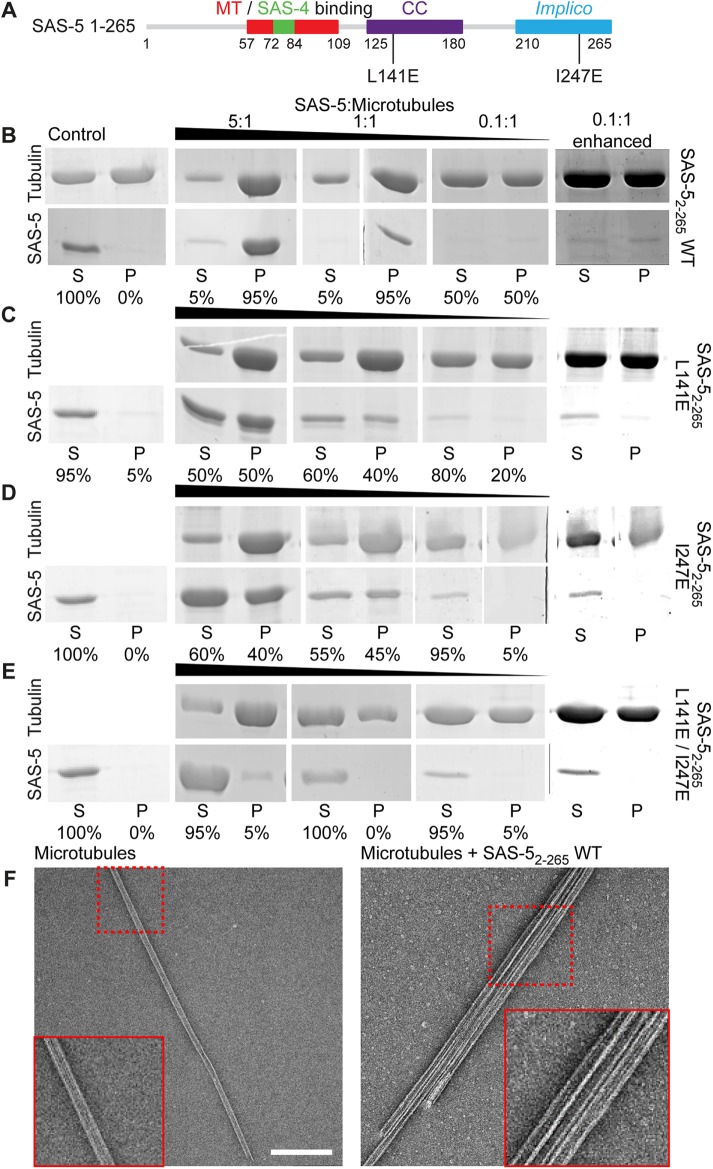
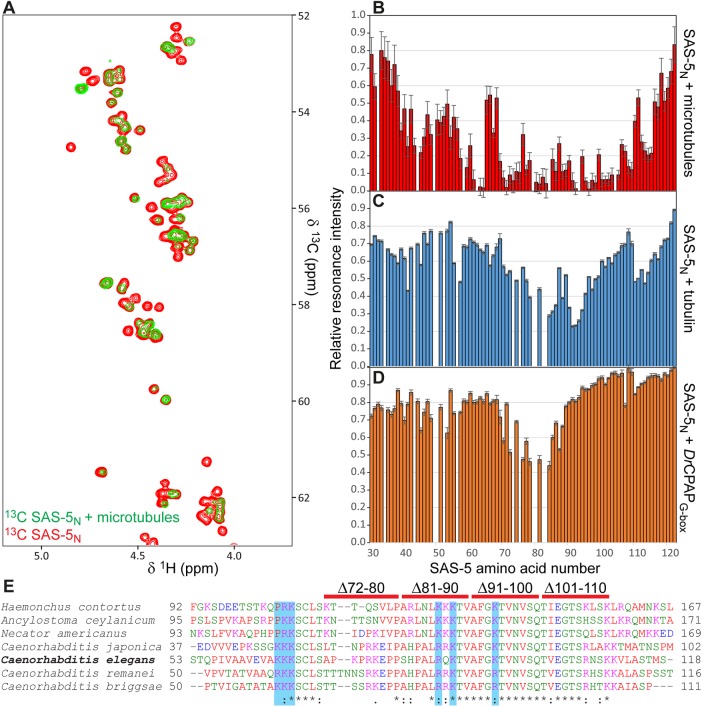
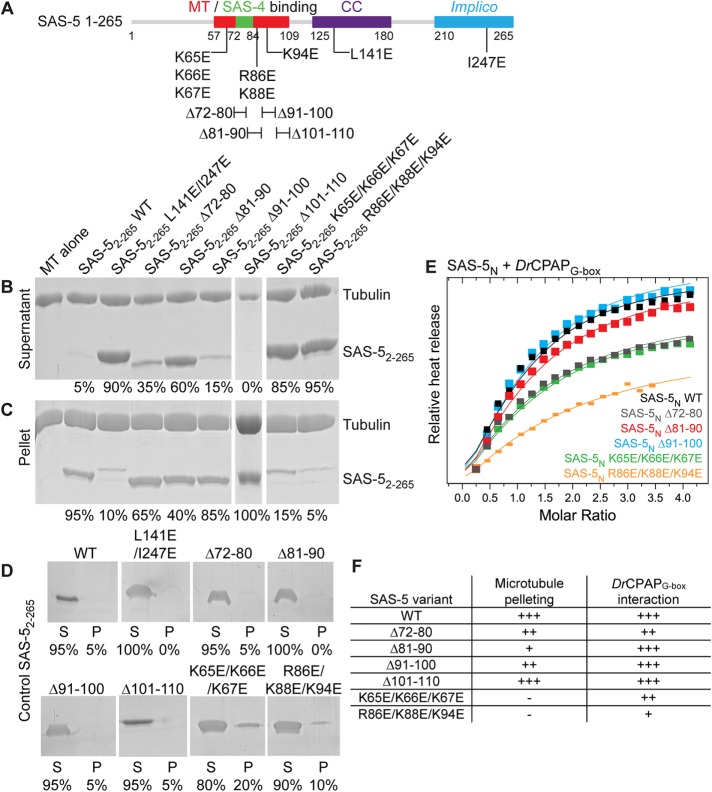
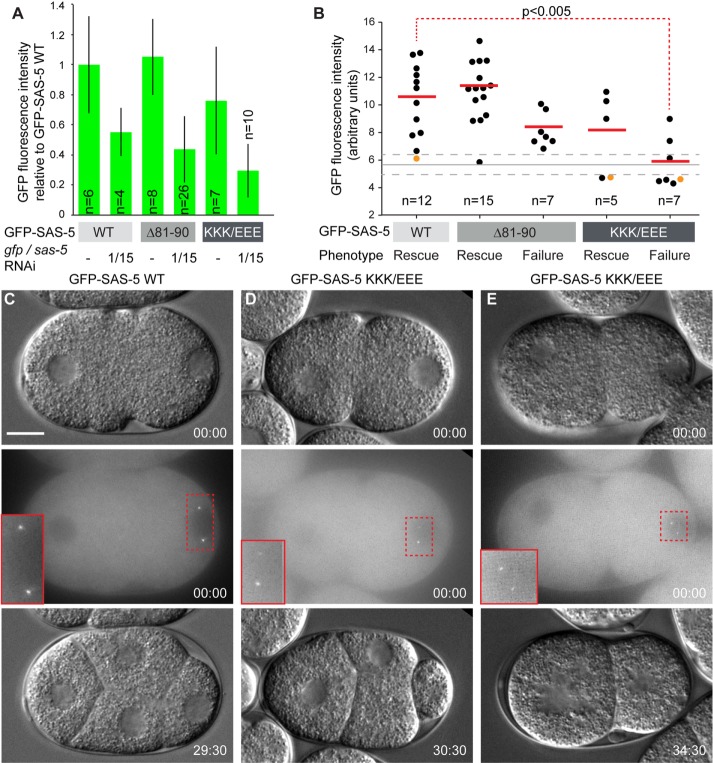
Centrioles are microtubule-based organelles that organize the microtubule network and seed the formation of cilia and flagella. New centrioles assemble through a stepwise process dependent notably on the centriolar protein SAS-5 in Caenorhabditis elegans SAS-5 and its functional homologues in other species form oligomers that bind the centriolar proteins SAS-6 and SAS-4, thereby forming an evolutionarily conserved structural core at the onset of organelle assembly. Here, we report a novel interaction of SAS-5 with microtubules. Microtubule binding requires SAS-5 oligomerization and a disordered protein segment that overlaps with the SAS-4 binding site. Combined in vitro and in vivo analysis of select mutants reveals that the SAS-5-microtubule interaction facilitates centriole assembly in C. elegans embryos. Our findings lead us to propose that the interdependence of SAS-5 oligomerization and microtubule binding reflects an avidity mechanism, which also strengthens SAS-5 associations with other centriole components and, thus, promotes organelle assembly.


Figures

FIGURE 1:
FIGURE 1:
SAS-5 weakly localizes to the mitotic spindle. (A, B) DIC (top panels) and GFP fluorescence (bottom panels) images of an embryo expressing GFP-SAS-5, at metaphase of the one-cell stage (A) and at metaphase of the AB blastomere in the two-cell stage (B, left cell). See Supplemental Movie 1. (C–F) Immunofluorescence of wild-type (N2) embryos from worms grown without RNAi (C, D) or upon sas-5(RNAi) (E, F). Top panels show SAS-5 (green), α-tubulin (magenta), and DNA (blue); bottom panels show SAS-5 only. Images are maximum-intensity z-projections. White arrows indicate SAS-5 spindle staining; white arrowheads, centrioles; cyan arrows, membrane/cortical staining; and red arrow, nonspecific P-granule staining. SAS-5 localizes to centrioles, as well as to the mitotic spindle, most notably proximal to kinetochores, and at the cell cortex, together suggesting that SAS-5 exhibits affinity for microtubule plus ends. Scale bars, 10 μm. All embryos are oriented with the anterior on the left and the posterior on the right.
FIGURE 2:
FIGURE 2:
SAS-5 colocalizes with microtubules in mammalian cells. (A) Schematic representation of SAS-5 constructs used in transfection assays, showing the coiled-coil and Implico oligomerization domains of SAS-5, as well as microtubule (MT)-, SAS-4-, and SAS-6-interaction regions. Note that the SAS-4 and microtubule-binding sites partly overlap. The microtubule localization in COS-7 cells of each construct is indicated on the right. (B–F) Representative fluorescence images of COS-7 cells transiently expressing mCherry-SAS-5 full length (B) or truncations as indicated (C–F). Microtubules were visualized using immunofluorescence with α-tubulin antibodies; SAS-5 was visualized by mCherry fluorescence. Scale bar, 20 μm. The rightmost column corresponds to digital magnification of boxed areas in merged images. Scale bar, 5 μm in magnified images. Assays were performed once. The diffused microtubule fluorescence in cells expressing mCherry-SAS-5 90–265 (E) was seen throughout this particular transfection but not in parallel transfections of HEK293T cells (Supplemental Figure S1E), indicating that such diffused appearance is not a property of the SAS-5 construct but a transfection artifact.
FIGURE 3:
FIGURE 3:
SAS-5 interacts directly with microtubules in an oligomerization-dependent manner. (A) Schematic representation of SAS-5 constructs used in pelleting assays, annotated as in Figure 2A, and further showing amino acid substitutions abrogating SAS-5 oligomerization via the coiled-coil (L141E) and Implico (I247E) domains. (B–E) Shown are relevant sections of Coomassie-stained SDS–PAGE from the supernatant (S) and pellet (P) fractions of low-speed microtubule-pelleting assays performed twice using three different stoichiometric ratios of purified SAS-52–265 vs. tubulin, as indicated. Row A corresponds to SAS-52–265 WT; rows B–D correspond to dimeric (B; L141E), trimeric (C; I247E), or monomeric (D; L141E/I247E) SAS-52–265. The rightmost panels of row A are contrast-enhanced variants of the 0.1:1 SAS-5 to microtubule ratio panels. Fractional values under each lane correspond to the percentage of SAS-5 constructs present in the supernatant vs. the pellet of assays. Assembled tubulin concentration was 3 μM throughout. Control assays were performed using either 3 μM tubulin in microtubules (top) or 3 μM SAS-52–265 (bottom) alone. (E) Negative-stain electron micrographs of pellet fractions from assays of microtubules alone (left) or in the presence of SAS-52–265 WT (right). Scale bar, 200 nm. Insets correspond to twofold magnified views of the regions indicated in dashed boxes.
FIGURE 4:
FIGURE 4:
NMR assays to localize SAS-5 interactions. (A) Shown in the overlay are representative sections of 13C-HSQC NMR experiments corresponding to Hα-Cα resonances of labeled SAS-5 residues 2–122 (SAS-5N) alone (red) or in 1:1 complex with Taxol-stabilized microtubules (green). Attenuation of specific Hα-Cα SAS-5N resonances is indicative of direct microtubule binding. (B–D) Quantification of SAS-5N NMR resonance intensities upon binding to protein partners. Plotted are fractional resonance intensities of SAS-5N in complex vs. alone as function of SAS-5 amino acid number. Panel B represents SAS-5 binding to microtubules and derives from Hα-Cα resonances. Panels C and D represent SAS-5 binding to unpolymerized tubulin and DrCPAPG-box, respectively, and derive from HN-N resonances in 15N-HSQC experiments. Error bars are derived from the noise level of HSQC spectra. Assays were performed once. (E) Clustal omega (Sievers et al., 2011) multiple sequence alignment of nematode SAS-5 sequences spanning the microtubule binding identified in C. elegans SAS-5. Blue highlights and red bars demote C. elegans SAS-5 amino acid residues substituted or regions deleted, respectively, aiming to abrogate the microtubule interaction.
FIGURE 5:
FIGURE 5:
Decoupling microtubule and SAS-4 binding activity in SAS-5. (A–C) Relevant sections of Coomassie-stained SDS–PAGE from the supernatant (A) and pellet (B) fractions of pelleting assays performed using Taxol-stabilized microtubules alone and with SAS-52–265 variants designed to disrupt the microtubule interaction. 3 μM of SAS-52–265 and tubulin were used throughout. SAS-52–265 WT and monomeric L141E/I247E variant comprise microtubule-binding positive and negative controls, respectively. Panel C shows control pelleting assays of 3 μM SAS-52–265 WT and variants without microtubules; S represents the supernatant fraction and P denotes the pellet fraction. Fractional values under each lane correspond to the percentage of SAS-5 constructs present in the supernatant vs. the pellet of assays. (D) Superimposed ITC heat released upon injection of SAS-5N WT and select variants to DrCPAPG-box. Heat released upon injection (closed squares) was scaled relative to the per mole enthalpy change derived from fitting ITC data to a single association model; fits are shown as solid lines. Complete, unscaled ITC data of all SAS-5N variants are shown in Supplemental Figure S6. Assays were performed once. (E) Tabular representation of microtubule and DrCPAPG-box binding affinities of SAS-5 variants.
FIGURE 6:
FIGURE 6:
SAS-5 microtubule-binding variants affect centriole duplication. (A) Average normalized GFP fluorescence intensities of transgenic embryos resulting from worms expressing GFP-SAS-5 WT or microtubule-binding deficient variants in the absence of RNAi or after sas-5 and gfp RNAi treatment, as indicated. Error bars correspond to one SD of measured cytoplasmic fluorescence intensities from multiple embryos as shown. GFP-SAS-5 K65E/K66E/K67E is abbreviated as KKK/EEE. (B) Dot plot of transgenic embryos expressing GFP-SAS-5 WT or microtubule-binding deficient variants under dual RNAi conditions; shown here are GFP fluorescence intensities of individual embryos and phenotypic outcomes (rescue or failure to rescue the sas-5 RNAi phenotype). The number of embryos monitored is indicated. There was a strong (R2 = 82%) correlation between GFP intensity levels in the cytoplasm and centrioles of embryos in which this could be reliably measured (n = 38). Red solid lines correspond to average GFP fluorescence intensity in each outcome class, the gray solid line to average background fluorescence measured in nontransgenic N2 embryos (n = 18), and gray dashed lines to one SD confidence intervals for background fluorescence. The red dashed line denotes pairwise Wilcoxon rank sum statistical analysis. The probability that GFP intensities are similar between the two indicated embryo classes is shown. No other pairwise analysis of WT vs. mutant sas-5 transgene GFP intensities expression approached statistical significance (p < 0.05); however, we acknowledge that given the limited embryo numbers, our ability to discern potential differences in protein levels, for instance in the subset of GFP-SAS-5 Δ81–90 embryos that failed to rescue, is restricted. (C–E) DIC (top panel) and GFP fluorescence images (middle panel, maximum-intensity z-projections) are shown for three embryos indicated in panel B by orange dots, and DIC images of the same embryos are shown ∼ 30 min later when the four-cell stage should have been attained (bottom panels). Panel C derives from embryos expressing GFP-SAS-5 WT; panels D and E derive from embryos expressing GFP-SAS-5 variant K65E/K66E/K67E and showing rescue of the sas-5 RNAi phenotype (D) or failure to do so (E). Insets in the middle panels are twofold magnifications of the indicated image areas. Time stamps are indicated in mm:ss. Scale bar, 10 μm. Embryos are oriented with the anterior on the left and the posterior on the right.

Similar articles

Cited by

References

    1. Alvarez-Cabrera AL, Delgado S, Gil-Carton D, Mortuza GB, Montoya G, Sorzano CO, Tang TK, Carazo JM. (2017). Electron microscopy structural insights into CPAP oligomeric behavior: a plausible assembly process of a supramolecular scaffold of the centrosome. Front Mol Biosci , 17. - PMC - PubMed
    1. Arquint C, Gabryjonczyk AM, Nigg EA. (2014). Centrosomes as signalling centres. Philos Trans R Soc Lond B Biol Sci , doi: 10.1098/rstb.2013.0464. - PMC - PubMed
    1. Azimzadeh J, Marshall WF. (2010). Building the centriole. Curr Biol , R816–R825.. - PMC - PubMed
    1. Baker NA, Sept D, Joseph S, Holst MJ, McCammon JA. (2001). Electrostatics of nanosystems: application to microtubules and the ribosome. Proc Natl Acad Sci USA , 10037–10041.. - PMC - PubMed
    1. Balestra FR, von Tobel L, Gönczy P. (2015). Paternally contributed centrioles exhibit exceptional persistence in C. elegans embryos. Cell Res , 642–644.. - PMC - PubMed

Publication types

MeSH terms

Substances

LinkOut - more resources