. 2018 Feb 20;90(8):e639-e646.
doi: 10.1212/WNL.0000000000004998. Epub 2018 Jan 24.

Spatial variation in high-frequency oscillation rates and amplitudes in intracranial EEG

Affiliations

Spatial variation in high-frequency oscillation rates and amplitudes in intracranial EEG

Hari Guragain et al. Neurology. .

Abstract

Objective: To assess the variation in baseline and seizure onset zone interictal high-frequency oscillation (HFO) rates and amplitudes across different anatomic brain regions in a large cohort of patients.

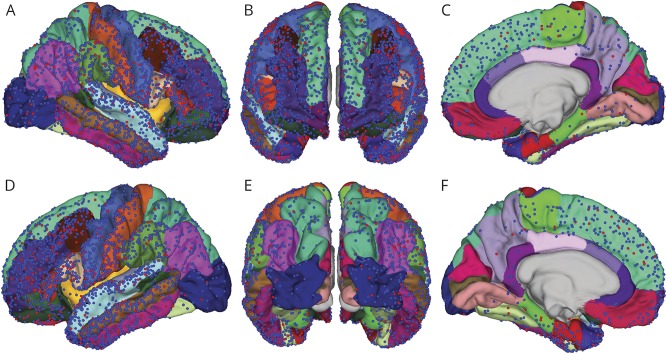
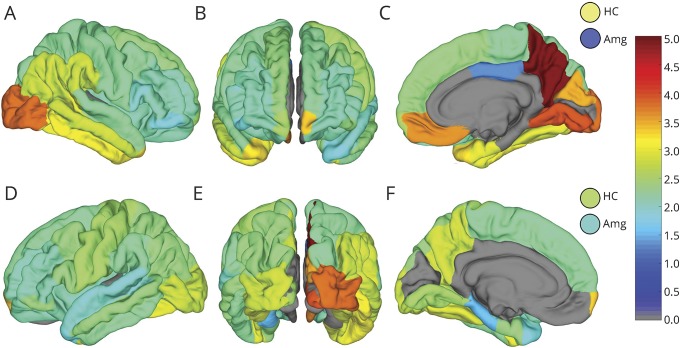
Methods: Seventy patients who had wide-bandwidth (5 kHz) intracranial EEG (iEEG) recordings during surgical evaluation for drug-resistant epilepsy between 2005 and 2014 who had high-resolution MRI and CT imaging were identified. Discrete HFOs were identified in 2-hour segments of high-quality interictal iEEG data with an automated detector. Electrode locations were determined by coregistering the patient's preoperative MRI with an X-ray CT scan acquired immediately after electrode implantation and correcting electrode locations for postimplant brain shift. The anatomic locations of electrodes were determined using the Desikan-Killiany brain atlas via FreeSurfer. HFO rates and mean amplitudes were measured in seizure onset zone (SOZ) and non-SOZ electrodes, as determined by the clinical iEEG seizure recordings. To promote reproducible research, imaging and iEEG data are made freely available (msel.mayo.edu).

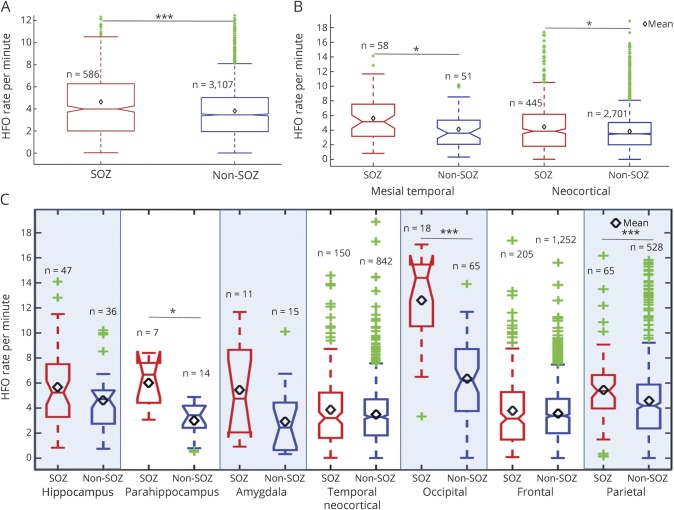
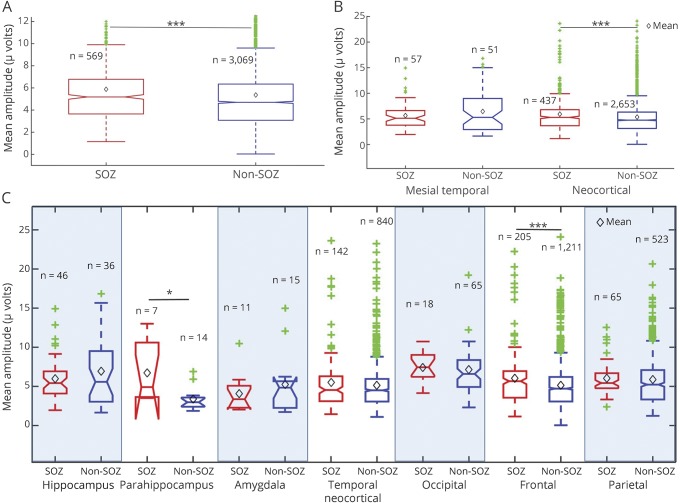
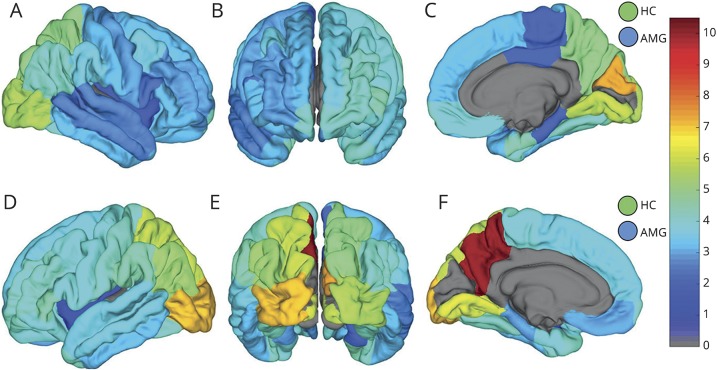
Results: Baseline (non-SOZ) HFO rates and amplitudes vary significantly in different brain structures, and between homologous structures in left and right hemispheres. While HFO rates and amplitudes were significantly higher in SOZ than non-SOZ electrodes when analyzed regardless of contact location, SOZ and non-SOZ HFO rates and amplitudes were not separable in some lobes and structures (e.g., frontal and temporal neocortex).

Conclusions: The anatomic variation in SOZ and non-SOZ HFO rates and amplitudes suggests the need to assess interictal HFO activity relative to anatomically accurate normative standards when using HFOs for presurgical planning.


Figures

Figure 1
Figure 1. Electrode positions on the Desikan-Killiany (D-K) atlas
Electrode positions on the pial surface of the D-K atlas for all patients studied. The red and blue points represent seizure onset zone (SOZ) and non-SOZ electrodes, respectively, observed from the (A) right lateral view, (B) anterior view, (C) right mesial view, (D) left lateral view, (E) posterior view, and (F) left mesial view. While not visible in the figure, the right and left hippocampi were sampled by 18 and 26 SOZ electrodes and 17 and 21 non-SOZ electrodes, respectively. The right and left amygdalae were sampled by 3 and 8 SOZ electrodes and 1 and 14 non-SOZ electrodes, respectively.
Figure 2
Figure 2. High-frequency oscillation (HFO) rates in seizure onset zone (SOZ) and non-SOZ electrodes
(A) High-frequency oscillation rates for SOZ (red) and non-SOZ (blue) are significantly different (p < 0.001) when aggregated across all brain regions. (B) High-frequency oscillation rates for SOZ (red) and non-SOZ (blue) are significantly different (p < 0.05) for mesial temporal and neocortical structures. (C) High-frequency oscillation rates for SOZ (red) and non-SOZ (blue) channels in different brain structures. Mean HFO rates are noted by the black diamonds. The green points represent outliers. Statistical tests were performed using the Hochberg-Benjamini false discovery rate correction for multiple comparisons. *Statistically significant with p < 0.05, **statistically significant with p < 0.01, ***statistically significant with p < 0.001.
Figure 3
Figure 3. High-frequency oscillation (HFO) amplitudes in seizure onset zone (SOZ) and non-SOZ electrodes
(A) The mean HFO amplitudes for SOZ and non-SOZ contacts are significantly different (p < 0.001) when aggregated across all brain regions. (B) Mean HFO amplitudes in SOZ (red) and non-SOZ (blue) are significantly (p < 0.001) different for electrodes in neocortical regions, but not mesial temporal regions (amygdala, hippocampus). (C) Mean peak HFO amplitudes of SOZ (red) and non-SOZ (blue) channels in different brain lobes. The Benjamini-Hochberg false discovery rate correction was applied to compensate for multiple comparisons. Mean HFO amplitudes are noted by the black diamonds. The green points represent outliers.
Figure 4
Figure 4. Non–seizure onset zone (SOZ) high-frequency oscillation (HFO) count rates across the Desikan-Killiany (D-K) atlas
Map of mean non-SOZ HFO counts per minute in the D-K atlas brain regions shown from right (A) and left (D) lateral, anterior (B), right (C) and left (F) mesial, and posterior (E) perspectives. Hippocampus (HC) and amygdala (AMG) counts in right and left hemisphere are shown by the circles in the top and bottom row, respectively. Atlas regions with fewer than 4 electrodes were excluded from analysis and are shown in gray.
Figure 5
Figure 5. Non–seizure onset zone (SOZ) high-frequency oscillation (HFO) amplitudes across the Desikan-Killiany (D-K) atlas
Map of mean HFO amplitude in microvolts of HFOs in non-SOZ channels in DK atlas brain regions shown from right (A) and left (D) lateral, anterior (B), right (C) and left (F) mesial, and posterior (E) perspectives. Hippocampus (HC) and amygdala (AMG) amplitudes in right and left hemisphere are shown by the circles in the top and bottom row, respectively. Atlas regions with fewer than 4 electrodes were excluded from analysis and are shown in gray.

Comment in

References

    1. Van Gompel JJ, Worrell GA, Bell ML, et al. Intracranial electroencephalography with subdural grid electrodes: techniques, complications, and outcomes. Neurosurgery 2008;63:498–505; discussion 505–506. - PubMed
    1. Berg AT, Vickrey BG, Langfitt JT, et al. The multicenter study of epilepsy surgery: recruitment and selection for surgery. Epilepsia 2003;44:1425–1433. - PubMed
    1. Tellez-Zenteno JF, Dhar R, Wiebe S. Long-term seizure outcomes following epilepsy surgery: a systematic review and meta-analysis. Brain 2005;128:1188–1198. - PubMed
    1. Bell ML, Rao S, So EL, et al. Epilepsy surgery outcomes in temporal lobe epilepsy with a normal MRI. Epilepsia 2009;50:2053–2060. - PMC - PubMed
    1. Noe K, Sulc V, Wong-Kisiel L, et al. Long-term outcomes after nonlesional extratemporal lobe epilepsy surgery. JAMA Neurol 2013;70:1003–1008. - PMC - PubMed

Publication types