. 2018 Jan 25;3(2):e98394.
doi: 10.1172/jci.insight.98394.

PKA signaling drives reticularis differentiation and sexually dimorphic adrenal cortex renewal

Affiliations

PKA signaling drives reticularis differentiation and sexually dimorphic adrenal cortex renewal

Typhanie Dumontet et al. JCI Insight. .

Abstract

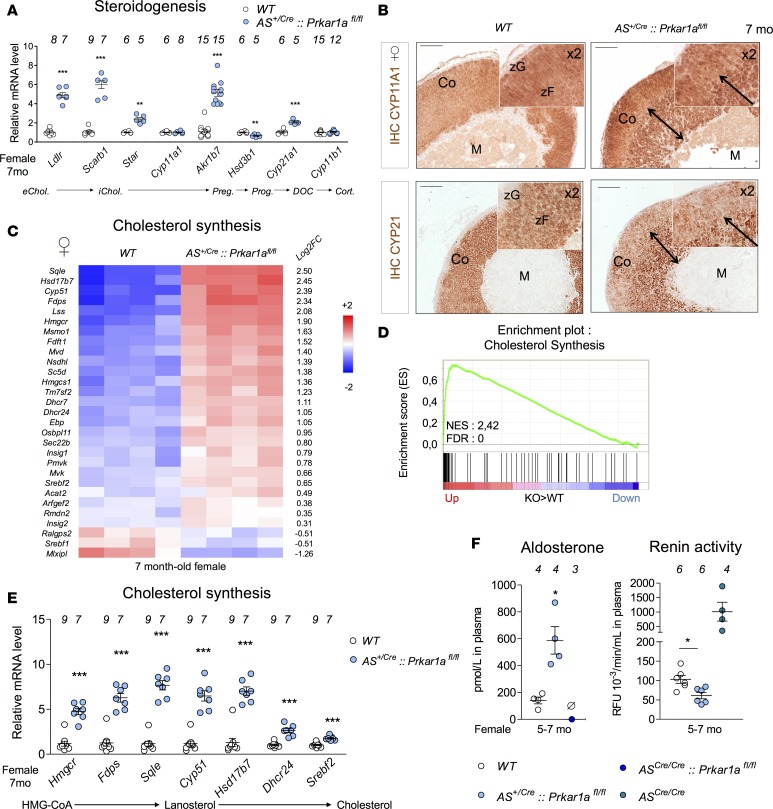
The adrenal cortex undergoes remodeling during fetal and postnatal life. How zona reticularis emerges in the postnatal gland to support adrenarche, a process whereby higher primates increase prepubertal androgen secretion, is unknown. Using cell-fate mapping and gene deletion studies in mice, we show that activation of PKA has no effect on the fetal cortex, while it accelerates regeneration of the adult cortex, triggers zona fasciculata differentiation that is subsequently converted into a functional reticularis-like zone, and drives hypersecretion syndromes. Remarkably, PKA effects are influenced by sex. Indeed, testicular androgens increase WNT signaling that antagonizes PKA, leading to slower adrenocortical cell turnover and delayed phenotype whereas gonadectomy sensitizes males to hypercorticism and reticularis-like formation. Thus, reticularis results from ultimate centripetal conversion of adult cortex under the combined effects of PKA and cell turnover that dictate organ size. We show that PKA-induced progenitor recruitment is sexually dimorphic and may provide a paradigm for overrepresentation of women in adrenal diseases.

Keywords: Development; Endocrinology; Genetic diseases; Mouse models; Protein kinases.


Conflict of interest statement

Conflict of interest: The authors have declared that no conflict of interest exists.

Figures

Figure 1
Figure 1. Loss of R1α in the adult cortex lineage is sufficient to induce endocrine and zonation defects in females.
(A) Experimental setup. Prkar1afl allele (R1α) was deleted in the adult (definitive) cortex using AS+/Cre or in fetal cortex using FAdE-CreERT2 lines. The R26RmTmG reporter was used to follow floxed allele recombination and for cell lineage tracing over time. (B) Coimmunofluorescent labeling of GFP (green) and 20α-hydroxysteroid dehydrogenase (20αHSD) fetal marker (purple) in adrenal sections from AS+/Cre::Prkar1a+/fl::R26RmTmG and AS+/Cre::Prkar1afl/fl::R26RmTmG nulliparous female mice at 1.5 months and FAdE-CreERT2::Prkar1a+/fl::R26RmTmG and FAdE-CreERT2::Prkar1afl/fl::R26RmTmG female mice at 3 weeks. (C) qPCR analyses of Prkar1a expression in female adrenals. Lines in dot plots represent the mean relative quantification of Prkar1a expression (relative to the controls) for the different genotypes ± SEM. (D) Histological examination (hematoxylin & eosin staining) shows an expansion of eosinophilic large cells from the inner cortex only occurring in AS+/Cre::Prkar1afl/fl adrenals. (E) Immunostaining of 20αHSD fetal marker. (F) Left: Plasma corticosterone levels in basal conditions or after dexamethasone suppression test (dex) in WT, FAdE-CreERT2::Prkar1afl/fl, and AS+/Cre::Prkar1afl/fl female mice of the indicated age. Right: Plasma adrenocorticotropic hormone (ACTH) concentration in 7-month-old AS+/Cre::Prkar1afl/fl females. Lines in dot plots represent the mean ± SEM. zG, zona glomerulosa; zF, zona fasciculata; zX, X-zone; Co, cortex; M, medulla. The double black arrows focus on hyperplasia. The black dots represent the border between the cortex and the medulla. Ø, under detection threshold. Statistical analyses were conducted by Student’s t test. *P < 0.05, ***P < 0.001. The number of samples is indicated above dot plots. Scale bars: 200 μm. Original magnification: ×2 (insets, D); ×4 (insets, B).
Figure 2
Figure 2. Inner hyperplasia formed in AS+/Cre::Prkar1afl/fl mice (DAdKO) has reticularis characteristics.
(A) Confocal analysis of coimmunofluorescent labeling of GFP (green) and 20α-hydroxysteroid dehydrogenase (20αHSD, purple) in 3-month-old nulliparous females. The white AS+/Cre::Prkar1afl/fl mice (DAdKO) arrows denote adult and fetal cortices. (B) qPCR analysis of Akr1c18 and Pik3c2g fetal markers in WT or AS+/Cre::Prkar1afl/fl (DAdKO) female adrenals. (C) Immunostaining and immunofluorescent analyses of HSD3B, CYB5A, and CYP17 from DAdKO 7-month-old females. The black and white double arrows denote inner hyperplasia. The black and white dots represent the border between the cortex and the medulla. (D) qPCR analysis confirms downregulation of Hsd3b1, upregulation of Cyp17a1 and Cyb5a, and, moreover, shows increased expression of Sult1e1 in DAdKO adrenals. (E) Western blot analysis of CYP17 and CYB5A protein accumulation in adrenal extracts from WT and mutant mice. Graphs showed quantification normalized to quantification of GAPDH signal. (F) Cortisol, 21-deoxycortisol, and Δ4 androstenedione levels were measured by mass spectrometry in blood, dehydroepiandrosterone (DHEA) levels were measured by ELISA in adrenal extracts from adult mice (>7 months), and dehydroepiandrosterone sulfate (DHEAS) levels were measured by RIA in blood. zG, zona glomerulosa; zF, zona fasciculata; zX, X-zone; Co, cortex; M, medulla. Lines in dot plots represent the mean ± SEM. Ø, under detection threshold. Statistical analyses were conducted by Student’s t test. *P < 0.05, **P < 0.01, ***P < 0.001. The number of samples is indicated above dot plots. Scale bars: 200 μm. Original magnification: ×2 (insets, A); ×4 (insets, C).
Figure 3
Figure 3. Endocrine overactivity is associated with upregulation of steroidogenesis pathway and cholesterol synthesis.
(A) qPCR analysis of steroidogenic gene expression in adrenals of DAdKO 7-month-old females. eChol/iChol, extra/intracellular cholesterol; Preg., pregnenolone; Prog., progesterone; DOC, deoxycorticosterone; Cort., corticosterone. (B) Immunostaining of CYP11A1 and CYP21 in adrenal sections from DAdKO 7-month-old females. (C) Color-coded heatmap shows expression of the 29 genes that are significantly deregulated (adjusted P = 0.05) relative to the cholesterol synthesis pathway. (D) Gene set enrichment analyses were performed using signatures gene set of cholesterol synthesis pathway by comparing gene expression data from WT and DAdKO female adrenals. Normalized enrichment score (NES) and false discovery rates (FDR) are shown on plots. The enrichment score plot corresponds to the 59 genes listed in Supplemental Table 3. (E) qPCR analysis of genes involved in de novo cholesterol synthesis in adrenals from 7-month-old DAdKO females. (F) Plasma aldosterone levels were measured in WT and DAdKO mice. Plasma from ASCre/Cre::Prkar1afl/fl mice (knockout for Prkar1a and Cyp11b2 [aldosterone synthase]) was used as negative control. Plasma renin activity rate was compared in WT and DAdKO mice. ASCre/Cre mice were used as positive control for renin-angiotensin system upregulation. Lines in dot plots represent the mean ± SEM. zG, zona glomerulosa; zF, zona fasciculata; zX, X-zone; Co, cortex; M, medulla. The black double arrows focus on hyperplasia. If not otherwise mentioned, all statistical analyses were conducted by Student’s t test. *P < 0.05, **P < 0.01, ***P < 0.001. The number of samples is indicated above dot plots. Scale bars: 200 μm. Original magnification: ×2 (insets, B).
Figure 4
Figure 4. Cushing’s syndrome due to loss of R1α in the adult cortex develops in a sex-dependent manner.
(A–D) Female data. (A) Image of 7-month-old DAdKO females showing fat distribution compared with WT. (B) Body weight (g) follow-up of WT and DAdKO females (mean ± SEM) from 2.5–7 months of age. (C) EchoMRI analysis of lean and fat mass distribution (%) in 7-month-old females and changes (mg) in gastrocnemius weight (mean ± SEM). (D) Fasted blood glucose concentration (mg/dl) and insulin tolerance test (ITT, % of baseline) in DAdKO females (mean ± SEM); statistical analysis was conducted by 2-way ANOVA followed by Bonferroni’s test. (E–G) Male data. (E) Coimmunofluorescent labeling of GFP (green) and fetal marker 20α-hydroxysteroid dehydrogenase (20αHSD, purple) in AS+/Cre::Prkar1afl/fl::R26RmTmG male mice. The white dots represent the border between the cortex and the medulla. zX, X-zone; Co, cortex; M, medulla. (F) Plasma corticosterone levels in basal conditions and after dexamethasone suppression test (dex) and body weight of DAdKO males. Ø, under detection threshold. (G) qPCR follow-up of Prkar1a expression in adrenals from FAdKO and DAdKO males. Lines in dot plots represent the mean relative quantification of Prkar1a expression (relative to the control counterparts, white bars) ± SEM. If not otherwise mentioned, all statistical analyses were conducted by Student’s t test. *P < 0.05, ***P < 0.001. The number of samples is indicated in curves or above dot plots. Scale bars: 200 μm.
Figure 5
Figure 5. Reticularis-like formation may be stimulated by castration in mutant males.
(A) Experimental set up. In male mice, X-zone regresses at puberty and secondary X-zone regenerates after gonadectomy (GDX) or regresses upon androgenic (dihydrotestosterone [DHT]) supplementation (GDX+DHT). Prkar1a was deleted in adult cortex (from E18.5), and castration was performed at 5 months, i.e., 2 months before dissection, at 7 months. DHT treatment was performed during the last 6 weeks. (B) Effects of gonadectomy and androgen replacement on X-zone and reticularis-like occurrence. Coimmunofluorescent labeling of GFP and 20α-hydroxysteroid dehydrogenase (20αHSD) in adrenal from controls (AS+/Cre::Prkar1a+/fl::R26RmTmG) and DAdKO (AS+/Cre::Prkar1afl/fl::R26RmTmG males. (C) qPCR analysis of Akr1c18 and Pik3c2g X-zone markers in castration experiments. Lines in dot plots represent the mean relative quantification of gene expression (relative to the gonadectomized WT) ± SEM. (D) Plasma corticosterone levels in basal conditions or after dexamethasone suppression test (dex) in gonadectomized (GDX) DAdKO males in comparison to WT. Lines in dot plots represent the mean ± SEM. Statistical analyses were conducted by 1-way ANOVA followed by Bonferroni’s test. *P < 0.05, **P < 0.01. Ø, under detection threshold. zX, X-zone; Co, cortex; M, medulla. The white dots represent the border between the cortex and the medulla. The number of samples is indicated above dot plots. Scale bars: 200 μm. Original magnification: ×3.5 (insets, B).
Figure 6
Figure 6. Constitutive activation of PKA signaling accelerates cortex renewal and stem/progenitor recruitment in an androgen-dependent manner.
(A) Lineage-tracing studies showing change in centripetal cell turnover in adrenal cryosections from control (left) and DAdKO females (3 months). GFP and Tomato mark recombined and nonrecombined cells, respectively. Scale bars: 200 µm. (B) The rate of recombination in female adrenals was assessed by quantification of eGFP transcripts using qPCR. Lines in dot plots represent the mean relative quantification of eGFP expression (relative to the control counterparts) ± SEM. Statistical analyses were conducted by Student’s t test. (C) The rate of recombination in male adrenals was assessed by quantification of eGFP transcripts using qPCR. Lines in dot plots represent the mean relative quantification of eGFP expression (relative to the control counterparts) ± SEM. Statistical analyses were conducted by 1-way ANOVA followed by Bonferroni’s test. **P < 0.01. (D and E) qPCR analyses of subcapsular (Shh)/capsular (Gli1) progenitor markers, of ligand/receptor genes (Rspo3, Wnt4, Lrp5), WNT target genes (Axin2, Lef1), and Frzb WNT repressor. Lines in dot plots represent the mean quantification relative to WT 7-month-old mice of gene expression ± SEM. Statistical analyses were conducted by 1-way ANOVA followed by Bonferroni’s test. *P < 0.05, **P < 0.01, ***P < 0.001. The number of samples is indicated above dot plots.
Figure 7
Figure 7. Model describing the role of PKA signaling in adrenal zonation, cortex replenishment, and interplay with testicular androgen.
Solid gray arrow shows the main process of cell renewal occurring through recruitment of Shh+ subcapsular progenitors that differentiate as zona glomerulosa (zG) cells. Dashed gray arrow shows alternative renewal pathway relaying on the recruitment of capsular Rspo3/Gli1+ stem/progenitor cells that are essential to maintain Shh and Wnt4 expression within subcapsular/zG cells and can, to a less extent, regenerate subcapsular progenitors. Large light green arrows symbolize the accelerated centripetal conversion of zG cells toward zona fasciculata (zF) identity and, subsequently, to cells with zona reticularis (zR) identity that eventually accumulate and expand (large dark green double-headed arrow) as cortex reaches critical size. Horizontal green bar–headed line and arrows show effects of constitutive PKA activation that represses zG identity and promotes zF and zR conversion. Horizontal blue arrows show positive effects of testicular androgen on maintaining stem/progenitor pools, at least, through increased activation of WNT/β-catenin signaling. Large orange arrow symbolizes the process of fetal X-zone formation occurring through recruitment of precursor cells maintaining FAdE active at E14.5, regardless of PKA activation.

Similar articles

Cited by

References

    1. Ishimoto H, Jaffe RB. Development and function of the human fetal adrenal cortex: a key component in the feto-placental unit. Endocr Rev. 2011;32(3):317–355. doi: 10.1210/er.2010-0001. - DOI - PMC - PubMed
    1. Mesiano S, Jaffe RB. Developmental and functional biology of the primate fetal adrenal cortex. Endocr Rev. 1997;18(3):378–403. - PubMed
    1. Bird IM. In the zone: understanding zona reticularis function and its transformation by adrenarche. J Endocrinol. 2012;214(2):109–111. doi: 10.1530/JOE-12-0246. - DOI - PubMed
    1. Rege J, Rainey WE. The steroid metabolome of adrenarche. J Endocrinol. 2012;214(2):133–143. doi: 10.1530/JOE-12-0183. - DOI - PMC - PubMed
    1. Brock BJ, Waterman MR. Biochemical differences between rat and human cytochrome P450c17 support the different steroidogenic needs of these two species. Biochemistry. 1999;38(5):1598–1606. doi: 10.1021/bi9821059. - DOI - PubMed

Publication types

Substances