. 2018 Jan 24;9(1):354.
doi: 10.1038/s41467-017-02765-w.

Regulation of REM and Non-REM Sleep by Periaqueductal GABAergic Neurons

Affiliations

Regulation of REM and Non-REM Sleep by Periaqueductal GABAergic Neurons

Franz Weber et al. Nat Commun. .

Abstract

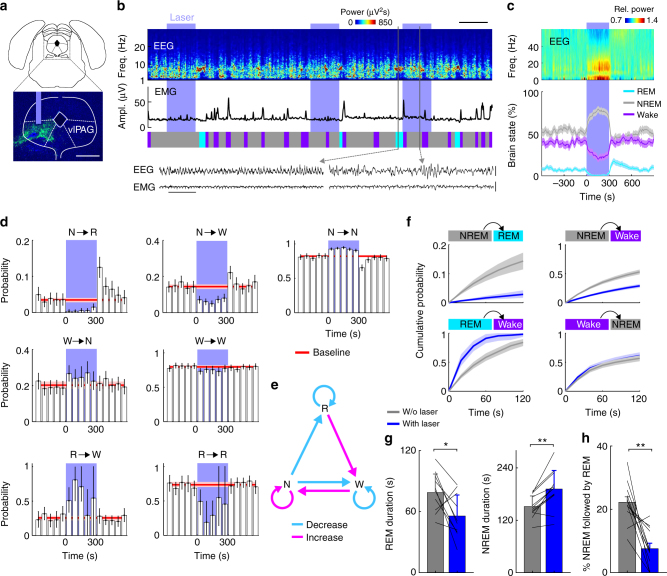
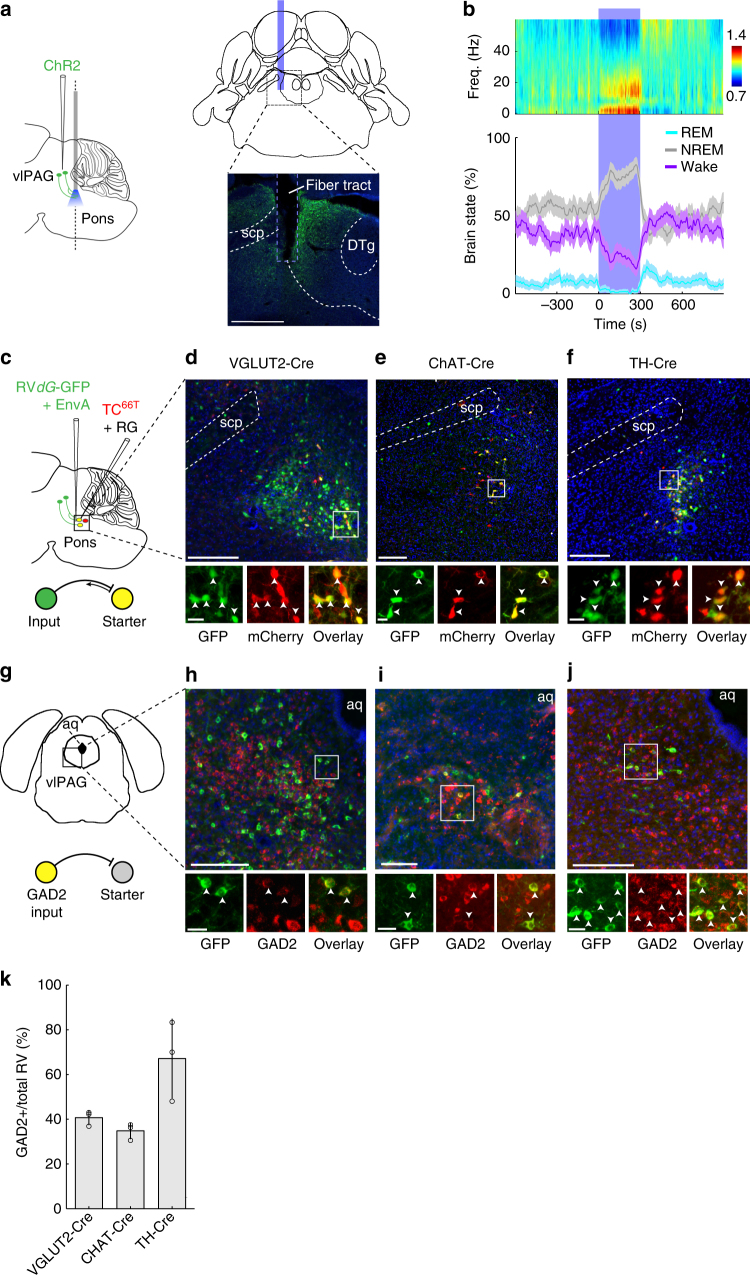
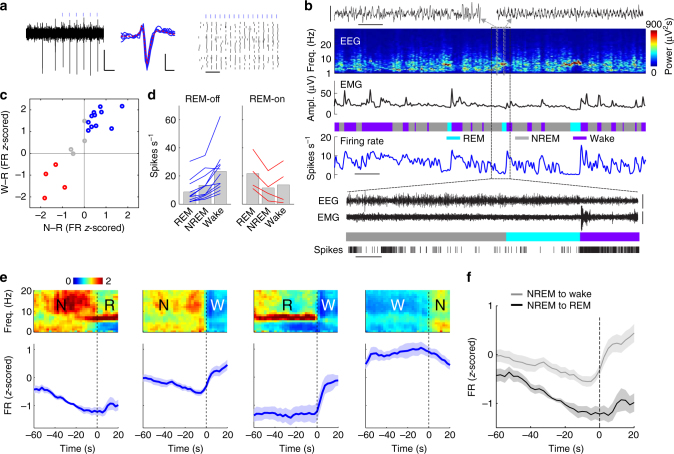
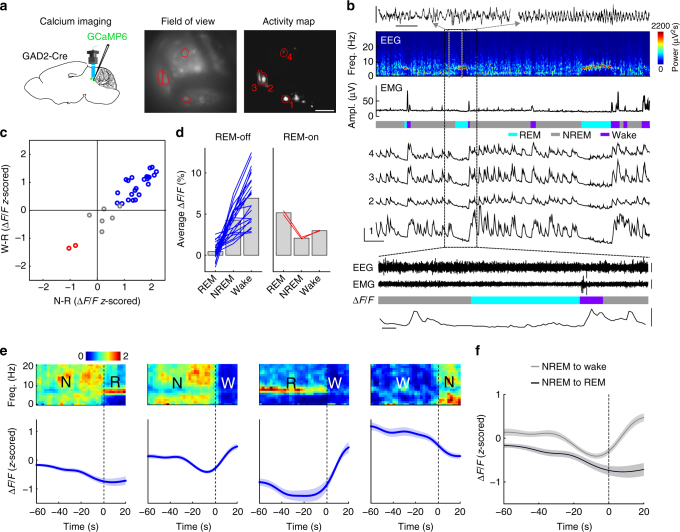
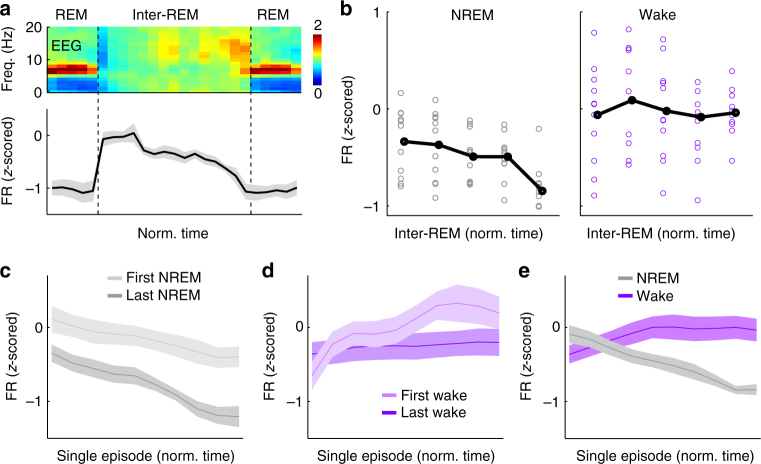
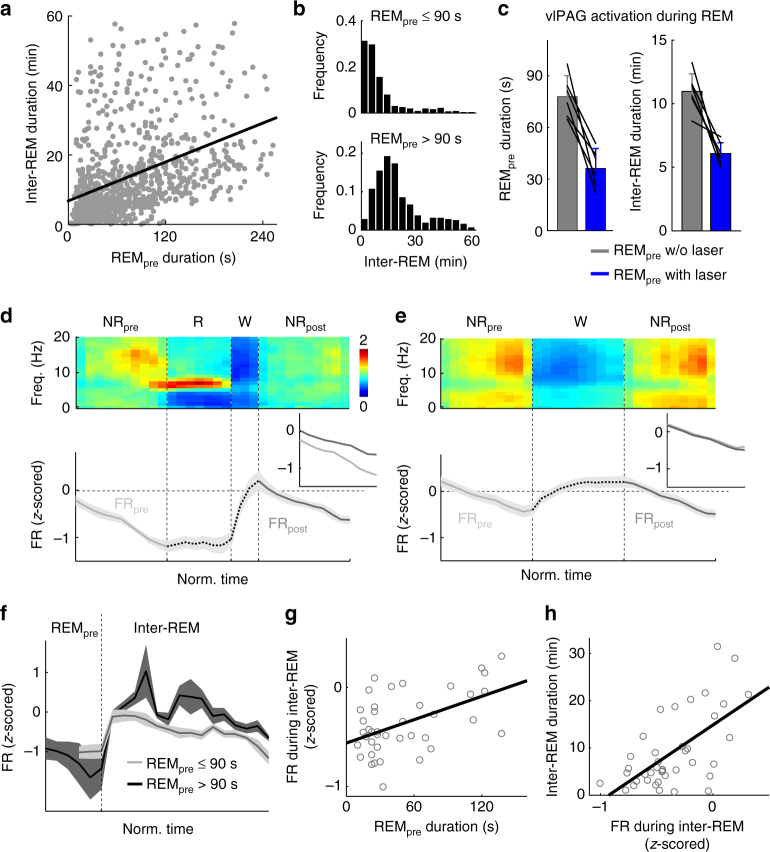
Mammalian sleep consists of distinct rapid eye movement (REM) and non-REM (NREM) states. The midbrain region ventrolateral periaqueductal gray (vlPAG) is known to be important for gating REM sleep, but the underlying neuronal mechanism is not well understood. Here, we show that activating vlPAG GABAergic neurons in mice suppresses the initiation and maintenance of REM sleep while consolidating NREM sleep, partly through their projection to the dorsolateral pons. Cell-type-specific recording and calcium imaging reveal that most vlPAG GABAergic neurons are strongly suppressed at REM sleep onset and activated at its termination. In addition to the rapid changes at brain state transitions, their activity decreases gradually between REM sleep and is reset by each REM episode in a duration-dependent manner, mirroring the accumulation and dissipation of REM sleep pressure. Thus, vlPAG GABAergic neurons powerfully gate REM sleep, and their firing rate modulation may contribute to the ultradian rhythm of REM/NREM alternation.


Conflict of interest statement

The authors declare no competing financial interests.

Figures

Fig. 1
Fig. 1
Optogenetic activation of vlPAG GABAergic neurons suppresses REM sleep and wakefulness while enhancing NREM sleep. a Schematic of optogenetic experiment. Top, coronal diagram of mouse brain; bottom, fluorescence image of PAG in a GAD2-Cre mouse injected with AAV expressing ChR2–eYFP (green). Blue, 4ʹ,6-diamidino-2-phenylindole (DAPI). Scale bar, 500 μm. Brain figure adapted from Allen Mouse Brain Atlas (© 2015 Allen Institute for Brain Science. Allen Brain Atlas API. Available from: http://brain-map.org/api/index.html). b Example experiment. Shown are EEG power spectrogram (scale bar, 300 s), electromyogram (EMG) amplitude, brain states, and EEG, EMG raw traces on an expanded timescale during the selected time periods (black boxes; scale bars, 1 s and 0.5 mV). Blue shading, laser stimulation period (20 Hz, 300 s). c Average EEG spectrogram (top, normalized by the mean power in each frequency band) and the percentage of wake, NREM, or REM states (bottom) before, during, and after laser stimulation (n = 12 mice). Laser stimulation increased NREM sleep (P < 0.0001, bootstrap) and decreased wakefulness (P < 0.0001) and REM sleep (P < 0.0001). Shading, 95% confidence intervals (CI). Blue stripe, laser stimulation period (20 Hz, 300 s). d Effect of laser stimulation on transition probability between each pair of brain states. Bars, transition probabilities within each 20 s period. Error bar, 95% CI (bootstrap). Red line and shading, baseline and 95% CI. N NREM, R REM, W wake. e Diagram summarizing transition probabilities that are significantly increased (magenta) or decreased (cyan) by laser stimulation. f Cumulative probability of transition between each pair of brain states within 120 s after the initiation of each brain state with or without laser stimulation. Laser stimulation caused a decrease in NREM→REM (P < 0.001, bootstrap) and NREM→wake (P < 0.001) transitions, increase in REM→wake transition (P < 0.001), and only minor increase in wake→NREM transition (P = 0.028). Shading, 95% CI. g Mean REM and NREM episode duration for episodes overlapping or non-overlapping with laser (n = 12 mice). Lines, single mice. *P < 0.05, Wilcoxon signed-rank test. Error bar, ±s.d. (h) Percentage of NREM episodes followed by REM, in episodes overlapping or not overlapping with laser. *P < 0.05, **P < 0.01, Wilcoxon singed-rank test. Error bar ±s.d.
Fig. 2
Fig. 2
Inhibition of dorsolateral pons by vlPAG GABAergic projection suppresses REM sleep and wakefulness while promoting NREM sleep. a Left, schematic depicting ChR2-mediated activation of GABAergic axons projecting from vlPAG to the dorsolateral pons. Right, coronal diagram of mouse brain (top) and fluorescence image (bottom) of dorsolateral pons (black box in diagram) in a GAD2-Cre mouse injected with AAV expressing ChR2–eYFP (green) into the vlPAG. Blue bar, optic fiber. Blue, DAPI. Scale bar, 500 μm. DTg dorsal tegmental nucleus, scp superior cerebellar peduncle. b Top, normalized EEG spectrogram. Bottom, percentage of REM, NREM, or wake states before, during, and after laser stimulation of GABAergic axons (n = 5). Shading, 95% CI. c Schematic showing rabies-mediated trans-synaptic tracing. TC66T mutant EnvA receptor fused with mCherry, RG rabies glycoprotein, RVdG RG-deleted rabies virus. d Top, fluorescence image of SLD in VGLUT2-Cre mouse. Scale bar, 200 μm. Bottom, enlarged view of white box showing starter cells (yellow, arrowheads), expressing both eGFP and mCherry. Scale bar, 20 μm. e Top, fluorescence image of LDT in ChAT-Cre mouse. Scale bar, 200 μm. Bottom, enlarged view of white box showing starter cells (yellow, arrowheads). Scale bar, 20 μm. f Top, fluorescence image of LC in TH-Cre mouse. Scale bar, 200 μm. Bottom, enlarged view of white box showing starter cells (yellow, arrowheads). Scale bar, 20 μm. g Coronal diagram of mouse brain. Aq aqueduct. h vlPAG GABAergic (GAD2) neurons innervating glutamatergic (VGLUT2) SLD neurons. Top, fluorescence image showing rabies-eGFP-labeled (green) and GAD2-positive neurons in vlPAG (n = 3 mice). Red, GAD2. Blue, DAPI. Scale bar, 200 μm. Bottom, enlarged view of white box showing eGFP-labeled neurons expressing GAD2 (arrowheads). Scale bar, 30 μm. i Similar to h, for vlPAG GABAergic neurons innervating cholinergic (ChAT) LDT neurons (n = 3). j Similar to h, for vlPAG GABAergic neurons innervating noradrenergic (TH) LC neurons (n = 3). k Percentages of rabies-eGFP-labeled neurons in vlPAG innervating glutamatergic SLD neurons, cholinergic LDT neurons, and noradrenergic LC neurons (n = 3). Circles, single mice; error bars, ±s.d. Brain figures in a, c, g were adapted from Allen Mouse Brain Atlas (© 2015 Allen Institute for Brain Science. Allen Brain Atlas API. Available from: http://brain-map.org/api/index.html)
Fig. 3
Fig. 3
Firing rates of identified vlPAG GABAergic neurons across brain states. a Example unit. Left, raw trace showing spontaneous and laser-evoked spikes. Blue ticks, laser pulses (15 Hz). Scale bars, 100 ms, 0.5 mV. Middle, comparison between laser-evoked (blue) and averaged spontaneous (red) spike waveforms from this unit. Scale bars, 0.2 ms, 0.5 mV. Right, Spike raster showing multiple trials of laser stimulation at 30 Hz. Scale bar, 100 ms. b Firing rates of an example vlPAG GABAergic neuron (blue) along with EEG spectrogram, EMG amplitude, and color-coded brain state (scale bar, 120 s). Two example EEG raw traces (indicated by gray boxes) are shown on top of the EEG spectrogram (scale bars, 1 s, 0.5 mV). The timing of single spikes (vertical ticks) is depicted on an expanded timescale (indicated by black box) along with EEG, EMG raw traces (scale bars, 10 s, 0.5 mV). c Firing rate modulation of 19 identified units from 6 mice. W wake, R REM, N NREM. Blue, significant REM-off neurons (P < 0.05, Wilcoxon rank-sum test, post-hoc Bonferroni correction); red, significant REM-on neurons; gray, other neurons. d Firing rates of significant REM-off (left) and REM-on (red) neurons during different brain states. Each line shows firing rates of one unit; gray bar, average across units. e Average EEG spectrogram (upper, normalized by the mean power in each frequency band) and mean firing rate (z-scored) of significant REM-off neurons (lower) at brain state transitions. Shading, ±s.e.m. f Firing rates during NREM episodes preceding wake were significantly higher than those preceding REM episodes (P = 0.0001, T(8) = −7.03, paired t-test)
Fig. 4
Fig. 4
Sleep–wake activity of vlPAG GABAergic neurons measured with calcium imaging. a Left, schematic of calcium imaging through GRIN lens. Middle, field of view of an example imaging session. Right, pixel-wise activity map of an example imaging session. Red line, four example ROIs. Scale bar, 100 µm. Brain figure adapted from Allen Mouse Brain Atlas (© 2015 Allen Institute for Brain Science. Allen Brain Atlas API. Available from: http://brain-map.org/api/index.html). b EEG power spectrogram, EMG trace, color-coded brain state, and ∆F/F traces of the ROIs outlined in a (scale bars, 120 s, 20 % ∆F/F). Two example EEG raw traces (indicated by gray boxes) are shown on top of the EEG spectrogram (scale bars, 1 s, 0.3 mV). The black box indicates a region in which raw EEG, EMG (scale bars, 0.5 mV) and the fluorescence signal of ROI 2 are shown on an expanded timescale (scale bars, 10 s, 20 % ∆F/F). c Activity modulation of 31 ROIs from 3 mice. W wake, R REM, N NREM. Blue, significant REM-off ROIs (P < 0.05, Wilcoxon rank-sum test, post-hoc Bonferroni correction); red, significant REM-on ROIs; gray, other neurons. d Calcium activity of significant REM-off (left) and REM-on (red) ROIs during different brain states. Each line shows activity of one ROI; gray bar, average across ROIs. e Average EEG spectrogram (upper, normalized by the mean power in each frequency band) and mean calcium activity (∆F/F, z-scored) of significant REM-off ROIs (lower) at brain state transitions (n = 23). Shading, ± s.e.m. f The mean calcium activity during NREM episodes preceding wake was significantly higher than those preceding REM episodes (P = 0.003, T(22) = −3.24, paired t-test)
Fig. 5
Fig. 5
Slow modulation of vlPAG GABAergic neuron activity during inter-REM interval. a Average normalized EEG spectrogram (upper) and mean firing rate (z-scored) of significant REM-off vlPAG GABAergic neurons (lower) during two successive REM episodes and the inter-REM interval. Each REM episode and inter-REM interval was temporally compressed to unit length before the firing rates were averaged over multiple episodes/intervals and across GABAergic REM-off neurons (n = 11). Shading, ±s.e.m. b Firing rate (FR, z-scored) during NREM (left) and wake (right) episodes within different segments of the inter-REM interval. Each inter-REM interval was divided into five equally sized bins, and NREM or wake firing rates were averaged within each bin. Each symbol represents the average NREM or wake firing rate of a unit. The average NREM firing rate decreased during the inter-REM period (R = −0.48, P = 2.5 × 10−4, T(53) = −3.93, linear regression), while the wake activity showed no significant trend (R = −0.04, P = 0.76, T(52) = −0.29). Black line, average firing rate of each bin. c Mean firing rates during the first (light gray) and last (dark gray) NREM episodes of each inter-REM interval. Each NREM episode was temporally compressed to unit duration before the z-scored firing rate was averaged over episodes and across cells. The firing rate during the first NREM period was significantly higher than during the last period (n = 11 units, P = 0.008, T(10) = 3.28, paired t-test). Shading, ±s.e.m. d Mean firing rates during the first (light purple) and last (dark purple) wake episodes of each inter-REM interval. Each wake episode was temporally compressed to unit duration before averaging. e Mean firing rates during all NREM (gray) and wake (purple) episodes. Note that the firing rate decreased during NREM (R = −0.65, P = 2.8 × 10−14, T(108) = −8.78) but increased during wake episodes (R = 0.21, P = 0.027, T(108) = 2.24)
Fig. 6
Fig. 6
Homeostatic modulation of REM sleep and REM-off neuron activity. a Correlation between REM episode duration and subsequent inter-REM interval. Each dot represents a single episode (n = 972 episodes from 27 mice). Line, linear fit (R = 0.39, P = 6.8 × 10−36, T(970) = 13.03). b Distribution of inter-REM interval following short (≤90 s) and long (>90 s) REM episodes. The two distributions are significantly different (P = 2.8 × 10−48, z = −14.60, Wilcoxon rank-sum test). c Effect of closed-loop activation of vlPAG GABAergic neurons on REM sleep duration and subsequent inter-REM interval. Closed-loop stimulation shortened both REM episodes (n = 6 mice, P = 0.002, T(5) = 5.88, paired t-test) and subsequent inter-REM intervals (P = 0.003, T(5) = −5.29). Lines, single mice. Error bar, ±s.d. d Average EEG spectrogram (upper) and mean firing rate (z-scored) of significant REM-off vlPAG GABAergic neurons (lower) during the NREM→REM→wake→NREM transition sequence. Each REM, wake, or NREM episode was temporally normalized. Shading, ±s.e.m. Inset, comparison of firing rates during the NREM episodes preceding (NRpre) and following REM sleep (NRpost). The firing rate during NRpost was higher than that during NRpre (n = 11 units; P = 0.006, T(10) = −3.43, paired t-test). e Similar to d, but for the NREM→wake→NREM sequence. Without the intervening REM episode, the firing rates were similar between NRpre and NRpost (P = 0.42, T(10) = 0.84). f Comparison of vlPAG activity during inter-REM interval following short (≤90 s) and long (>90 s) REM episodes. Following a long REM period, the firing rate was significantly higher than following a short one (P = 0.03, T(3) = −3.78, paired t-test). Shading, ±s.e.m. g Correlation between REM episode duration and vlPAG firing rate during the subsequent inter-REM interval. Each dot represents activity of a unit during a single inter-REM interval (n = 40). Line, linear fit (R = 0.50, P = 0.001, T(38) = 3.58). h Correlation between vlPAG firing rate during inter-REM interval and duration of the interval. Line, linear fit (R = 0.63, P = 1.6 × 10−5, T(38) = 4.95)

Similar articles

Cited by

References

    1. Scammell TE, Arrigoni E, Lipton JO. Neural circuitry of wakefulness and sleep. Neuron. 2017;93:747–765. doi: 10.1016/j.neuron.2017.01.014. - DOI - PMC - PubMed
    1. Weber F, Dan Y. Circuit-based interrogation of sleep control. Nature. 2016;538:51–59. doi: 10.1038/nature19773. - DOI - PubMed
    1. Zepelin, H., Siegel, J. M. & Tobler, I. in Principles and Practice of Sleep Medicine (eds Kryger, M. H., Roth, T. & Dement, W. C.) Ch. 8 (Elsevier Saunders, Philadelphia, USA, 2005).
    1. Sastre J, Buda C, Kitahama K, Jouvet M. Importance of the ventrolateral region of the periaqueductal gray and adjacent tegmentum in the control of paradoxical sleep as studied by muscimol microinjections in the cat. Neuroscience. 1996;74:415–426. doi: 10.1016/0306-4522(96)00190-X. - DOI - PubMed
    1. Vanini G, Torterolo P, McGregor R, Chase M, Morales F. GABAergic processes in the mesencephalic tegmentum modulate the occurrence of active (rapid eye movement) sleep in guinea pigs. Neuroscience. 2007;145:1157–1167. doi: 10.1016/j.neuroscience.2006.12.051. - DOI - PubMed

Publication types