

Single-cell variability in multicellular organisms
- PMID: 29367605
- PMCID: PMC5783944
- DOI: 10.1038/s41467-017-02710-x
Single-cell variability in multicellular organisms
Abstract
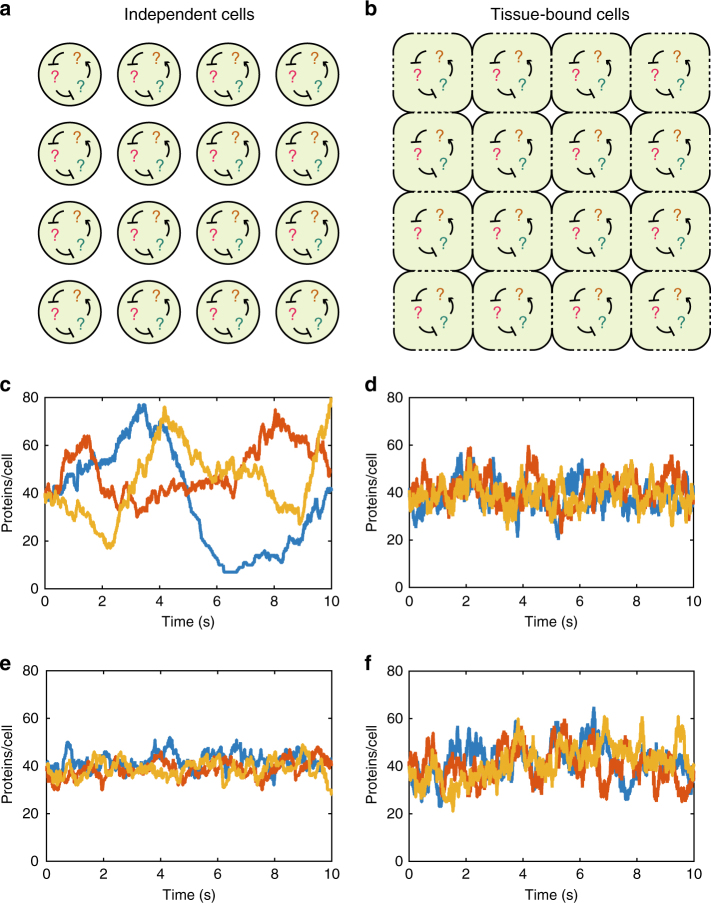
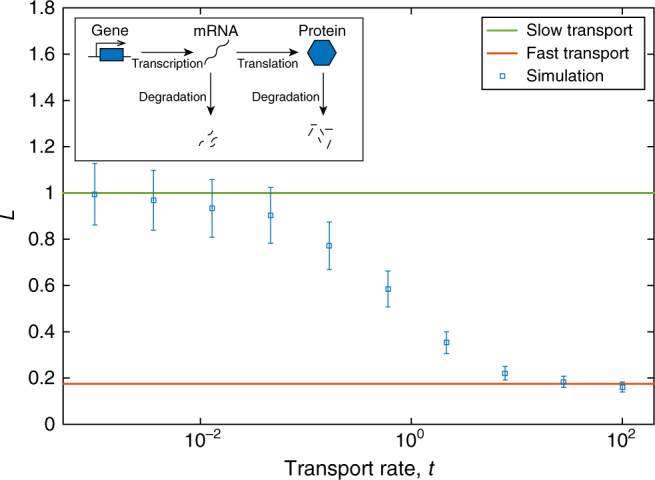
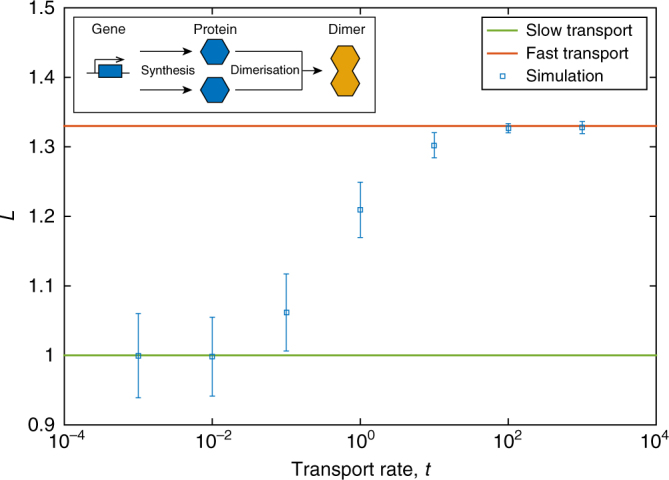
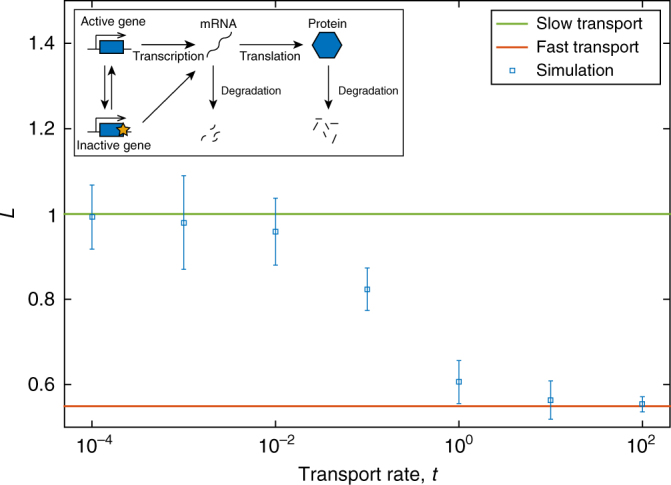
Noisy gene expression is of fundamental importance to single cells, and is therefore widely studied in single-celled organisms. Extending these studies to multicellular organisms is challenging since their cells are generally not isolated, but individuals in a tissue. Cell-cell coupling via signalling, active transport or pure diffusion, ensures that tissue-bound cells are neither fully independent of each other, nor an entirely homogeneous population. In this article, we show that increasing the strength of coupling between cells can either increase or decrease the single-cell variability (and, therefore, the heterogeneity of the tissue), depending on the statistical properties of the underlying genetic network. We confirm these predictions using spatial stochastic simulations of simple genetic networks, and experimental data from animal and plant tissues. The results suggest that cell-cell coupling may be one of several noise-control strategies employed by multicellular organisms, and highlight the need for a deeper understanding of multicellular behaviour.
Conflict of interest statement
The authors declare no competing financial interests.
Figures


Similar articles
-
Living with noisy genes: how cells function reliably with inherent variability in gene expression.Annu Rev Biophys Biomol Struct. 2007;36:413-34. doi: 10.1146/annurev.biophys.36.040306.132705. Annu Rev Biophys Biomol Struct. 2007. PMID: 17477840 Review.
-
Communication theory and multicellular biology.Integr Biol (Camb). 2011 Apr;3(4):350-67. doi: 10.1039/c0ib00117a. Epub 2011 Mar 22. Integr Biol (Camb). 2011. PMID: 21424025
-
A synthetic multicellular system for programmed pattern formation.Nature. 2005 Apr 28;434(7037):1130-4. doi: 10.1038/nature03461. Nature. 2005. PMID: 15858574
-
Cell-cell bioelectrical interactions and local heterogeneities in genetic networks: a model for the stabilization of single-cell states and multicellular oscillations.Phys Chem Chem Phys. 2018 Apr 4;20(14):9343-9354. doi: 10.1039/C8CP00648B. Phys Chem Chem Phys. 2018. PMID: 29564429
-
Plasmodesmata as a supracellular control network in plants.Nat Rev Mol Cell Biol. 2004 Sep;5(9):712-26. doi: 10.1038/nrm1470. Nat Rev Mol Cell Biol. 2004. PMID: 15340379 Review.
Cited by
-
Plant 3D genomics: the exploration and application of chromatin organization.New Phytol. 2021 Jun;230(5):1772-1786. doi: 10.1111/nph.17262. Epub 2021 Mar 4. New Phytol. 2021. PMID: 33560539 Free PMC article. Review.
-
Identifiability analysis for stochastic differential equation models in systems biology.J R Soc Interface. 2020 Dec;17(173):20200652. doi: 10.1098/rsif.2020.0652. Epub 2020 Dec 16. J R Soc Interface. 2020. PMID: 33323054 Free PMC article.
-
Recent Advances and New Perspectives in Capillary Electrophoresis-Mass Spectrometry for Single Cell "Omics".Molecules. 2018 Dec 22;24(1):42. doi: 10.3390/molecules24010042. Molecules. 2018. PMID: 30583525 Free PMC article. Review.
-
An Hfq-dependent post-transcriptional mechanism fine tunes RecB expression in Escherichia coli.Elife. 2025 Aug 12;13:RP94918. doi: 10.7554/eLife.94918. Elife. 2025. PMID: 40794102 Free PMC article.
-
Inferring delays in partially observed gene regulation processes.Bioinformatics. 2023 Nov 1;39(11):btad670. doi: 10.1093/bioinformatics/btad670. Bioinformatics. 2023. PMID: 37935426 Free PMC article.
References
Publication types
MeSH terms
Substances
LinkOut - more resources
Full Text Sources
Other Literature Sources
