. 2018 Jan 24;8(1):1520.
doi: 10.1038/s41598-018-19476-x.

IL-36/LXR axis modulates cholesterol metabolism and immune defense to Mycobacterium tuberculosis

Affiliations

IL-36/LXR axis modulates cholesterol metabolism and immune defense to Mycobacterium tuberculosis

Fadhil Ahsan et al. Sci Rep. .

Abstract

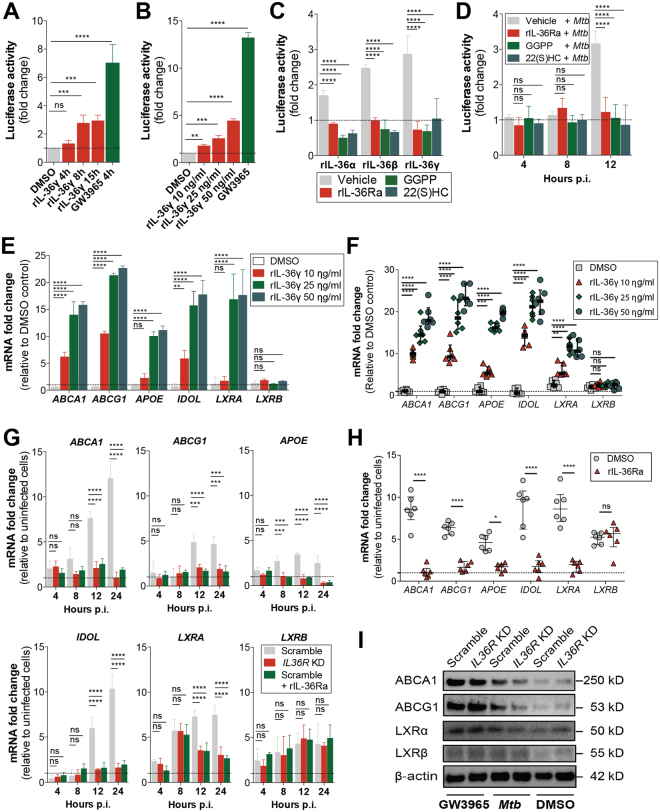
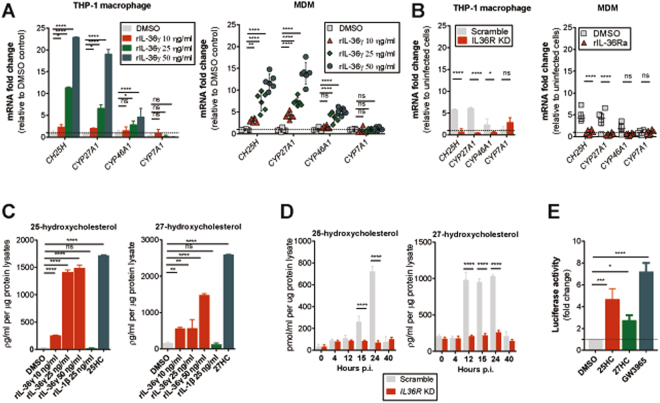
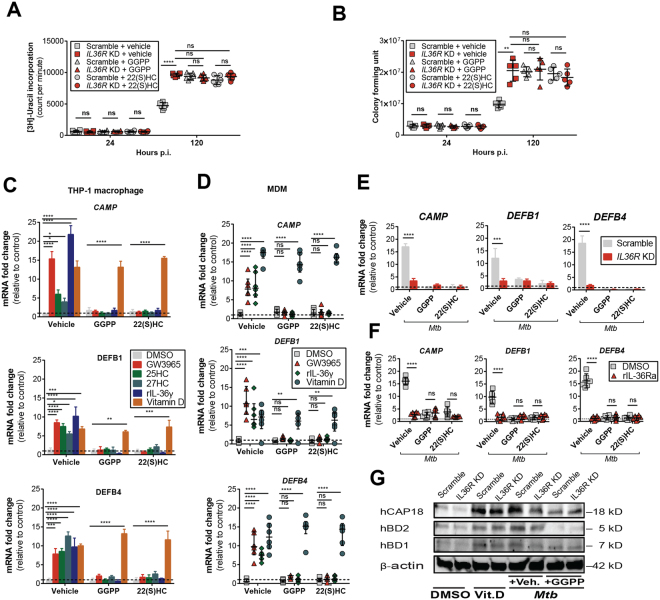
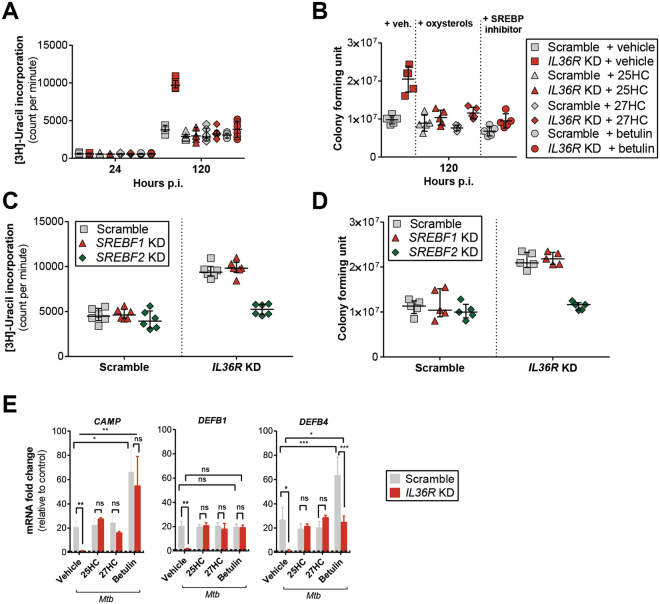
Mycobacterium tuberculosis (Mtb) is a life-threatening pathogen in humans. Bacterial infection of macrophages usually triggers strong innate immune mechanisms, including IL-1 cytokine secretion. The newer member of the IL-1 family, IL-36, was recently shown to be involved in cellular defense against Mtb. To unveil the underlying mechanism of IL-36 induced antibacterial activity, we analyzed its role in the regulation of cholesterol metabolism, together with the involvement of Liver X Receptor (LXR) in this process. We report that, in Mtb-infected macrophages, IL-36 signaling modulates cholesterol biosynthesis and efflux via LXR. Moreover, IL-36 induces the expression of cholesterol-converting enzymes and the accumulation of LXR ligands, such as oxysterols. Ultimately, both IL-36 and LXR signaling play a role in the regulation of antimicrobial peptides expression and in Mtb growth restriction. These data provide novel evidence for the importance of IL-36 and cholesterol metabolism mediated by LXR in cellular host defense against Mtb.


Conflict of interest statement

The authors declare that they have no competing interests.

Figures

Figure 1
Figure 1
IL-36 signaling is required for LXR activation upon Mtb infection in human macrophages. (AD) LXR luciferase reporter activity in THP-1 macrophages stimulated with (A) rIL-36γ (25 ng/ml), (B) increasing concentrations of rIL-36γ at 8 h, (C) all IL-36 variants (at 25 ng/ml for 8 h) and (D) Mtb infection at the specified time points after pre-incubation with vehicle, rIL-36Ra (100 ng/ml, 3 h), GGPP (25 μM, 15 h) and 22(S)HC (10 μM, 3 h). (E,F,G and H) Induction of gene expression of LXR target genes and receptors in THP-1 macrophages (E) and MDMs (F) stimulated with rIL-36γ for 8 h and upon Mtb infection with or without blocking IL-36 signaling (G and H). (I) Immunoblot of ABCA1, ABCG1, LXRα and LXRβ protein levels from Mtb-infected scramble and IL36R KD macrophages at 24 h p.i. GW3965 (500 nM) was used as positive control. (AE,G) Data pooled from three independent experiments are shown. Data are shown as mean ± SD. (F and H) Data from one representative experiment out of three independent experiments are shown. Data are shown as median ± interquartile range, with each dot of MDM representing one human donor. (I) Data from one representative experiment of two independent experiments are shown. P values shown as ns p > 0.05; *p ≤ 0.05; **p ≤ 0.01; ***p ≤ 0.001; ****p ≤ 0.0001.
Figure 2
Figure 2
rIL-36γ drives expression of cholesterol-converting enzymes and endogenous LXR ligands. (A and B) mRNA expression of CH25H, CYP27A1, CYP46A1 and CYP7A1 in (A) THP-1 macrophages and MDM upon 4 h of stimulation with various doses of rIL-36γ and (B) 12 h Mtb-infection with or without blocking IL-36R signaling. (C and D) Concentrations of intracellular 25HC or 27HC in cell lysates of THP-1 macrophages (C) upon stimulation with rIL-36γ or rIL-1β or (D) after Mtb infection. (E) LXR luciferase activity in THP-1 macrophages treated with DMSO or 500 nM of 25HC, 27HC or GW3965 for 8 h. (A–E) Data from THP-1 macrophages are pooled from three independent experiments and shown as mean ± SD. MDM data are from one representative experiment of three independent experiments, median ± interquartile range is shown and each dot of MDM represents one donor. P values shown as ns p > 0.05; *p ≤ 0.05; **p ≤ 0.01; ***p ≤ 0.001; ****p ≤ 0.0001.
Figure 3
Figure 3
IL-36-induced LXR activation inhibits Mtb growth in macrophages. Bacterial growth in IL36R KD cells assessed by [3 H]-uracil uptake (A) and colony forming units (B) after pre-treatment with vehicle, GGPP or 22(S)HC. (C and D) APs mRNA expression in (C) THP-1 macrophages and (D) MDMs upon stimulation with the indicated compounds, (E) upon 24 h Mtb infection in IL-36 signaling blocked THP-1 macrophages and (F) MDM. (G) Intracellular protein levels of hCAP18 (cathelicidin), hBD2 (β-defensin 2) and hBD1 (β-defensin 1) upon 30 h Mtb infection of scramble or IL36R KD THP-1 macrophages with or without LXR inhibitor. Vitamin D and beta actin were used as positive control for AP induction and protein loading control, respectively. (A,B,D and F) Data from one representative experiment of at least three independent experiments are shown. Each dot of MDM represents one donor. MDM and bacterial counts are shown as median ± interquartile range. (C and E) Data pooled from three independent experiments are shown and represented as mean ± SD. (G) Data representative of one experiment of two independent experiments are shown. P values shown as ns p > 0.05; *p ≤ 0.05; **p ≤ 0.01; ***p ≤ 0.001; ****p ≤ 0.0001.
Figure 4
Figure 4
Deficient IL-36/LXR axis in macrophages allows Mtb growth. (AC) LXR luciferase activity of scramble versus IL36R-, LXRA-, LXRB-, CH25H-, CYP27A1-deficient macrophages after 8 h cell stimulation with (A) 500 nM of GW3965, 25HC, or 27HC, (B) 25 ng/ml rIL-36γ or (C) after 15 h Mtb infection. (D and E) Bacterial growth assessed by [3 H]-uracil incorporation (D) and CFUs (E) in IL-36 signaling deficient dual knockdown macrophages. (A–C) Data from one representative experiment of two independent experiments are shown. Data are shown as mean ± SD of technical replicates. (D and E) Bacterial growth results are representative of one experiment of two independent experiments with at least five replicates each. Data are shown as median ± interquartile range.
Figure 5
Figure 5
IL-36 signaling modulates cholesterol metabolism in Mtb-infected macrophage. (A) Changes in total cholesterol, free cholesterol and cholesteryl ester in cell lysates from scramble and IL36R KD THP-1 macrophages upon Mtb infection. (B) Immunofluorescence staining with Filipin III in non-infected (N/I), 24 h and 48 h Mtb-infected scramble versus IL36R KD THP-1 macrophages (40× objective magnification). (C) mRNA expression of CD36, LDLR, SRA in Mtb-infected scramble versus IL36R KD cells. (D) Cholesterol efflux upon Mtb infection or LXR stimulation in scramble versus IL36R KD THP-1 macrophages with or without LXR inhibitors. (E) SREBP2 protein expression in Mtb-infected scramble and IL-36 deficient cells. (F) mRNA expression of several cholesterol synthesis genes in Mtb-infected macrophages at 30 h with or without 27HC, 25HC and betulin stimulation. (A,C,D,F) Data pooled from three independent experiments are shown. Data are shown as mean ± SD. (B and E) Data from one representative experiment of at least two independent experiments are shown. P values: ns p > 0.05; *p ≤ 0.05; **p ≤ 0.01; ***p ≤ 0.001; ****p ≤ 0.0001.
Figure 6
Figure 6
Oxysterols and inhibition of SREBP2 exhibit antibacterial effects. Quantification of (A) [3 H]-uracil uptake and (B) colony forming units (CFUs) of Mtb-infected scramble versus IL36R KD macrophages with simultaneous incubation of vehicle, 25HC, 27HC or betulin. (C and D) Bacterial viability in scramble, SREBF1 KD and SREBF2 KD macrophages at 120 h Mtb infection assessed by (C) [3 H]-uracil uptake assay and (D) CFU counts (E) mRNA expression levels of APs 24 h post Mtb infection of scramble and IL36R KD THP-1 macrophages, in the presence or absence of 25HC, 27HC or betulin. (A and B) Data from one representative experiment of three independent experiments are shown. (C and D) Data from one representative experiment of two independent experiments are shown, with at least five replicates each are shown. (E) Data pooled from three independent experiments are shown and presented as mean ± SD. P values: ns p > 0.05; *p ≤ 0.05; **p ≤ 0.01; ***p ≤ 0.001.

Similar articles

Cited by

References

    1. WHO. Global tuberculosis report. (World Health Organization, Geneva, Switzerland, 2017).
    1. Ernst, J. D. The immunological life cycle of tuberculosis. Nature reviews Immunology12, 581–591, 10.1038/nri3259 (2012). - PubMed
    1. Dorhoi, A. & Kaufmann, S. H. Pathology and immune reactivity: understanding multidimensionality in pulmonary tuberculosis. Seminars in immunopathology, 10.1007/s00281-015-0531-3 (2015). - PubMed
    1. Mayer-Barber KD, Sher A. Cytokine and lipid mediator networks in tuberculosis. Immunological reviews. 2015;264:264–275. doi: 10.1111/imr.12249. - DOI - PMC - PubMed
    1. Etna MP, Giacomini E, Severa M, Coccia EM. Pro- and anti-inflammatory cytokines in tuberculosis: a two-edged sword in TB pathogenesis. Seminars in immunology. 2014;26:543–551. doi: 10.1016/j.smim.2014.09.011. - DOI - PubMed

Publication types