. 2018 Jan 24;9(1):346.
doi: 10.1038/s41467-017-02681-z.

Diversity of meso-scale architecture in human and non-human connectomes

Affiliations

Diversity of meso-scale architecture in human and non-human connectomes

Richard F Betzel et al. Nat Commun. .

Abstract

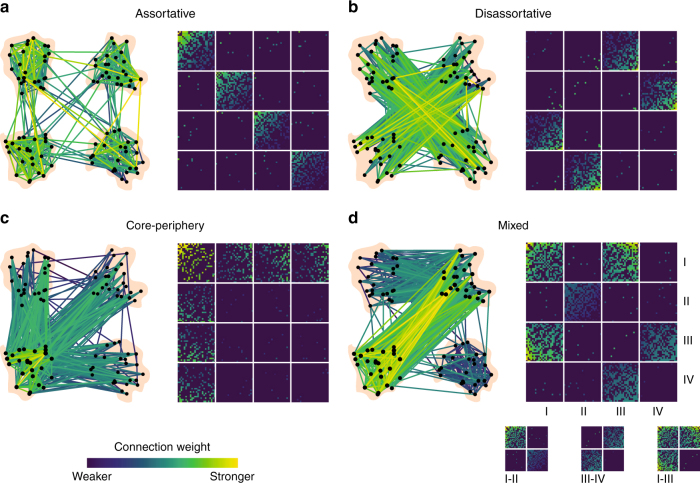
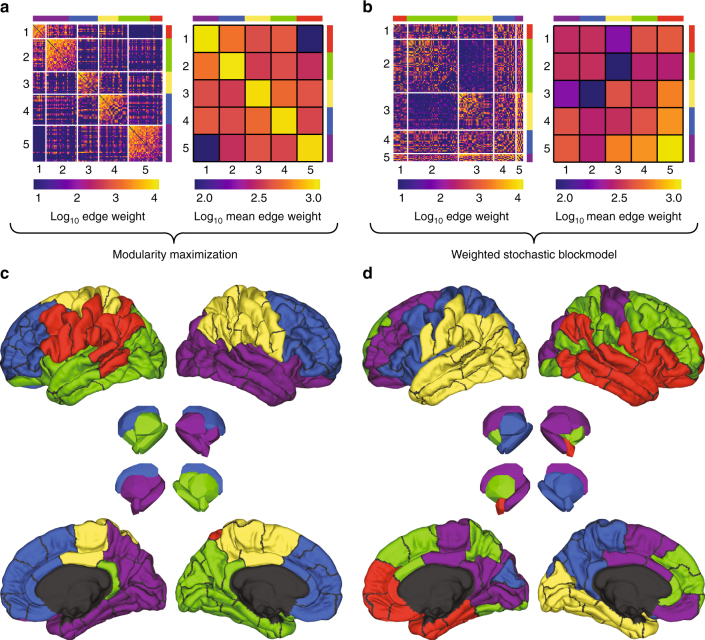
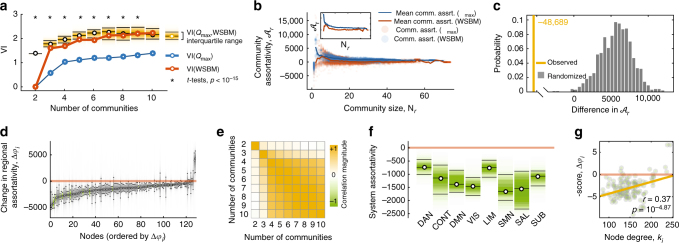
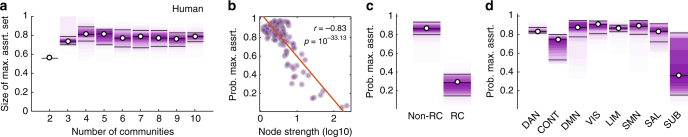
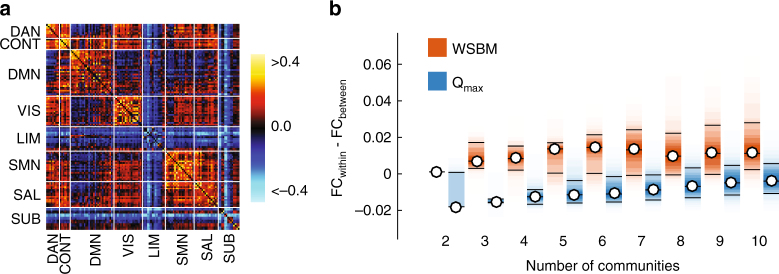
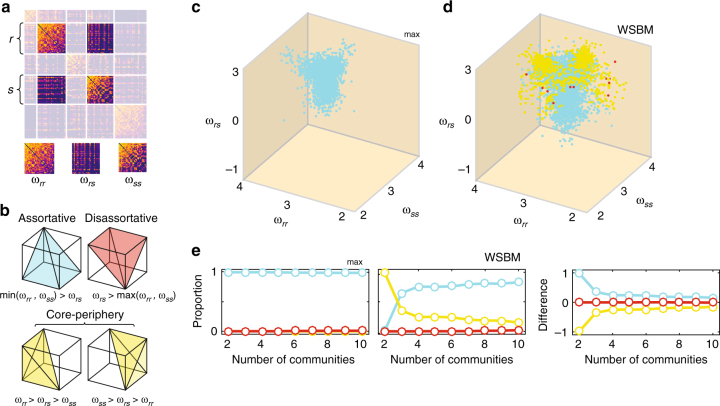
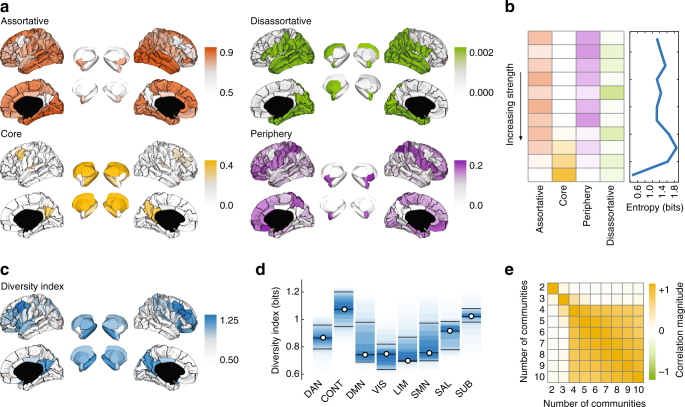
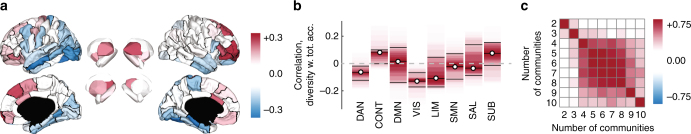
Brain function is reflected in connectome community structure. The dominant view is that communities are assortative and segregated from one another, supporting specialized information processing. However, this view precludes the possibility of non-assortative communities whose complex inter-community interactions could engender a richer functional repertoire. We use weighted stochastic blockmodels to uncover the meso-scale architecture of Drosophila, mouse, rat, macaque, and human connectomes. We find that most communities are assortative, though others form core-periphery and disassortative structures, which better recapitulate observed patterns of functional connectivity and gene co-expression in human and mouse connectomes compared to standard community detection techniques. We define measures for quantifying the diversity of communities in which brain regions participate, showing that this measure is peaked in control and subcortical systems in humans, and that inter-individual differences are correlated with cognitive performance. Our report paints a more diverse portrait of connectome communities and demonstrates their cognitive relevance.


Conflict of interest statement

The authors declare no competing financial interests.

Figures

Fig. 1
Fig. 1
Community structure types. Networks can exhibit different types of meso-scale structure. a Assortative communities are sub-networks whose internal density of connections exceeds their external density. b Disassortative (multi-partite) communities are sub-networks where connections are made preferentially between communities so that communities’ external densities exceed their internal densities. c Core-periphery organization consists of a central core that is connected to the rest of the network and then peripheral nodes that connect to the core but not to one another. d These meso-scale structures can be present simultaneously in the same network. For example, communities I–II interact assortatively, III–IV interact disassortatively, while I–III interact as a core and periphery
Fig. 2
Fig. 2
Example WSBM and Qmax communities. Human connectome network ordered by community partitions detected using a Qmax and b the WSBM. Both examples are shown with the number of communities fixed at K = 5. The color of matrix elements for the left sub-panels represents log-transformed edge weights while the color of matrix elements for the right sub-panels represents the log-transformed mean within-community and between-community edge weights. Panels c and d depict the spatial distributions of those same partitions
Fig. 3
Fig. 3
Modularity maximization and the weighted stochastic blockmodel uncover fundamentally different architectural signatures. a Variation of information within and across community detection techniques (Qmax and WSBM) demonstrating greater dissimilarity of partitions between techniques than within techniques. b Community assortativity, A, as a function of community size, N, demonstrating that Qmax communities, on average, are more assortative (the inset shows the mean community assortativity curves as a function of distance). Note: asterisks indicate that both t tests were statistically significant. c Comparison of statistic derived using functional data analysis (yellow line) with that expected in a null distribution. Specifically, we generated a statistic by performing a pointwise subtraction and summation of the curves A¯(N) obtained for the WSBM and Qmax. The value of this statistic quantifies the difference between mean community assortativity across communities of all sizes and is negative when communities detected using Qmax are more assortative than WSBMs. We compared this statistic against a null distribution obtained from a null model wherein we preserved the number and size of communities in a given partition but permute nodes’ assignments uniformly and randomly (1000 repetitions). d Changes in regional assortativity, Δai, when considering WSBM versus Qmax partitions, ordered by greatest to least decrease. Note that the majority of regions decrease assortativity in the partitions estimated from WSBM compared to those estimated from Qmax (i.e., Δϕi < 0). e Correlation of regional assortativity while varying the number of communities from K = 2,…,10. Note the high consistency for K ≥ 4. f Regional assortativity scores grouped by cognitive systems: DAN, dorsal attention; CONT, cognitive control; DMN, default mode; VIS, visual; LIM, limbic; SMN, somatomotor; SAL, salience; SUB, subcortical. The limits of each box represent the interquartile range (25th and 75th percentiles). g Regional assortativity (corrected for degree through standardization procedure) as a function of node degree, ki
Fig. 4
Fig. 4
Maximally assortative set. a Fraction of brain regions comprising the maximally assortative set as a function of the number of communities. b High strength nodes are less likely to participate in the maximally assortative set. c As a consequence, the maximally assortative set is comprised mostly of non-rich club brain regions; RC, rich club. d At the system level, control and subcortical networks are the least likely to participate in the maximally assortative set. DAN, dorsal attention; CONT, cognitive control; DMN, default mode; VIS, visual; LIM, limbic; SMN, somatomotor; SAL, salience; SUB, subcortical
Fig. 5
Fig. 5
Communities estimated from the weighted stochastic block model are more functionally segregated than communities estimated from modularity maximization. a Functional connectivity (FC) matrix ordered by functional system: DAN, dorsal attention; CONT, cognitive control; DMN, default mode; VIS, visual; LIM, limbic; SMN, somatomotor; SAL, salience; SUB, subcortical. Note that the order of nodes shown in this panel does not correspond to partitions generated by either the WSBM or Qmax. b Difference between within-community and between-community FC for the WSBM (orange) and Qmax (blue). Each box plot depicts the variance over partitions detected using either the WSBM or Qmax
Fig. 6
Fig. 6
A rich community morphospace. a A community motif is constructed on the average connection weight over blocks of the connectivity matrix. Here, we show blocks within and between two communities, labeled r and s. b Given within-community and between-community connection densities, it is possible to classify each pair of communities into one of three motifs: assortative, disassortative, or core-periphery. c, d All pairs of communities placed in a network morphospace and colored by their motif type (note: axes are log-scaled). e The relative proportion of each motif type as a function of the number of detected communities, K, for Qmax (left), the WSBM (middle), and their difference (right). Note: The WSBM does, in fact, generate a small fraction of disassortative communities and so points on the red curves in D and E are not equal to zero
Fig. 7
Fig. 7
Regional variation in motif participation highlights diversely connected nodes. a Regional participation in the four community motif types. Note that the scales vary from panel to panel. b Dominance of each motif type as a function of node strength (weighted degree). Note that motif dominance varies with strength; high-strength nodes are predominantly located in the core while low-strength are assortative and predominantly located in the periphery. c Diversity index measuring the entropy across each node’s motif participation. d Diversity index grouped by functional system. e Correlation of regional diversity indices as a function of the number of detected communities, K, demonstrating robustness of results across choice of K
Fig. 8
Fig. 8
Diversity index correlates with individual differences in performance on tasks demanding cognitive control. a Regional correlation coefficients of total accuracy with diversity index on the brain surface (shown with K = 5). Areas in white did not show a significant correlation after FDR correction for multiple comparisons. b Regional correlation coefficients grouped according to functional system: DAN, dorsal attention; CONT, cognitive control; DMN, default mode; VIS, visual; LIM, limbic; SMN, somatomotor; SAL, salience, and SUB, subcortical. c Similarity of regional correlation coefficients as a function of the number of communities, indicating robustness to the choice of K when 4 ≤ K ≤ 10

Similar articles

Cited by

References

    1. Mišić B, Sporns O. From regions to connections and networks: new bridges between brain and behavior. Curr. Opin. Neurobiol. 2016;40:1–7. - PMC - PubMed
    1. Medaglia JD, Lynall M, Bassett DS. Cognitive network neuroscience. J. Cogn. Neurosci. 2015;27:471–1491. doi: 10.1162/jocn_a_00810. - DOI - PMC - PubMed
    1. Sporns O, et al. Organization, development and function of complex brain networks. Trends Cogn. Sci. 2004;8:418–425. doi: 10.1016/j.tics.2004.07.008. - DOI - PubMed
    1. Passingham RE, Stephan KE, Kötter R. The anatomical basis of functional localization in the cortex. Nat. Rev. Neurosci. 2002;3:606–616. doi: 10.1038/nrn893. - DOI - PubMed
    1. Sporns O, Tononi G, Edelman GM. Theoretical neuroanatomy: relating anatomical and functional connectivity in graphs and cortical connection matrices. Cereb. Cortex. 2000;10:127–141. doi: 10.1093/cercor/10.2.127. - DOI - PubMed

Publication types

LinkOut - more resources