. 2018 Jan 24;9(1):357.
doi: 10.1038/s41467-017-02545-6.

Electric fields control the orientation of peptides irreversibly immobilized on radical-functionalized surfaces

Affiliations

Electric fields control the orientation of peptides irreversibly immobilized on radical-functionalized surfaces

Lewis J Martin et al. Nat Commun. .

Abstract

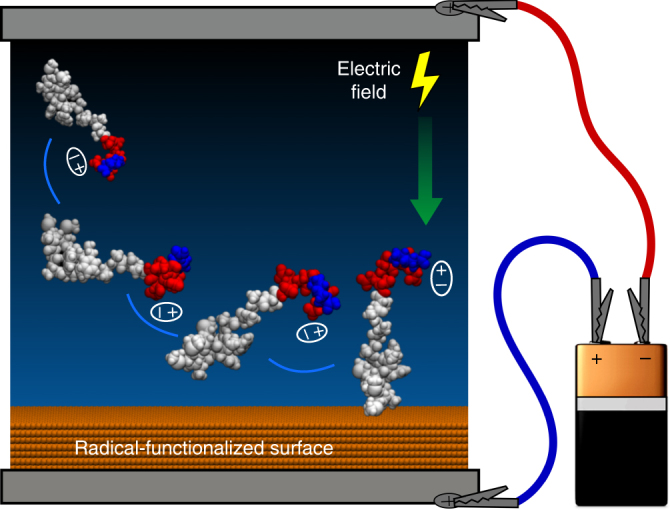
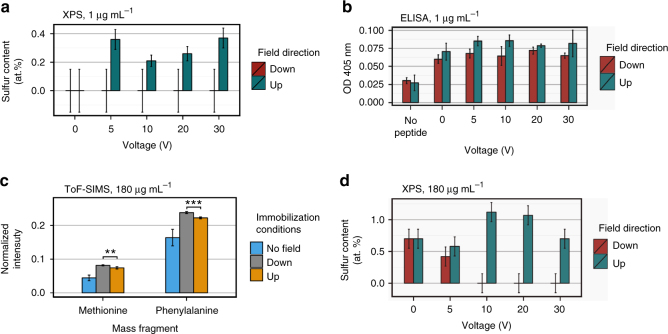
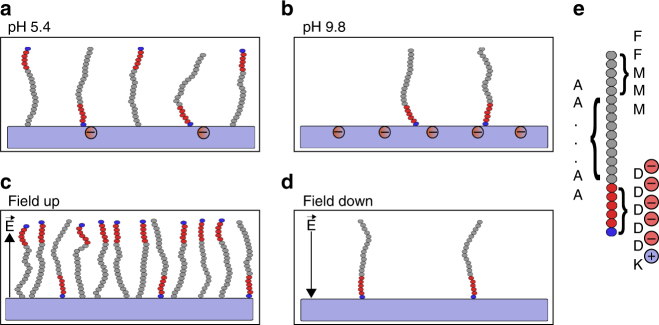
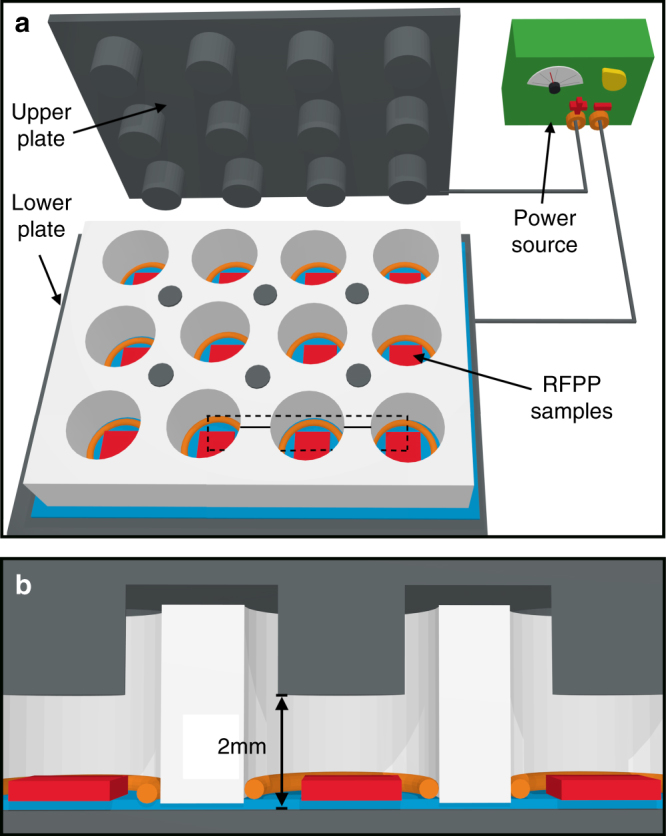
Surface functionalization of an implantable device with bioactive molecules can overcome adverse biological responses by promoting specific local tissue integration. Bioactive peptides have advantages over larger protein molecules due to their robustness and sterilizability. Their relatively small size presents opportunities to control the peptide orientation on approach to a surface to achieve favourable presentation of bioactive motifs. Here we demonstrate control of the orientation of surface-bound peptides by tuning electric fields at the surface during immobilization. Guided by computational simulations, a peptide with a linear conformation in solution is designed. Electric fields are used to control the peptide approach towards a radical-functionalized surface. Spontaneous, irreversible immobilization is achieved when the peptide makes contact with the surface. Our findings show that control of both peptide orientation and surface concentration is achieved simply by varying the solution pH or by applying an electric field as delivered by a small battery.


Conflict of interest statement

The authors declare no competing financial interests.

Figures

Fig. 1
Fig. 1
Control of peptide orientation by electric field. Charge separation on one end of the peptide creates a dipole moment (indicated by ellipses) that aligns with the electric field and rotates the entire molecule. Once contact is established with the radical-functionalized surface, covalent linkage anchors the peptide in this orientation
Fig. 2
Fig. 2
The surface has radicals and a range of charge states. a Electron paramagnetic resonance spectrum of the radical-functionalized plasma polymer (RFPP) showing a broad and symmetrical peak, indicative of unpaired electrons associated with radicals. b X-ray photoelectron spectroscopy (XPS) survey spectrum of the RFPP film showing a surface elemental composition of carbon (71.3 at.%), nitrogen (19.6 at.%) and oxygen (9.1 at.%). No sulfur or titanium is detected on the surface. c Water contact angle (WCA) of the RFPP surface. The total, polar and dispersive (Disp.) surface energies are given. d XPS C 1 s high-resolution spectra of the RFPP fitted with four components, C1: C−C/C−H, C2: C−O/C−N, C3: C=O/N−C=O and C4: COOH. e The changes of zeta potential as a function of pH show that the surface is negatively charged above pH 4.5, with the negative charge saturating at pH ≅ 7.5. The dashed lines indicate the pH values used in the immobilizing solutions. Error bars are s.d. (e)
Fig. 3
Fig. 3
The simulated peptide is linear and mostly unstructured. a Stacked bar chart labelled with amino acid one-letter codes showing the per-residue structure content that is mostly random coil. b The time series of Rg shows that after 40 ns of equilibration, the peptide maintains a single length. c Time series of the vector angle between the first principal axis and the dipole moment created by the charged residues. This shows that the dipole is closely aligned to the long axis of the peptide. d Net charge of the peptide across a range of pH values. All residues in the charged region are charged between approximately pH 5–10, leading to a net charge of −4 e. e Space-filling model of a representative structure of the FLAG-tag peptide, showing the turn across residues F2–A7, and the extended random coil structure of the polar, charged residues (D16–K21). Scale bar: 1 nm
Fig. 4
Fig. 4
pH controls the peptide concentration and orientation. a Sulfur content, as measured by X-ray photoelectron spectroscopy (XPS), indicates increasing surface peptide with solution concentration but is undetectable for concentrations below 5 µg mL−1. b Peptide titration shows that enzyme-linked immunosorbent assay (ELISA) is discriminatory for peptide concentrations down to at least 0.5 µg mL−1 but saturates at approximately 20 µg mL−1 due to the large footprint of the primary and secondary antibodies compared to the peptide. Hence, ELISA is not capable of discerning immobilized peptide surface density for high densities while XPS is not capable of detecting low peptide surface concentrations. c XPS sulfur atomic concentration of peptide-coated surfaces compared to uncoated controls for immobilization pH values of 5.4 and 9.8. The sulfur content shows surface peptide at pH 5.4, but no detectable peptide at pH 9.8. Presence of peptide after Tween 20 or sodium dodecyl sulfate (SDS) washing indicates covalent attachment. d The absorbance measured with ELISA for peptide-coated samples for immobilization pH values of 5.4 and 9.8 compared with uncoated controls. ELISA shows that peptide is present at both pH values. e Time of flight secondary ion mass spectrometry (ToF-SIMS) normalized mass fragments of the hydrophobic residues indicate higher number of FLAGDOWN peptide for pH 9.8, suggesting that a greater proportion of peptide for pH = 5.4 is in the FLAGUP orientation. Error bars are s.d. and P-values are from the Student’s two-tailed t-test: **P < 0.01, ***P < 0.001 (b, d and e). XPS error bars are calculated from the background noise (a, c)
Fig. 5
Fig. 5
External field controls peptide density and orientation. a The sulfur atomic concentration of the peptide-functionalized surface from X-ray photoelectron spectroscopy (XPS) as a function of applied voltage (peptide solution concentration = 1 µg mL−1). An increase in peptide arrival rate is observed for the Eup field, while no peptide is detectable for the Edown field. b The absorbance measured with enzyme-linked immunosorbent assay (ELISA) as a function of applied voltage showing that peptide is present after immobilization in both Eup and Edown field directions (peptide solution concentration = 1 µg mL−1). c Time of flight secondary ion mass spectrometry (ToF-SIMS) normalized mass fragments of the hydrophobic peptide residues indicate approximately equal amounts of FLAGDOWN peptide (peptide solution concentration = 180 µg mL−1). d The sulfur atomic concentration of the peptide-functionalized surface from XPS as a function of applied voltage (peptide solution concentration = 180 µg mL−1). Surface peptide is increased by Eup, and decreased by Edown relative to the case when no field is applied. Given the higher concentration for the Eup field but equal amount of hydrophobic residues (indicating FLAGDOWN peptide) in ToF-SIMS, there is a higher proportion of FLAGUP peptide for this field direction compared to the Edown direction. Error bars are s.d. and P-values are from the Student’s two-tailed t-test: **P < 0.01, ***P < 0.001 (b, c). XPS error bars are calculated from the background noise (a, d)
Fig. 6
Fig. 6
Illustration of peptide orientation and concentration. The immobilization conditions were a pH 5.4, b pH 9.8, and with applied electric fields c Eup and d Edown both at pH 5.4. The radical-functionalized plasma polymer surface is indicated by purple rectangles, with charges on both the surfaces and the peptide indicated by circled + or – signs. e The enlarged peptide indicates the position of amino acids (lysine (K) blue, aspartic acid (D) red, and all others shown in grey)
Fig. 7
Fig. 7
The sample holder for applying external electric fields. a The radical-functionalized plasma polymer-coated samples (red) lie in wells in a polyether ether ketone sample holder with 12 wells (white). Rubber O-rings (orange) seal each well, which are insulated by a 0.1 mm polytetrafluoroethylene sheet (blue). The upper plate fits on top of the sample holder, and electrical potential is applied across the wells using a variable power source. Dotted lines indicate the cross-section in (b). b Cross-section of three wells. The extensions from the top plate lower into each well, leaving a 2-mm gap between the bottom and top plates. The sample is raised 0.1 mm above this level by the insulating material

Similar articles

Cited by

References

    1. Langer R, Tirrell DA. Designing materials for biology and medicine. Nature. 2004;428:487–492. doi: 10.1038/nature02388. - DOI - PubMed
    1. Cobelli N, Scharf B, Crisi GM, Hardin J, Santambrogio L. Mediators of the inflammatory response to joint replacement devices. Nat. Rev. Rheumatol. 2011;7:600–608. doi: 10.1038/nrrheum.2011.128. - DOI - PubMed
    1. Anderson JM, Rodriguez A, Chang DT. Foreign body reaction to biomaterials. Semin. Immunol. 2008;20:86–100. doi: 10.1016/j.smim.2007.11.004. - DOI - PMC - PubMed
    1. Dias, J., Kay, P., Porter, M. & Briggs, T. Restoring Your Mobility. Available at http://www.boa.ac.uk/wp-content/uploads/2014/01/BOA-Practise-Strategy.pdf (British Orthopaedic Association, 2012).
    1. Wise SG, et al. Plasma ion activated expanded polytetrafluoroethylene vascular grafts with a covalently immobilized recombinant human tropoelastin coating reducing neointimal hyperplasia. ACS Biomater. Sci. Eng. 2016;2:1286–1297. doi: 10.1021/acsbiomaterials.6b00208. - DOI - PubMed

Publication types

LinkOut - more resources