. 2018 Jan 24;9(1):360.
doi: 10.1038/s41467-017-02107-w.

Parallel derivation of isogenic human primed and naive induced pluripotent stem cells

Collaborators, Affiliations

Parallel derivation of isogenic human primed and naive induced pluripotent stem cells

Stéphanie Kilens et al. Nat Commun. .

Abstract

Induced pluripotent stem cells (iPSCs) have considerably impacted human developmental biology and regenerative medicine, notably because they circumvent the use of cells of embryonic origin and offer the potential to generate patient-specific pluripotent stem cells. However, conventional reprogramming protocols produce developmentally advanced, or primed, human iPSCs (hiPSCs), restricting their use to post-implantation human development modeling. Hence, there is a need for hiPSCs resembling preimplantation naive epiblast. Here, we develop a method to generate naive hiPSCs directly from somatic cells, using OKMS overexpression and specific culture conditions, further enabling parallel generation of their isogenic primed counterparts. We benchmark naive hiPSCs against human preimplantation epiblast and reveal remarkable concordance in their transcriptome, dependency on mitochondrial respiration and X-chromosome status. Collectively, our results are essential for the understanding of pluripotency regulation throughout preimplantation development and generate new opportunities for disease modeling and regenerative medicine.


Conflict of interest statement

The authors declare no competing financial interests.

Figures
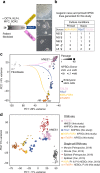
Fig. 1
Fig. 1
Direct reprogramming of somatic cells into hiNPSCs. a Direct generation of isogenic naive and primed hiPSCs. Fibroblasts were transduced with 3 Sendai viruses expressing a polycistron KLF4/OCT4/SOX2, MYC and KLF4 at a ratio of 5:5:3, respectively. Cells were split on feeders at day 7, and placed in the indicated media at day 9. Scale bar = 100 µm. b Summary of lines generated for this study in primed (KSR+FGF2, yellow) or naive culture media (RSeT, blue or T2iLGö, pink) originated from 5 different donors. c Different pluripotent states are induced depending on culture media. Transcriptomes of hiPSCs and hiNPSCs, control primed hESC lines H1 and H9 or the naive hESC line HNES1 were analyzed by PCA. Symbols represent donor lines, and size of the symbols represents the passage. Arrows have been drawn to highlight the reprogramming trajectories. d T2iLGö hiNPSCs are the closest to human epiblast cells. PCA of single-cell RNA-seq data sets from preimplantation embryo samples, compared to primed hPSCs from ref. and to primed/naive hiPSCs/hESCs from this study
Fig. 2
Fig. 2
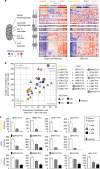
hiNPSCs express markers specific to human epiblast cells. a Specific naive pluripotency markers display identical profiles in T2iLGö hiNPSCs and preimplantation epiblast cells. Individual differentially expressed genes plotted as RPKM for single-cell RNA-seq or mRNA molecules per million of total mRNA molecules for DGE-seq. Upper panel: all genes are differentially expressed (Epi vs primed), except SOX2; lower panel: all genes are differentially expressed (T2iLGö vs primed), except POU5F1(OCT4) and NANOG. Error bars are defined as s.e.m. Statistical tests used to compute differentially expressed genes are defined in the “Differential Expression profiling” section of the Methods. b Schematic representation of the human preimplantation development comparing clinical staging (Morula, B2, B3, B4 and B5) with corresponding embryonic days (E). EPI epiblast cells in red, PE primitive endoderm cells in green; TE trophectoderm cells in blue. c KLF17 protein is expressed in all morula cells before being restricted to epiblast cells in the blastocyst. Human embryos were cultivated in a time-lapse microscope and fixed at indicated stages (morula, B2 or B4 blastocysts). Immunofluorescence for KLF17 (red), GATA2 (blue) and SOX17 (green) was performed. For each indicated embryonic stage, immunofluorescence was performed on 3 biological replicates. Scale bar = 50 µm. d KLF17 protein is specifically expressed in T2iLGö hiNPSCs (pink) and not in isogenic lines cultivated in RSeT (blue) and KSR-FGF2 (yellow). Indicated cell lines were analyzed by immunofluorescence for NANOG (yellow), KLF17 (red) and DNMT3L (cyan). This figure is representative of 8 biological replicates. Scale bar = 50 µm
Fig. 3
Fig. 3
T2iLGö hiNPSCs metabolic profile is closely related to preimplantation epiblast. a Genes coding proteins of the electron transport chain, located in the inner membrane of the mitochondria, are upregulated in human epiblast cells and T2iLGö hiNPSCs in comparison to their primed counterparts. Relative expression of genes related to oxidative phosphorylation pathway for hESC, morula and epiblast samples analyzed by single-cell RNA-seq (left), and analyzed by DGE-seq for primed or naive hPSCs (right). Genes were classified by mitochondrion complex and hierarchically clustered. b T2iLGö hiNPSCs have higher metabolic activity than their isogenic counterparts in RSeT and KSR+FGF2. A SeaHorse apparatus was used to measure the oxygen consumption rate and the extracellular acidification rate of hiNPSC and hiPSC lines, maintained in indicated culture conditions. This figure presents six biological replicates. Each symbol in the panel is the average of a technical triplicate. c T2iLGö hiNPSCs have a higher resistance to inhibition of glycolysis. Quantification of colony numbers obtained after culture with the indicated concentrations of 2-deoxy-D-glucose. Primed cells were seeded in StemMACS™ iPS Brew XF, and naive cells were seeded in the indicated medium. Error bars indicate s.d. of three technical replicates. The presented experiment is representative of four independent experiments
Fig. 4
Fig. 4
T2iLGö hiNPSCs are hypomethylated. a T2iLGö hiNPSCs are hypomethylated in comparison to their RSeT and KSR+FGF2 counterparts. 5mC content is expressed as the percentage of 5mC in the total pool of cytosine for the indicated cell lines. Significance level was determined using Kruskal–Wallis test **p < 0.01. b Expression of indicated epigenetic-related genes is plotted as RPKM for single-cell RNA-seq or mRNA molecules per million of total mRNA molecules for DGE-seq. Error bars are defined as s.e.m. *Differentially expressed gene, as defined in Methods
Fig. 5
Fig. 5
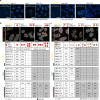
T2iLGö hiNPSCs have a X-chromosome status related to preimplantation epiblast. a T2iLGö hiNPSCs or high-passage KSR-FGF2 do not display H3K27me3 foci. Indicated cell lines were analyzed by immunofluorescence for H3K27me3. This experiment is representative of three technical replicates performed at different passages of the cell lines. Scale bar = 50 µm. b, c T2iLGö hiNPSCs show signs of X-chromosome reactivation. mRNA FISH analysis for b ATRX and XACT or c XIST and XACT. For each cell line represented, more than 100 cells were investigated for their nuclear expression of the indicated mRNA. Quantifications for each combination are indicated below pictures. For each table, samples distribution between FISH counting were found statistically different (p < 0.01) by a homogeneity χ2 test. Scale bar = 20 µm
Fig. 6
Fig. 6
Clonal analysis of X-chromosome reactivation in T2iLGö hiNPSCs. a Representative karyotypes of T2iLGö subclones. b Karyotype and mRNA FISH analysis for ATRX and XACT (left) or XIST and XACT (right) of indicated subclones. For each subclone represented, more than 50 cells were investigated for their nuclear expression of the indicated mRNA. Quantifications for each combination are indicated below pictures
Fig. 7
Fig. 7
hiNPSCs in T2iLGö achieve the most naive pluripotency hallmarks. The presented reprogramming method enables to simultaneously generate isogenic hiPSCs in KSR+FGF2, RSeT and T2iLGö media. The naive pluripotency level of the generated cell lines can be assessed with specific markers, X-chromosome activity status, DNA methylation level and capacity to tolerate glycolysis inhibition

References

    1. Nichols J, Smith A. Naive and primed pluripotent states. Cell Stem Cell. 2009;4:487–492. doi: 10.1016/j.stem.2009.05.015. - DOI - PubMed
    1. Weinberger L, Ayyash M, Novershtern N, Hanna JH. Dynamic stem cell states: naive to primed pluripotency in rodents and humans. Nat. Rev. Mol. Cell. Biol. 2016;17:155–169. doi: 10.1038/nrm.2015.28. - DOI - PubMed
    1. Chen H, et al. Reinforcement of STAT3 activity reprogrammes human embryonic stem cells to naive-like pluripotency. Nat. Commun. 2015;6:7095. doi: 10.1038/ncomms8095. - DOI - PMC - PubMed
    1. Chan YS, et al. Induction of a human pluripotent state with distinct regulatory circuitry that resembles preimplantation epiblast. Cell Stem Cell. 2013;13:663–675. doi: 10.1016/j.stem.2013.11.015. - DOI - PubMed
    1. Gafni O, et al. Derivation of novel human ground state naive pluripotent stem cells. Nature. 2013;504:282–286. doi: 10.1038/nature12745. - DOI - PubMed

Publication types

MeSH terms