. 2018 Jan 24;8(1):1504.
doi: 10.1038/s41598-018-19791-3.

Vertical Light Sheet Enhanced Side-View Imaging for AFM Cell Mechanics Studies

Affiliations

Vertical Light Sheet Enhanced Side-View Imaging for AFM Cell Mechanics Studies

Kellie Beicker et al. Sci Rep. .

Abstract

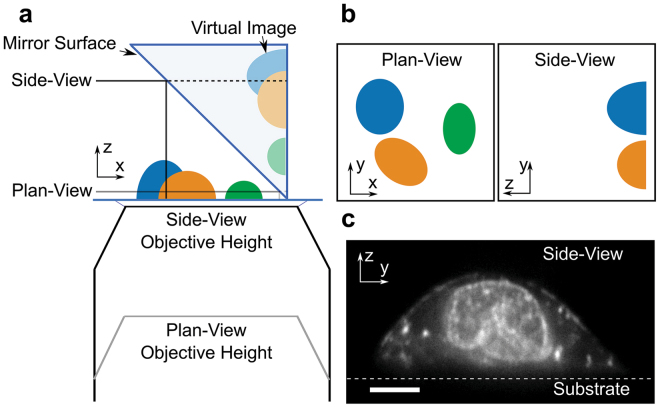
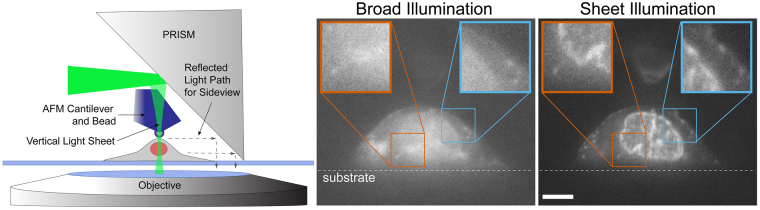
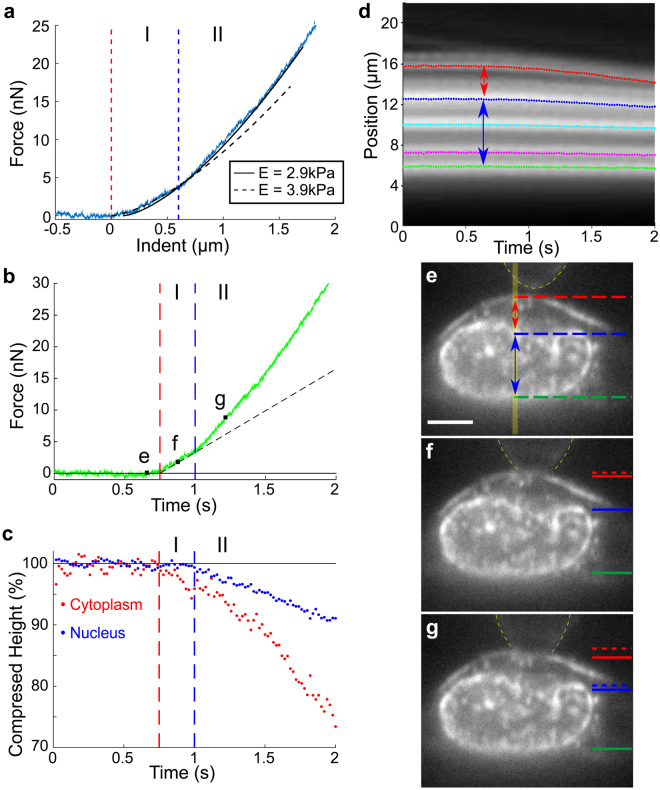
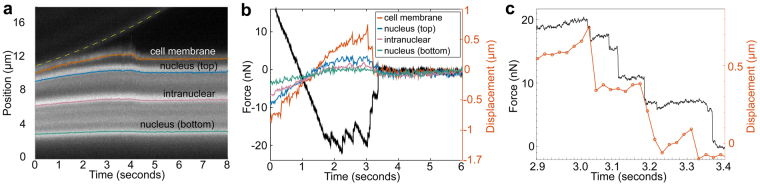
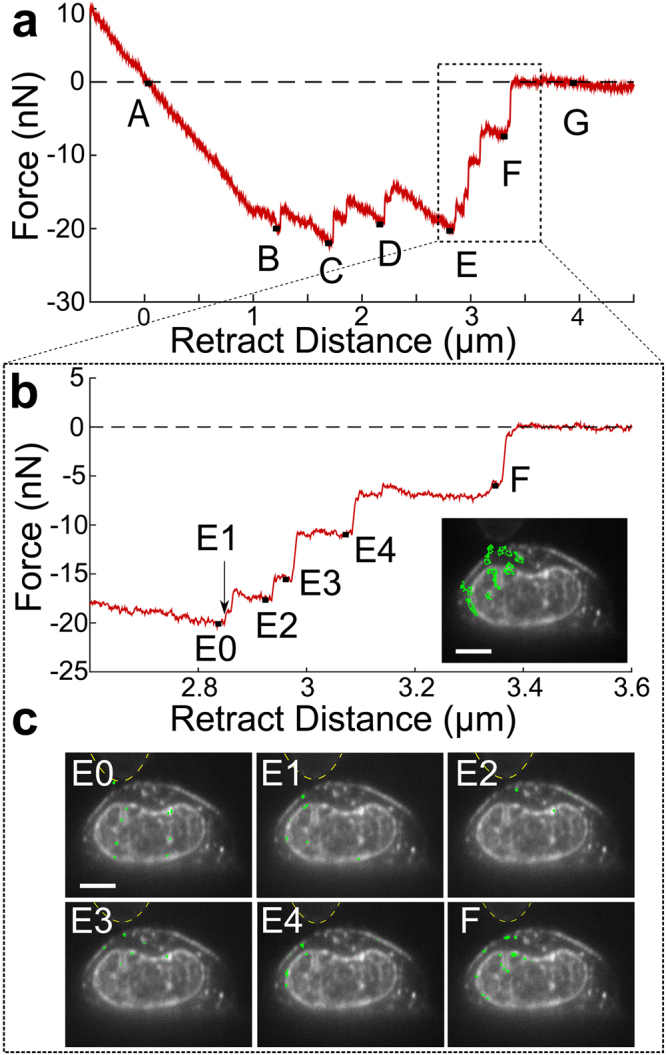
The ability to measure dynamic structural changes within a cell under applied load is essential for developing more accurate models of cell mechanics and mechanotransduction. Atomic force microscopy is a powerful tool for evaluating cell mechanics, but the dominant applied forces and sample strains are in the vertical direction, perpendicular to the imaging plane of standard fluorescence imaging. Here we report on a combined sideways imaging and vertical light sheet illumination system integrated with AFM. Our system enables high frame rate, low background imaging of subcellular structural dynamics in the vertical plane synchronized with AFM force data. Using our system for cell compression measurements, we correlated stiffening features in the force indentation data with onset of nuclear deformation revealed in the imaging data. In adhesion studies we were able to correlate detailed features in the force data during adhesive release events with strain at the membrane and within the nucleus.


Conflict of interest statement

The authors declare that they have no competing interests.

Figures

Figure 1
Figure 1
PRISM image formation. (a) A cartoon of the PRISM imaging system showing the mirrored surface of the 45-degree reflecting optic, objective, and cells (blue, orange, and green). Both the plan-view and reflected side-view imaging planes are indicated. (b) Both the plan- and side-view imaging planes as they would appear in camera view. (c) A side view image of an ovarian cancer cell (SKOV3) with both membrane and nucleic acids labeled (Vybrant and SYTO 83 respectively). Scale bar = 5 um.
Figure 2
Figure 2
VLS enhanced PRISM imaging with AFM access. Left is a cartoon depiction of the experimental set up. The light sheet emerges from the imaging objective illuminating a vertical slice of the cell. A beaded AFM cantilever accesses the top of the cell for force measurements. A side-view image of the cell is reflected back into the objective, horizontally displaced from the plan-view image. The center and right panels show side-view images of an ovarian cancer cell labeled with membrane (Vybrant) and nucleic acid (SYTO83) dyes using broad and sheet illumination respectively. Images are taken with the same exposure time and plane of focus, and indicate a pronounced improvement in signal to noise with VLS illumination. Enlarged regions of interest show improved resolution of the nuclear boundary and cell membrane. Scale bar = 5 um.
Figure 3
Figure 3
Stiffening of SKOV3 cell corresponds to onset of nuclear deformation. (a) AFM force vs. indentation data on SKOV3 cell fit to a two regime Hertz model, with the transition point (indicated by blue dashed line) determined through least squares fitting. (b) Force vs. time plot of same data as (a). Transition point from regime I to regime II as determined in (a) shows an abrupt change in slope. (c) Normalized compressed height vs. time of the cytoplasm region above the nucleus and the nucleus during indentation, as determined using kymograph data (d). The cytoplasm is defined as the region between the cell membrane (red) and the top of the nucleus (blue) indicated by red arrow in (d), and the nuclear region, indicated by blue arrow, is defined by the kymograph traces at the top (blue) and bottom (green) of the nucleus in (d). (d) Kymograph of the yellow region under AFM tip (indicated by vertical yellow bar in (e)) over the course of indentation with Gaussian tracked intensity peaks. The dotted curves correspond to the cell membrane (red), top of the nuclear region (blue), punctate labeled structures within nucleus (cyan and magenta) and the bottom of the nuclear region (green). (eg) Sample images from a time sequence acquired simultaneously with force data, as identified on the force vs. time trace (b). Dashed lines on the left of the images indicate the initial position of the traced cytoplasm (red) and nucleus (blue) regions and solid lines indicate the current positions. Yellow dashed lines indicate outline of AFM mounted bead. Scale bar in (e) = 5 um.
Figure 4
Figure 4
Simultaneous adhesion force and image data acquired for a fibronectin-coated AFM tip on a SKOV3 cell. (a) The kymograph shows motion of the AFM tip off the cell surface eventually leaving the FOV at ∼ 4 seconds (diagonal band at top highlighted with yellow dashed line), and several bright fluorescent regions of the cell - cell membrane (red), top of nucleus (green), punctate region within nucleus (cyan), and bottom of nucleus (magenta). (b) Time synchronized AFM force data (black - left axis) and displacements (red, green, cyan, magenta - right axis) measured from images are displayed on the same plot. (c) Zoom in of (b) with only force data (sign of force inverted for clarity) and cell membrane displacement data displayed. Some force drops are associated with membrane displacements while others are not.
Figure 5
Figure 5
Membrane and nuclear displacements observed in response to force-rupture events between the AFM-tip and cell membrane. (a) Retraction portion of force-indentation curve with important points (A-G) identified. A, the point of zero force application to the cell, B-F, force-rupture peaks, and G, after bead releases from cell. (b) A closer examination of peaks E and F with sub-peaks of the E rupture event identified. No point is shown for E1 because this is the frame immediately following Peak E0. Inset indicates regions where displacement is measured between points E and F highlighted in green. These regions were determined through difference imaging using frames taken at E and F. (c) Regions of cell displacements determined through difference imaging highlighted in green for the sub-peaks indicated in (b). Yellow dashed lines indicate outline of AFM mounted bead. Scale bars = 5 um.

References

    1. Bao G, Suresh S. Cell and molecular mechanics of biological materials. Nat Mater. 2003;2:715–725. doi: 10.1038/nmat1001. - DOI - PubMed
    1. Discher DE, Janmey P, Wang YL. Tissue cells feel and respond to the stiffness of their substrate. Science. 2005;310:1139–1143. doi: 10.1126/science.1116995. - DOI - PubMed
    1. Janmey PA, Miller RT. Mechanisms of mechanical signaling in development and disease. J Cell Sci. 2011;124:9–18. doi: 10.1242/jcs.071001. - DOI - PMC - PubMed
    1. Swaminathan V, et al. Mechanical stiffness grades metastatic potential in patient tumor cells and in cancer cell lines. Cancer Res. 2011;71:5075–5080. doi: 10.1158/0008-5472.CAN-11-0247. - DOI - PMC - PubMed
    1. Xu W, et al. Cell stiffness is a biomarker of the metastatic potential of ovarian cancer cells. PLoS One. 2012;7:e46609. doi: 10.1371/journal.pone.0046609. - DOI - PMC - PubMed

Publication types