. 2018 Jan 24;9(2):90.
doi: 10.1038/s41419-017-0136-y.

Differential effects of reticulophagy and mitophagy on nonalcoholic fatty liver disease

Affiliations

Differential effects of reticulophagy and mitophagy on nonalcoholic fatty liver disease

Lijun Pang et al. Cell Death Dis. .

Abstract

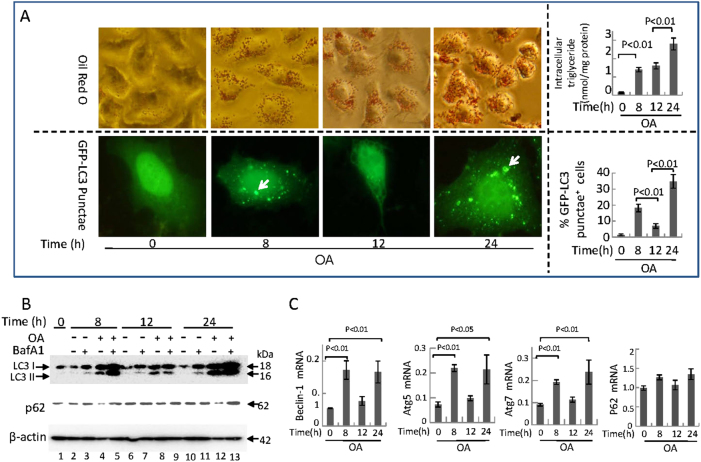
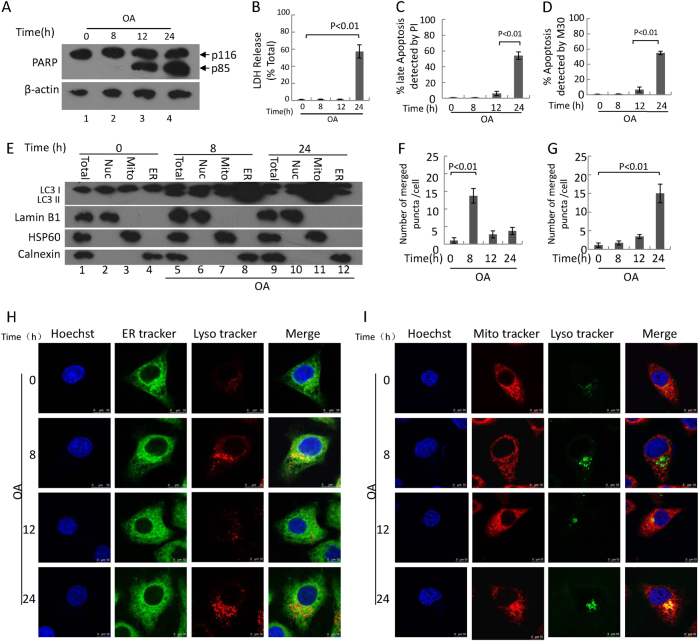
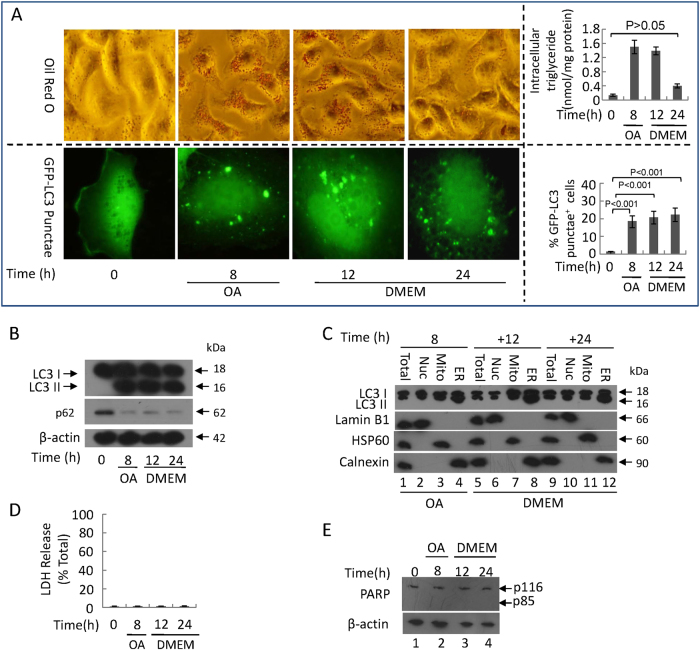
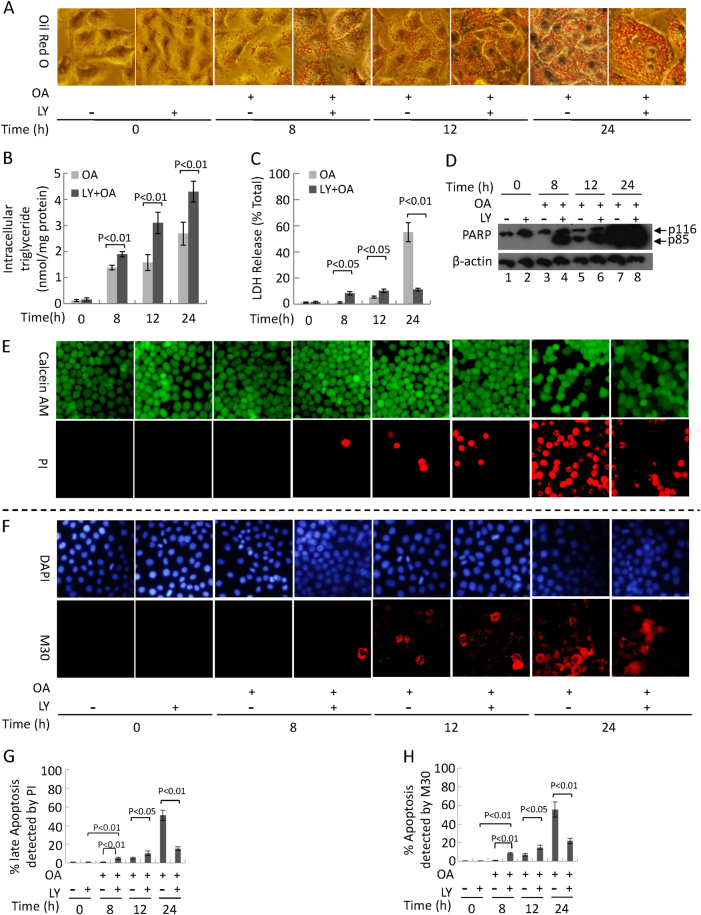
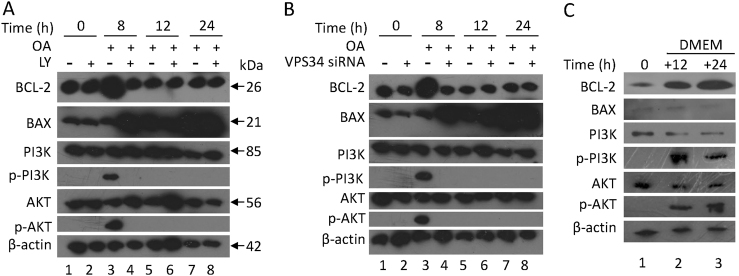
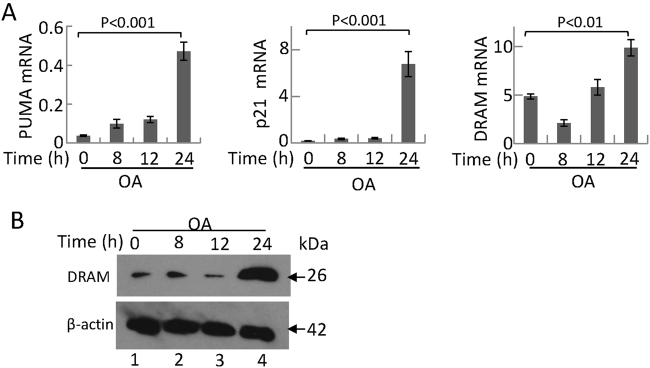
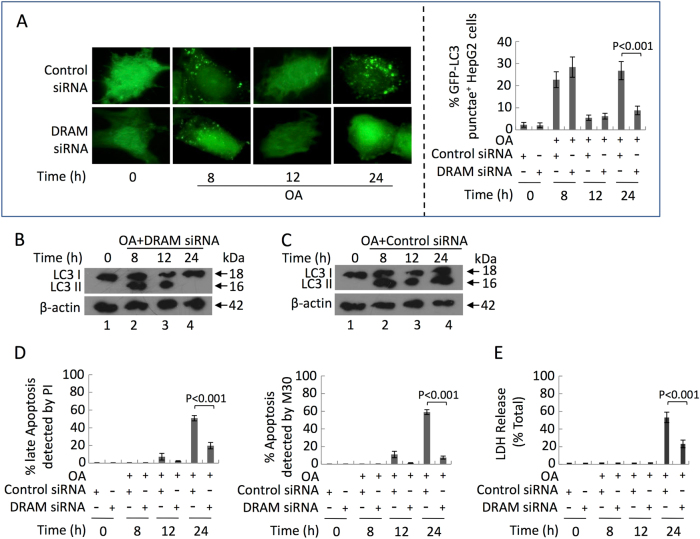
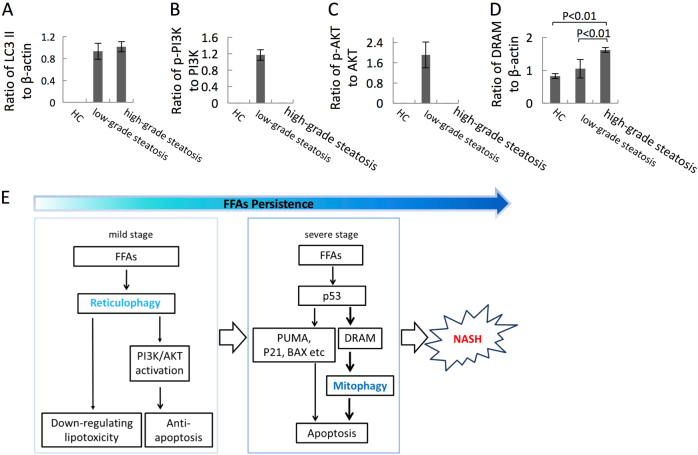
Autophagy affects the pathological progression of non-alcoholic fatty liver disease (NAFLD); however, the precise role of autophagy in NAFLD remains unclear. In this study, we want to identify the role of autophagy including reticulophagy and mitophagy in NAFLD pathogenesis. When HepG2 cells were treated with 400 μM oleic acid (OA), increased reticulophagy was induced 8 h after treatment, which correlated with an anti-apoptotic response as shown by the activation of the PI3K/AKT pathway, an increase in BCL-2 expression, and the downregulation of OA-induced lipotoxicity. When treated with OA for 24 h, DRAM expression-dependent mitophagy resulted in increased apoptosis in HepG2 cells. Inhibition of reticulophagy aggravated and increased lipotoxicity-induced apoptosis 8 h after treatment; however, the inhibition of mitophagy decreased hepatocyte apoptosis after 24 h of OA treatment. Results from the analysis of patient liver samples showed that autophagic flux increased in patients with mild or severe NAFL. PI3K/AKT phosphorylation was observed only in samples from patients with low-grade steatosis, whereas DRAM expression was increased in samples from patients with high-grade steatosis. Together, our results demonstrate that reticulophagy and mitophagy are independent, sequential events that influence NAFLD progression, which opens new avenues for investigating new therapeutics in NAFLD.


Conflict of interest statement

The authors declare that they have no conflict of interest.

Figures

Fig. 1
Fig. 1. Autophagy development peaks at 8 and 24 h in response to 400 μM OA stimulus in HepG2 cells
a Oil Red O staining (upper left panel, original magnification, ×400) and intracellular triglyceride levels of cells (upper right panel); representative GFP-LC3 images (lower left panel, original magnification, ×1000) and the percentage of autophagosomes (lower right panel) of the cells. White arrow indicates autophagosomes formation and cells with 5 or more GFP-LC3 puncta were considered to have accumulated autophagosomes. Data are presented as mean ± SEM in three independent experiments. b Representative western blotting analysis of LC3I/II and p62 expressions after using Bafilomycin A1 in cells. c Real-time PCR analysis of mRNA levels of Beclin-1, Atg5 a, Atg7, and p62 in cells. Data are presented as mean ± SEM in three independent experiments
Fig. 2
Fig. 2. OA treatment induces apoptosis, cell impairment, reticulophagy, and mitophagy development
HepG2 cells were treated with 400 μM OA for 24 h. a Representative western blotting analysis of cleaved PARP fragment in cells. b The levels of LDH release in supernatant. c, d Quantification of apoptotic cells by Calcein AM/PI(B) and M30(C) immunoreactivity. Data are presented as mean ± SEM in three independent experiments. e Subcellular fractions of HepG2 cells were subjected to a western blotting assay with indicated antibodies. Lamin B1, HSP60, and calnexin were used as controls for the nuclei (Nuc), mitochondrial (Mito), and endoplasmic reticulum (ER) fractions, respectively. Total: total lysate of cells. h The degree of colocalization of endoplasmic reticulum with lysosomes in HepG2 cells was measured via live-cell imaging microscopy. LysoTracker Red DND-99 staining was applied to mark lysosomal structures (red), and ER-Tracker Green to visualize endoplasmic reticulum (green). Hoechst 33342 dye was used to stain nuclei (blue). A positive colocalization is indicated by yellow signals (merge) due to the overlap of LysoTracker Red and ER-Tracker Green staining. Scale bars: 10 μm. i The degree of colocalization of mitochondria with lysosomes in HepG2 cells. LysoTracker was green pseudo, and MitoTracker was red. A positive colocalization is indicated by yellow signals (merge) due to the overlap of LysoTracker Red and MitoTracker Green staining. Scale bars: 10 μm. f, g Quantification of the merged number which was yellow. Data are presented as mean ± SEM in three independent experiments
Fig. 3
Fig. 3. The first wave of autophagy prevents 400 μM OA-induced lipotoxicity and hepatocytic apoptosis
HepG2 cells were stimulated by 400 μM OA for 8 h and then were cultured in normal DMEM culture medium for 12 and 24 h. a Oil Red O staining (upper left panel, original magnification, ×400) and intracellular triglyceride levels of cells (upper right panel); representative GFP-LC3 images (lower left panel, original magnification, ×1000) and the percentage of autophagosomes (lower right panel) of the cells. Cells with 5 or more GFP-LC3 puncta were considered to have accumulated autophagosomes. Data are presented as mean ± SEM in three independent experiments. b, e Representative western blotting analysis of LC3 I/II and p62(B) and cleaved PARP fragment e. c Subcellular fractions were subjected to a western blotting assay with indicated antibodies. Lamin B1, HSP60, and calnexin were used as controls for the nuclei (Nuc), mitochondrial (Mito), and endoplasmic reticulum (ER) fractions, respectively. Total: total lysate of cells. d The levels of LDH release in HepG2 cells were analyzed. Data are presented as mean ± SEM in three independent experiments
Fig. 4
Fig. 4. Autophagy inhibition by LY294002 (LY) promotes earlier apoptosis development at 8 h, but decreases the level of apoptosis at 24 h
LY294002, a PI3K inhibiter, was added into the culture for 5 h to inhibit autophagy and replaced by 400 μM OA. a Oil Red O staining (original magnification, ×400). b Intracellular triglyceride levels. c The levels of LDH release. d Representative western blotting analysis of cleaved PARP fragment in cells. Representative images of calcein AM/PI staining (e), DAPI/M30 staining (f), and quantification of late (g) and early (h) apoptosis by PI staining and M30 immunoreactivity, respectively. b, c, g, h Data are presented as mean ± SEM in three independent experiments
Fig. 5
Fig. 5. OA treatment activates PI3K/AKT signaling pathway and increases BCL-2 expression at 8 h, whereas increases BAX expression at 24 h
HepG2 cells were pre-treated with LY294002 (a) or VPS34 siRNA (b) and then were cultured with 400 μM OA. c HepG2 cells were treated with 400 μM OA for 8 h and then were cultured in normal DMEM culture for 12 and 24 h. ac Lysates of HepG2 cells were collected, and an immunoblot assay was conducted with the indicated antibodies
Fig. 6
Fig. 6. p53 signaling pathway was activated by 400 μM OA treatment
a Total RNA was isolated from HepG2 cells treated with 400 μM OA. Real-time PCR was employed to detect the mRNA level of PUMA, p21, and DRAM. b Lysates of HepG2 cells were collected, and an immunoblot assay was conducted with the anti-DRAM antibody
Fig. 7
Fig. 7. Following 400 μM OA treatment, DRAM expression induced the second wave of autophagy
HepG2 cells were pre-treated with DRAM siRNA and then cultured with 400 μM OA. a Representative GFP-LC3 images (left panel, original magnification, ×1000), quantification of autophagosome formation (right panel). b, c Lysates of HepG2 cells were collected, and an immunoblot assay was conducted with the indicated antibodies. d Quantification of apoptotic cells by calcein AM/PI and M30 immunoreactivity. e The levels of LDH release. a, d, e Data are presented as mean ± SEM in three independent experiments
Fig. 8
Fig. 8. Autophagy development, activation of PI3K/AKT, and DRAM signaling pathways were detected in liver tissues of patients with low-grade steatosis and high-grade steatosis
Lysates of liver tissues were collected and immunoblot assay was conducted with the indicated antibodies. Densitometry analysis of the band density ratio of LC3 II (a)/DRAM (d) to β-actin and phosphor-PI3K (b)/-AKT (c) to their non-active forms. e Model. In the mild stage of NAFLD, FFAs primarily induce reticulophagy to protect hepatocytes via downregulating lipotoxicity and activating the PI3K/AKT signaling pathway. In the severe stage when FFAs are persistent, FFAs induce DRAM expression through p53 and causes hepatocytic apoptosis, through mitophagy in concert with one or more p53-dependent apoptotic signals, leading to NASH development

References

    1. Wallace, M. B., Aqel, B. A., Lindor, K. D. & Devault, K. R. Practical Gastroenterology and Hepatology Board Review Toolkit, Ch. 83 (John Wiley & Sons Ltd., Oxford 2016).
    1. Yki-Järvinen H. Non-alcoholic fatty liver disease as a cause and a consequence of metabolic syndrome. Lancet Diabetes Endocrinol. 2014;2:901–910. doi: 10.1016/S2213-8587(14)70032-4. - DOI - PubMed
    1. Hall Z, et al. Lipid zonation and phospholipid remodeling in nonalcoholic fatty liver disease. Hepatology. 2017;65:1165–1180. doi: 10.1002/hep.28953. - DOI - PMC - PubMed
    1. Machado MV, Diehl AM. Pathogenesis of nonalcoholic steatohepatitis. Gastroenterology. 2016;150:1769–1777. doi: 10.1053/j.gastro.2016.02.066. - DOI - PMC - PubMed
    1. Tilg H, Moschen AR. Evolution of inflammation in nonalcoholic fatty liver disease: the multiple parallel hits hypothesis. Hepatology. 2010;52:1836–1846. doi: 10.1002/hep.24001. - DOI - PubMed

Publication types

MeSH terms