. 2018 Apr;37(15):2037-2051.
doi: 10.1038/s41388-017-0120-0. Epub 2018 Jan 25.

Suppression of STING signaling through epigenetic silencing and missense mutation impedes DNA damage mediated cytokine production

Affiliations

Suppression of STING signaling through epigenetic silencing and missense mutation impedes DNA damage mediated cytokine production

Hiroyasu Konno et al. Oncogene. 2018 Apr.

Abstract

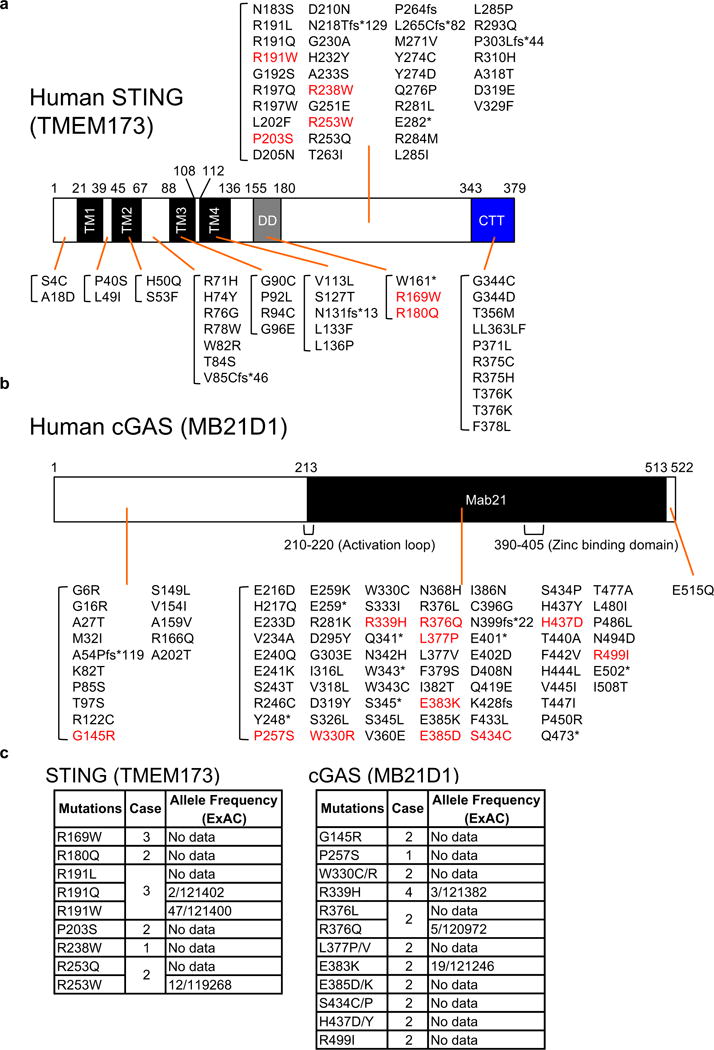
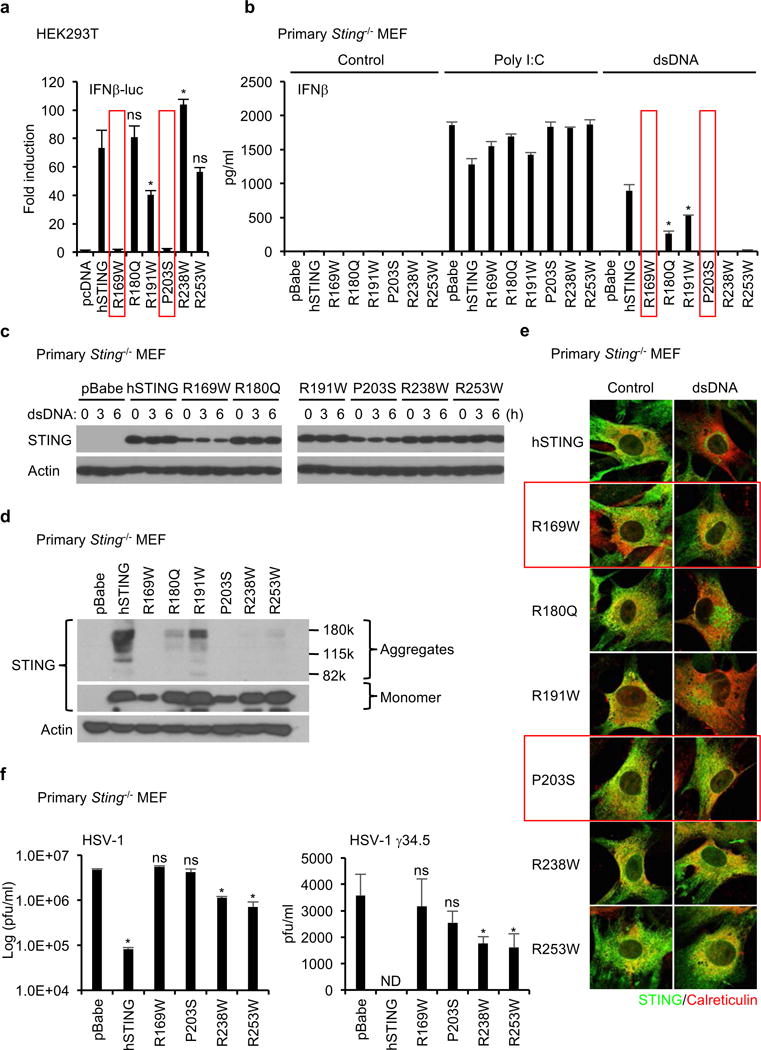
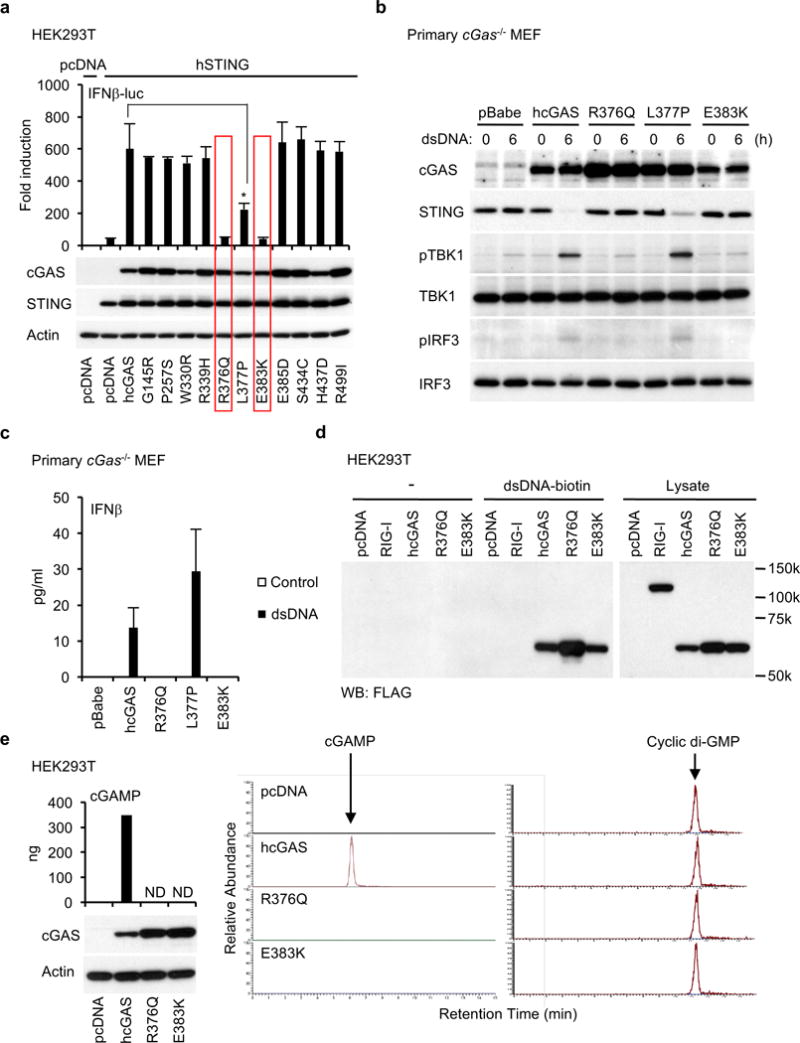
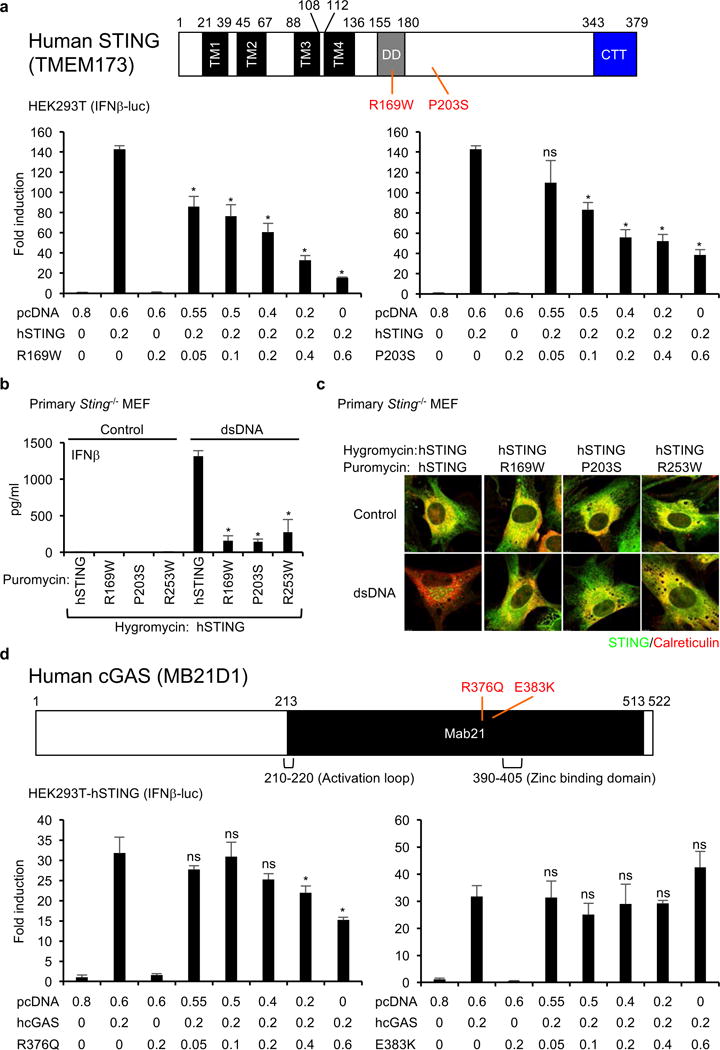
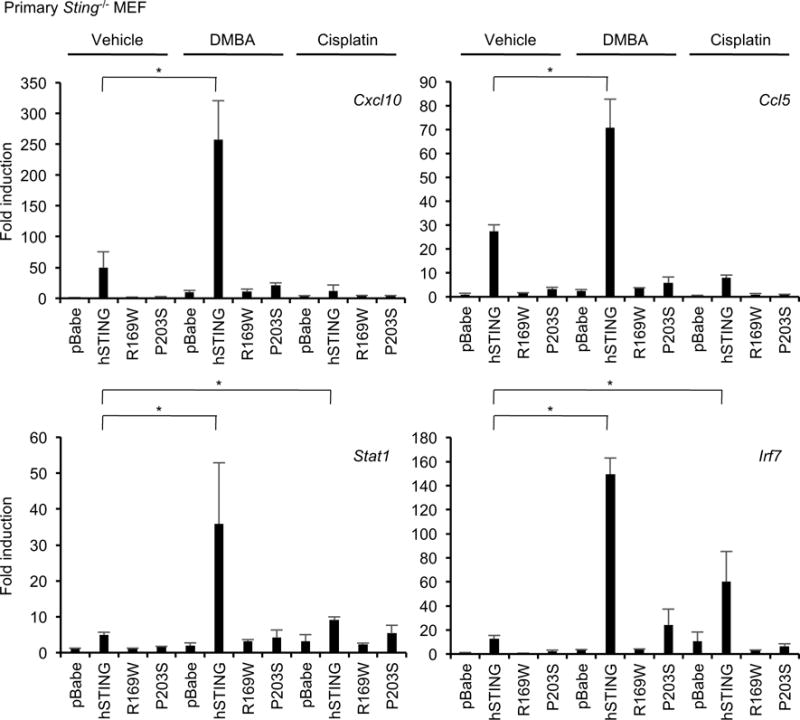
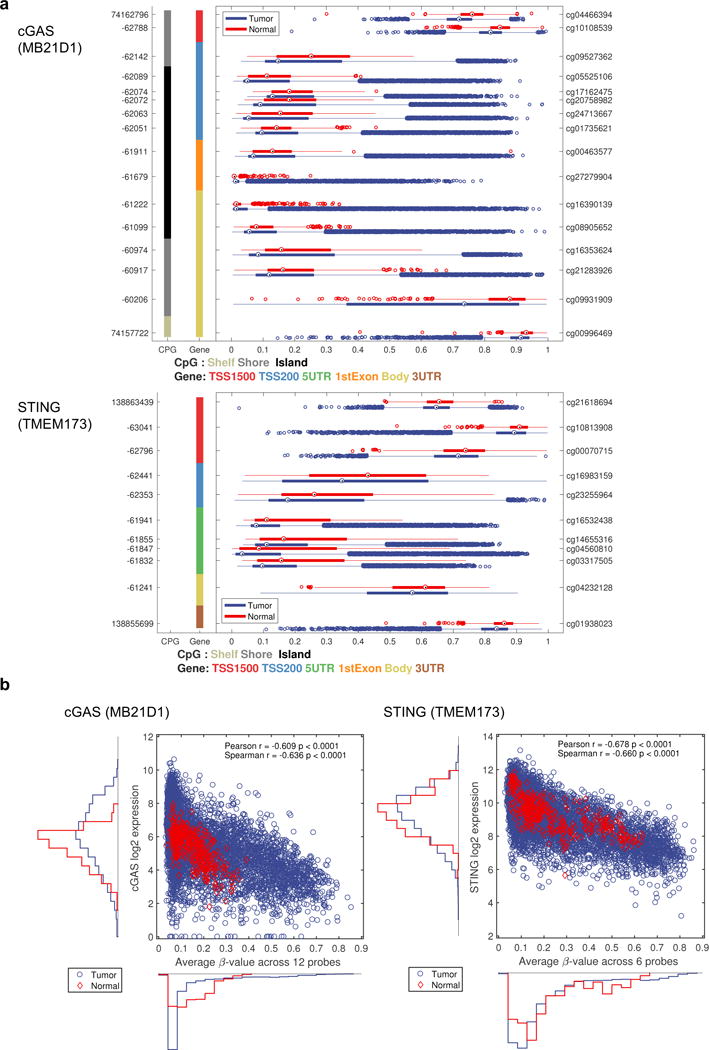
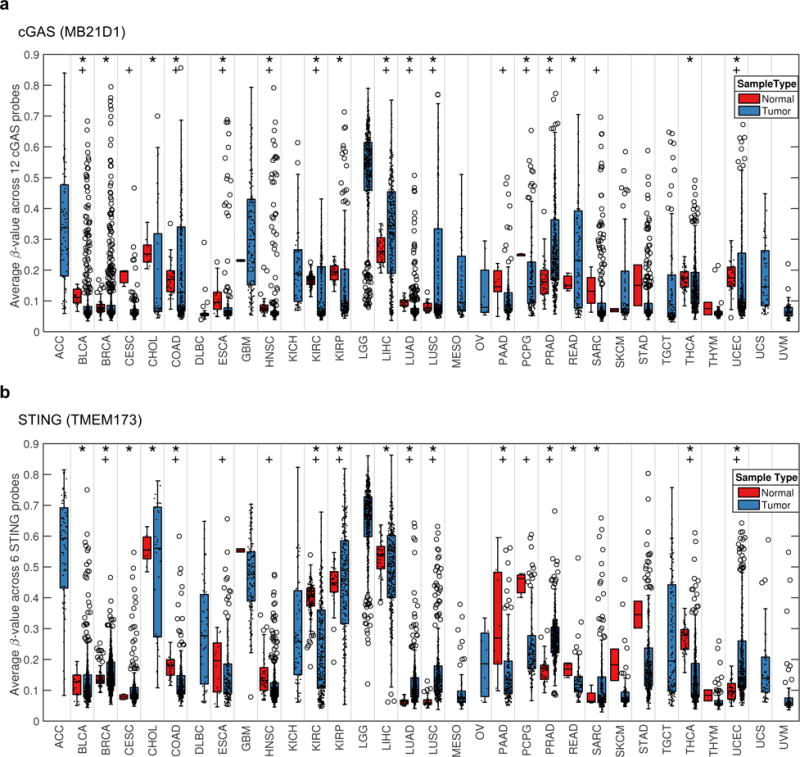
The production of cytokines in response to DNA-damage events may be an important host defense response to help prevent the escape of pre-cancerous cells. The innate immune pathways involved in these events are known to be regulated by cellular molecules such as stimulator of interferon genes (STING), which controls type I interferon and pro-inflammatory cytokine production in response to the presence of microbial DNA or cytosolic DNA that has escaped from the nucleus. STING signaling has been shown to be defective in a variety of cancers, such as colon cancer and melanoma, actions that may enable damaged cells to escape the immunosurveillance system. Here, we report through examination of databases that STING signaling may be commonly suppressed in a greater variety of tumors due to loss-of-function mutation or epigenetic silencing of the STING/cGAS promoter regions. In comparison, RNA activated innate immune pathways controlled by RIG-I/MDA5 were significantly less affected. Examination of reported missense STING variants confirmed that many exhibited a loss-of-function phenotype and could not activate cytokine production following exposure to cytosolic DNA or DNA-damage events. Our data imply that the STING signaling pathway may be recurrently suppressed by a number of mechanisms in a considerable variety of malignant disease and be a requirement for cellular transformation.


Conflict of interest statement

Conflict of Interest

No potential conflicts of interest were disclosed.

Figures

Figure 1
Figure 1
STING and cGAS genes are mutated in a variety of human tumors. (a and b) We searched three databases, eBioPortal, COSMIC, and ICGC that provide cancer genomics data to find mutations in STING and cGAS genes. The missense mutations in red were tested in the following studies. TM; transmembrane, DD; dimerization domain, CTT; C-terminal tail, Mab21; Mab21 domain. (c) The mutations we tested in the following studies are most likely tumor-specific mutations. We confirmed if the missense mutations exist in the general population using ExAC database. Case indicates how many times the mutations were found in human tumors.
Figure 2
Figure 2
STING mutants found in human tumors fail to activate dsDNA-induced inflammation. (a) The indicated plasmids were transfected into HEK293T cells with reporter plasmids (IFNβ-luc and TK-luc). After 24 hr, the luciferase activity in the cell lysates was measured. (b) Primary Sting−/− MEF cells were reconstituted with the indicated STING mutants using retrovirus. IFNβ in the supernatants was measured by ELISA after treated with Poly I:C (2 μg/ml) or dsDNA (4 μg/ml) for 16 hr. (c and d) The reconstituted Sting−/− MEF cells were treated with dsDNA (4 μg/ml) for the indicated times (c). Wester blots were performed with the indicated antibodies. (e) After treated with dsDNA as described in Figure 2c, the reconstituted Sting−/− MEF cells were stained with antibodies for STING and an ER marker, calreticulin, to observe the localization of STING using a confocal microscope. (f) The reconstituted Sting−/− MEF cells were infected with HSV-1 or HSV-1 γ34.5 for 24 hr and then the viral titer was determined by plaque assay. Data shown here are the averages ± SD (n = 3). Asterisks indicate significant difference (p < 0.05) compared to hSTING (a and b) or pBabe (f) determined by Student’s t-test (ns; not significant, ND; not detected).
Figure 3
Figure 3
cGAS mutants, R376Q and E383K, found in human tumors cannot synthesize cGAMP. (a) cGAS or its mutants were expressed into HEK293T cells with human STING. As described in Figure 2a, the luciferase activity was measured. The expression of STING and cGAS was confirmed by western blots. (b and c) Primary cGas−/− MEF cells were reconstituted with the indicated cGAS mutants as described in Figure 2b and then treated with dsDNA (4 μg/ml) for 6 hr (b) or 24 hr (c). Wester blots were performed with the indicated antibodies (b) or IFNβ was measured by ELISA (c). (d) The cell lysates from HEK293T cells transfected with the indicated plasmids were incubated with biotin-labeled dsDNA and then subjected to precipitation with neutravidin-conjugated beads. After washing, precipitated proteins were eluted by boiling in SDS-sample buffer and then western blots were performed with the anti-FLAG antibody. (e) cGAS, E376Q, or E383K was expressed in HEK293T cells, which was verified by wester blots. cGAMP was purified from the cell lysates and quantified by LC/MS with calibration samples that were prepared by spiking known amount of cGAMP into the cell lysates from HEK293T cells. Cyclic di-GMP was added as an internal control to the cell lysates before purification of cGAMP to validate the purification process. Data shown here are the averages ± SD (n = 3). Asterisks indicate significant difference (p < 0.05) determined by Student’s t-test (ND; not detected).
Figure 4
Figure 4
STING mutants are dominant-negative mutants. (a) The luciferase activity in the cell lysates was measured as described in Figure 2a after the transfection of the indicated plasmids into HEK293T cells. The numbers under the graph indicate the amount of transfected plasmids (μg). (b and c) Primary Sting−/− MEF cells were reconstituted using retrovirus vectors encoding STING mutants (puromycin resistant) and wild-type human STING (hygromycin resistant). After drug selection with puromycin and hygromycin, the reconstituted MEF cells were treated with dsDNA (4 μg/ml) for 16 hr. IFNβ in the supernatants was measured by ELISA (b) and the cells were stained with the indicated antibodies to observer the localization of STING as described in Figure 2d (c). (d) HEK293T-hSTING, which stably expresses wild-type human STING, were transfected with the indicated plasmids and the luciferase activity in the cell lysates was measured. The numbers under the graph indicate the amount of transfected plasmids (μg). Data shown here are the averages ± SD (n = 3). Asterisks indicate significant difference (p < 0.05) compared to hSTING (A and B) or cGAS (B) transfected samples determined by Student’s t-test (ns; not significant).
Figure 5
Figure 5
STING mutants fail to respond to DNA-adduct forming agents. The reconstituted primary Sting−/− MEF cells with empty vector (pBabe), hSTING, R169W, or P203S were treated DMBA (20 μg/ml) or cisplatin (10 μM) for 48 hr. Total RNA was extracted and realtime PCR was performed with the indicated probes after cDNA synthesis. Data shown here are the averages ± SD (n = 3). Asterisks indicate significant difference (p < 0.05) determined by Student’s t-test.
Figure 6
Figure 6
cGAS and STING expression is suppressed by methylation in a pan-tumor analysis. (a) The methylation data 32 different tumors types were obtained from TCGA. The methylation level for the 16 probes available for cGAS and the 11 probes available for STING on Illumina 450K chip are shown as box plots for normal samples (red) and tumor samples (blue). The x-axis indicates methylation level by β-value, ranging from 0 to 1 where 0 means no methylation and 1 means 100% methylated. The y-axis shows the genomic position (left axis) and probe ID (right axis) for all the probes. The colored columns indicate CpG island and gene body type as described in the figure. (b) The gene expression for cGAS or STING versus the average β-value across selected 12 probes for cGAS or 6 probes for STING.
Figure 7
Figure 7
cGAS and STING show a large variability in methylation for a variety of human tumors. (a and b) The average methylation level across 32 tumor types are shown in box plots for cGAS (a) or STING (b). Each individual sample is also represented by a dot (.) and outlier samples are indicated by circles (o). The statistical analysis was performed by Bartlett’s test (*; p<0.05) and Fisher’s exact test for enrichment of tumors in the 75th percentile (+; p<0.05). Abbreviation for each tumor type is shown in Supplementary Information.

References

    1. Woo SR, Corrales L, Gajewski TF. Innate immune recognition of cancer. Annu Rev Immunol. 2015;33:445–474. - PubMed
    1. Xia T, Konno H, Ahn J, Barber GN. Deregulation of STING Signaling in Colorectal Carcinoma Constrains DNA Damage Responses and Correlates With Tumorigenesis. Cell reports. 2016;14:282–297. - PMC - PubMed
    1. Ahn J, Xia T, Konno H, Konno K, Ruiz P, Barber GN. Inflammation-driven carcinogenesis is mediated through STING. Nature communications. 2014;5:5166. - PMC - PubMed
    1. Xia T, Konno H, Barber GN. Recurrent Loss of STING Signaling in Melanoma Correlates with Susceptibility to Viral Oncolysis. Cancer research. 2016;76:6747–6759. - PubMed
    1. Barber GN. STING: infection, inflammation and cancer. Nat Rev Immunol. 2015;15:760–770. - PMC - PubMed

Publication types

MeSH terms