. 2018 Apr;37(14):1911-1925.
doi: 10.1038/s41388-017-0099-6. Epub 2018 Jan 25.

A Carcinogen-induced mouse model recapitulates the molecular alterations of human muscle invasive bladder cancer

Affiliations

A Carcinogen-induced mouse model recapitulates the molecular alterations of human muscle invasive bladder cancer

Damiano Fantini et al. Oncogene. 2018 Apr.

Abstract

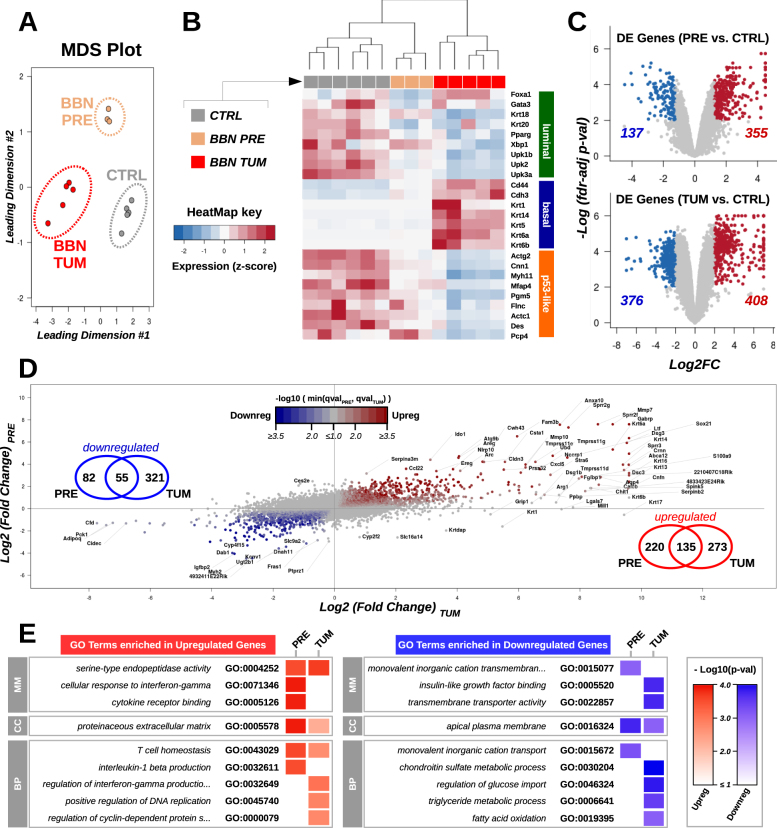
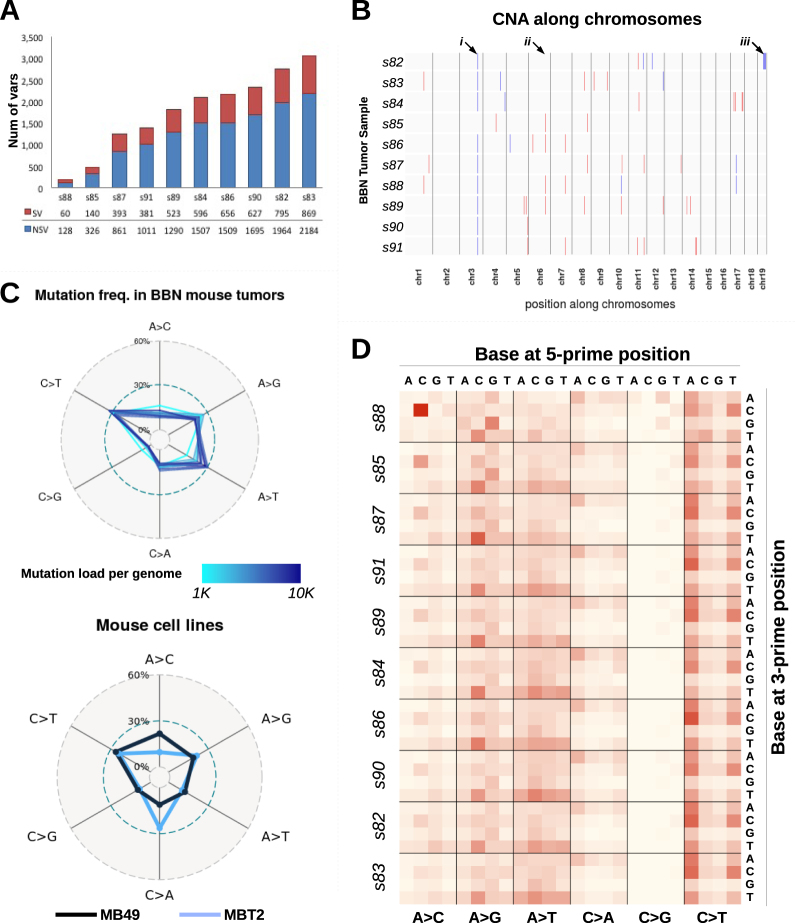
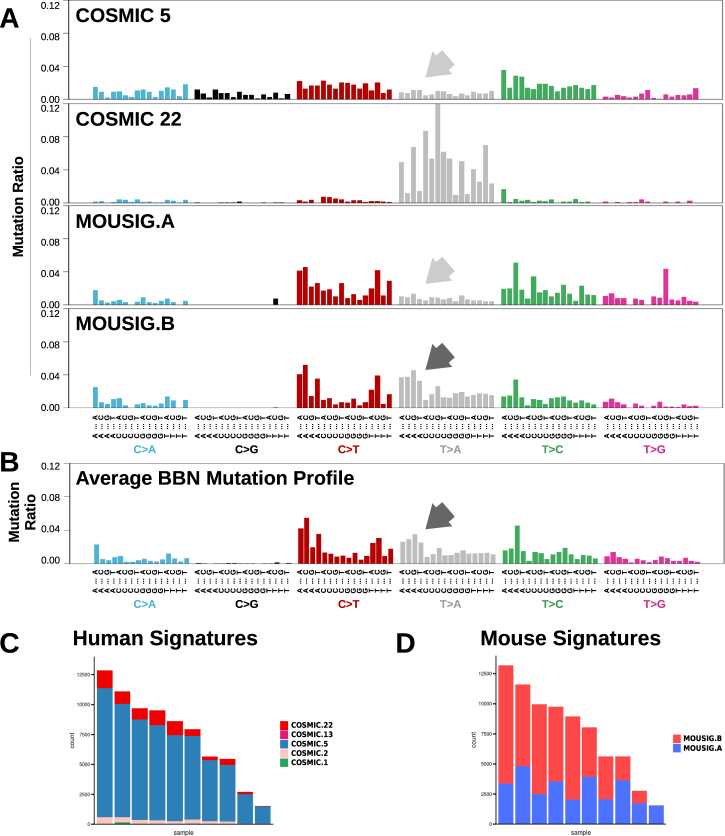
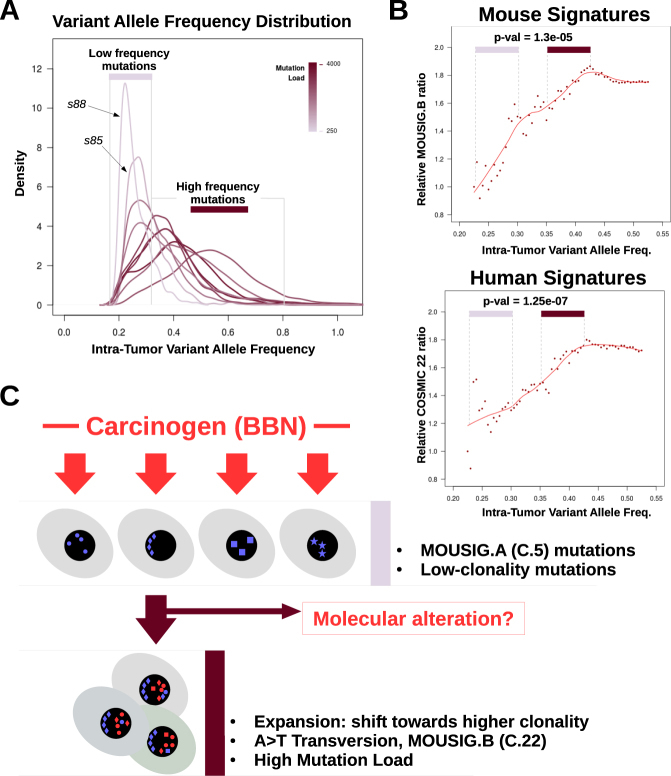
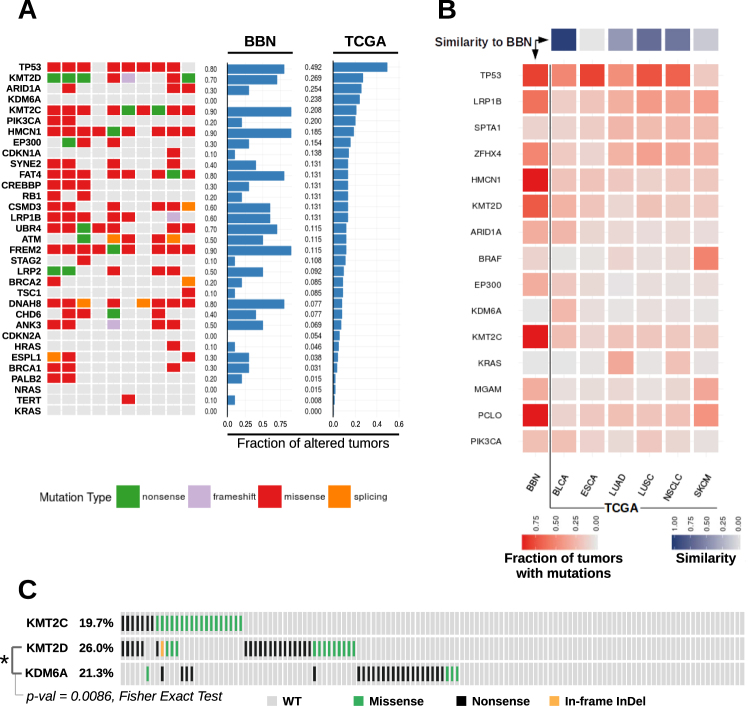
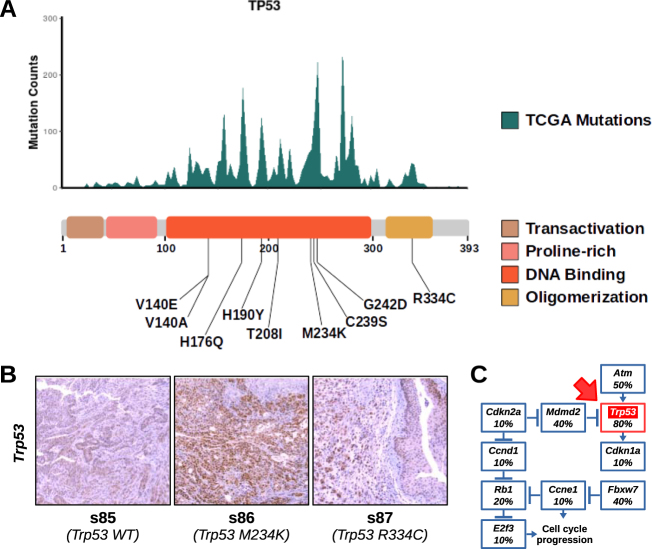
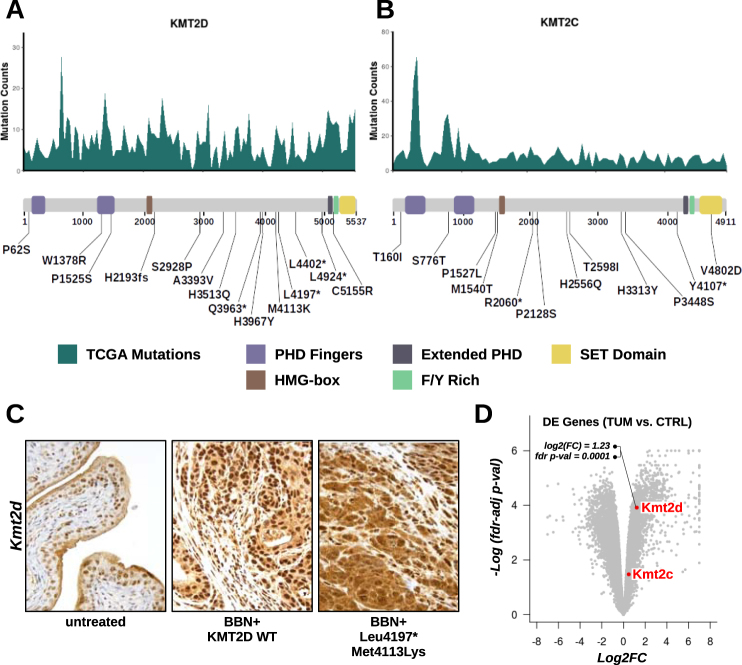
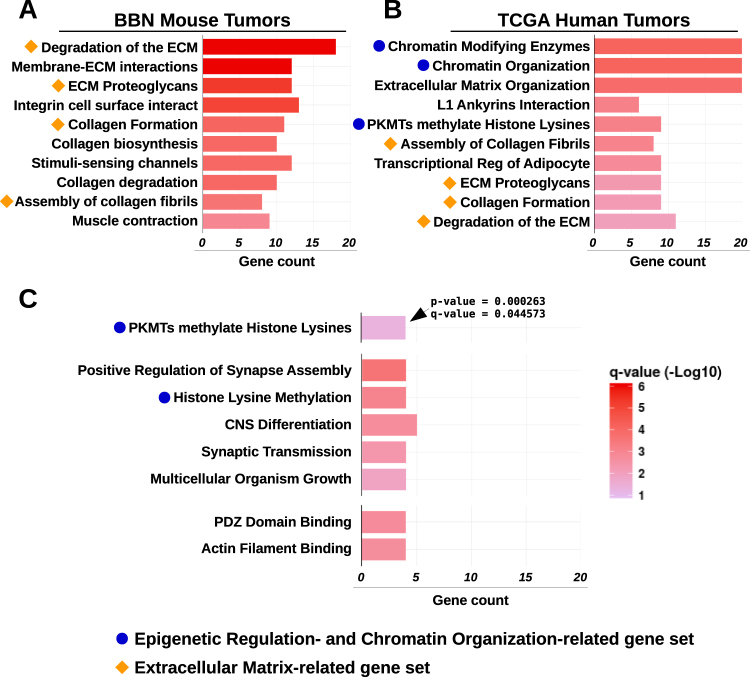
The N-butyl-N-(4-hydroxybutyl)-nitrosamine (BBN) mouse model is an attractive model system of muscle-invasive bladder cancer (MIBC) as it recapitulates the histology of human tumors in a background with intact immune system. However, it was unknown whether this carcinogen-induced model also mimicked human MIBC at the molecular and mutational level. In our study, we analyzed gene expression and mutational landscape of the BBN model by next-generation sequencing followed by a bioinformatic comparison to human MIBC using data from The Cancer Genome Atlas and other repositories. BBN tumors showed overexpression of markers of basal cancer subtype, and had a high mutation burden with frequent Trp53 (80%), Kmt2d (70%), and Kmt2c (90%) mutations by exome sequencing, similar to human MIBC. Many variants corresponded to human cancer hotspot mutations, supporting their role as driver mutations. We extracted two novel mutational signatures from the BBN mouse genomes. The integrated analysis of mutation frequencies and signatures highlighted the contribution of aberrations to chromatin regulators and genetic instability in the BBN tumors. Together, our study revealed several similarities between human MIBC and the BBN mouse model, providing a strong rationale for its use in molecular and drug discovery studies.


Conflict of interest statement

The authors declare that they have no competing interests.

Figures

Fig. 1
Fig. 1
Gene expression profiles of BBN bladder tumors. a Gene expression in normal bladders (CTRL, gray, n = 6), precancerous bladders from mice exposed to BBN for 4 weeks (BBN PRE, gold, n = 3), and bladders with tumor (BBN TUM, red, n = 5) was assessed by RNA-seq followed by multidimensional scaling analysis. b Heatmap showing expression levels (median-based z-scores) of a list of markers of luminal-, basal-, and p53-like molecular cancer subtypes in bladder samples. c Volcano plots highlighting genes over- (red) and under- (blue) expressed in pre-cancerous (top) or tumoral (bottom) samples compared to control bladders. The number of differentially expressed genes in precancerous bladders and in the BBN tumors is reported. d Scatter plot of gene expression fold changes in the precancerous bladders against controls (y-axis) compared to BBN tumors against controls (x-axis). Point color tracks with the negative logarithm of the bigger false discovery rate (fdr)-adjusted p-value associated with the corresponding gene in the pre-cancerous bladder or in the BBN tumors against controls. Venn diagrams indicate the number of genes consistently up or downregulated. e Heatmap summarizing GO terms enriched in the lists of differentially expressed genes in the pre-cancerous and tumor samples against controls. Color intensity tracks with the negative logarithm of the corresponding p-value (classic Fisher’s exact test)
Fig. 2
Fig. 2
Mutation profiles of BBN bladder tumors. a All mice (n = 10) treated with BBN for 20 weeks developed bladder tumors. After sacrifice, genomic DNA was extracted from the tumor-containing bladders, and then submitted for sequencing. Bars indicate the number of variants identified in each mouse tumor, including both synonymous (SV, red) and non-synonymous (NSV, blue) mutations. b Plot summarizing copy number alterations (CNA) identified in the BBN tumor genomes by Control-FREEC analysis. Blue regions indicate DNA losses, red regions indicate DNA gains. Major or consistent CNA are highlighted by arrows: (i) chr3: affecting Sec24d gene; (ii) chr6: affecting Slc6a11 gene; (iii) a shallow deletion of chr19qC3 was detected in only one tumor, s82. c Frequencies of nucleotide conversion for each BBN tumor (top) and two mouse bladder cell lines (bottom) are displayed in the radar charts. Line color corresponds to mutation load (top) or identifies the cell line (bottom). d Frequency of nucleotide conversions within the tri-nucleotide context is displayed in the heat map. Conversions are grouped by mutation type (A>C, A>G, A>T, C>A, C>G, C>T), with different 5′ bases organized column-wise and 3′ bases organized row-wise. Samples are ordered according to mutation load, revealing specific mutations that are directly (i.e., N[A>T]T) or inversely (i.e., C[A>C]C, G[A>G]G) correlated with mutation load
Fig. 3
Fig. 3
Mutational signatures operating in BBN bladder tumors. a Mutational profiles corresponding to COSMIC signatures 5 and 22, and to newly-extracted signatures from mouse BBN-induced tumors, namely MOUSIG-A and MOUSIG-B. Arrows indicate T>A transversions that are absent in signatures COSMIC-5 and MOUSIG-A (light gray arrows), but are enriched in MOUSIG-B (dark gray arrow). Single nucleotide variants were grouped by the tri-nucleotide context. b Aggregated mutational profile of ten BBN tumors. Dark gray arrow indicates a group of T>A transversions matching a mutational pattern from MOUSIG-B signature. Single nucleotide variants were grouped by the tri-nucleotide context. c, d Contributions of COSMIC or de novo extracted MOUSIG mutational signatures to individual tumors. Each bar represents a BBN tumor and the vertical axis denotes the number of mutations imputed to each signature (blue: COSMIC-5 or MOUSIG-A; red: COSMIC-22 or MOUSIG-B)
Fig. 4
Fig. 4
Relationship between mutation load and intra-tumor variant allele frequencies in BBN tumors. a Density plot showing the distributions of intra-tumor variant frequencies for each BBN tumor. Peaks shifting toward the right side of the x-axis indicate accumulation of mutations that are shared by a larger fraction of cancer cells in the tumor (clonal expansion). Line color corresponds to mutation load. Area under the curve (AUC) of each line was set to unity. b Scatterplot showing the relative abundance of MOUSIG-B (top) or COSMIC-22 (bottom) signatures as function of the intra-tumor variant allele frequency. Points in the frequency ranges of 0.225–0.300 (low frequency mutations) and 0.350–0.425 (high frequency mutations) were compared via t-test, and p-values were 1.3e-05 and 1.27e-07, respectively. Trendlines were computed using LOESS (red lines). c Diagram summarizing the hypothesized model that may explain genetic instability in the BBN model. Geometric shapes represent mutations acquired as consequence of processes linked to MOUSIG-A (blue) and MOUSIG-B (red) mutational signatures
Fig. 5
Fig. 5
Bladder cancer gene mutations across BBN and human tumors. a Tile chart displaying cancer gene alterations in 10 BBN tumor genomes (green, nonsense; purple, frameshift; red, missense; orange splicing site; gray, no mutation). Overall gene mutation rates from the BBN dataset and the human TCGA bladder cancer dataset are displayed in the barplots. b TCGA datasets with overall mutation rates comparable to MIBC were analyzed (BLCA bladder cancer, ESCA Esophageal Carcinoma, LUAD lung adenocarcinoma, LUSC Lung Squamous Cell Carcinoma, NSCLC Non-Small-Cell Lung Cancer, SKCM melanoma). Mutation rates were computed for each tumor type and for each of the 15 genes having the highest overall mutation frequency in the six datasets. Central heatmap displaying mutation rates by gene (rows) across the BBN dataset and TCGA datasets (columns). Square color (red) intensity denotes mutation rate. Top: similarity scores of each TCGA dataset to the BBN dataset were computed as [1— (scaled Canberra distance)] and are displayed via a 1-row heatmap. Square color (purple) intensity denotes the relative similarity to the BBN profile. c Variants occurring in the KMT2C, KMT2D and KDM6A genes in the human bladder cancer TCGA dataset, visualized by oncoprint format. Mutual exclusivity of KMT2D and KDM6A mutations was tested via Fisher Exact Test (p-value = 0.0086)
Fig. 6
Fig. 6
Trp53 mutations in BBN tumors. a Top. Histogram displaying TP53 hotspot mutations from aggregate TCGA genomes (missense, frameshift, and nonsense mutations were included). Bottom. List of variants found in Trp53 mapped to a diagram of the functional domains of the protein. b IHC for Trp53 was performed on tissue sections from normal bladders or BBN tumors expressing wild type (left) or mutant (M234K, center; R334C, right) Trp53. c Diagram displaying the frequency of tumors with mutations in different genes belonging to the Trp53 pathway. Trp53 box is highlighted in red (red arrow)
Fig. 7
Fig. 7
Kmt2c and Kmt2d Mutations in the BBN tumors. (a, b) Top. Histogram displaying Kmt2d (a) or Kmt2c (b) frequently mutated regions calculated from aggregate TCGA genomes (missense, frameshift, and nonsense mutations were included). Bottom. List of variants found in Kmt2d (a) or Kmt2c (b) mapped to a diagram of the functional domains of the proteins. c IHC for Kmt2d was performed on tissue sections from normal bladders (left) or from BBN tumors expressing wild type (center) or mutant (L4197*, M4113K: right) Kmt2d. d Volcano plot showing upregulation of Kmt2d by RNA-seq in BBN tumors compared to control bladders (log2 fold change = 1.23; fdr-adjusted p-value = 0.0001)
Fig. 8
Fig. 8
Pathway enrichment analysis of genes frequently mutated in human and mouse bladder tumors. a Pathway enrichment analysis of commonly mutated genes in BBN tumors against terms from Reactome DB. Orange shapes identify terms related to extracellular matrix. b Pathway enrichment analysis of commonly mutated genes in TCGA tumors against terms from the Reactome DB. Orange shapes identify terms related to extracellular matrix that were identical to those revealed by pathway analysis from BBN genomes. Blue dots indicate terms linked to epigenetic regulation and chromatin organization. c Pathway enrichment analysis of genes accumulating high-impact mutations in BBN tumors against terms from Reactome DB (top), GO molecular function (center) and GO cell component (bottom). Blue dots indicate terms linked to epigenetic regulation and chromatin organization. Bars indicate the number of significant genes (gene count) identified in the list of highly mutated genes and belonging to each GO/ReactomeDB term. Bar color corresponds to −log10(fdr-adjusted p-value). All terms displayed in the charts met statistical significance criteria of q-value < 0.05

References

    1. Siegel RL, Miller KD, Jemal A. Cancer statistics, 2016. CA Cancer J Clin. 2016;66:7–30. doi: 10.3322/caac.21332. - DOI - PubMed
    1. Horstmann M, Witthuhn R, Falk M, Stenzl A. Gender-specific differences in bladder cancer: a retrospective analysis. Gend Med. 2008;5:385–94. doi: 10.1016/j.genm.2008.11.002. - DOI - PubMed
    1. Zhang Y, Zhu C, Curado MP, Zheng T, Boyle P. Changing patterns of bladder cancer in the USA: evidence of heterogeneous disease. BJU Int. 2012;109:52–6. doi: 10.1111/j.1464-410X.2011.10283.x. - DOI - PMC - PubMed
    1. Stein JP, Lieskovsky G, Cote R, Groshen S, Feng AC, Boyd S, et al. Radical cystectomy in the treatment of invasive bladder cancer: long-term results in 1,054 patients. J Clin Oncol. 2001;19:666–75. doi: 10.1200/JCO.2001.19.3.666. - DOI - PubMed
    1. Rosenberg JE, Hoffman-Censits J, Powles T, van der Heijden MS, Balar AV, Necchi A, et al. Atezolizumab in patients with locally advanced and metastatic urothelial carcinoma who have progressed following treatment with platinum-based chemotherapy: a single-arm, multicentre, phase 2 trial. Lancet. 2016;387:1909–20. doi: 10.1016/S0140-6736(16)00561-4. - DOI - PMC - PubMed

Publication types

MeSH terms