

Social Determinants of Health in the United States: Addressing Major Health Inequality Trends for the Nation, 1935-2016
- PMID: 29367890
- PMCID: PMC5777389
- DOI: 10.21106/ijma.236
Social Determinants of Health in the United States: Addressing Major Health Inequality Trends for the Nation, 1935-2016
Abstract
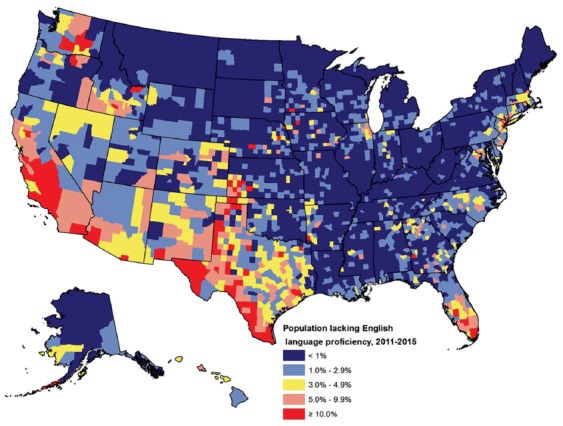
Objectives: This study describes key population health concepts and examines major empirical trends in US health and healthcare inequalities from 1935 to 2016 according to important social determinants such as race/ethnicity, education, income, poverty, area deprivation, unemployment, housing, rural-urban residence, and geographic location.
Methods: Long-term trend data from the National Vital Statistics System, National Health Interview Survey, National Survey of Children's Health, American Community Survey, and Behavioral Risk Factor Surveillance System were used to examine racial/ethnic, socioeconomic, rural-urban, and geographic inequalities in health and health care. Life tables, age-adjusted rates, prevalence, and risk ratios were used to examine health differentials, which were tested for statistical significance at the 0.05 level.
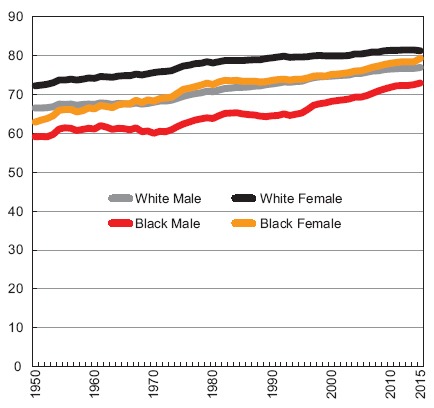
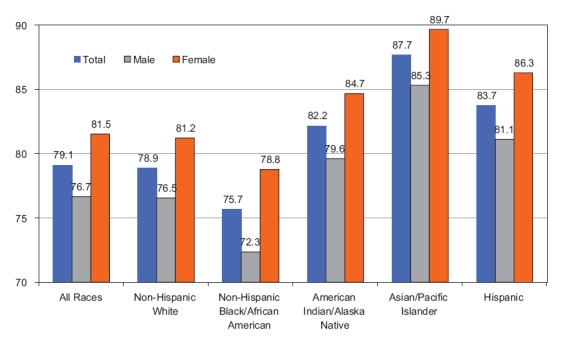
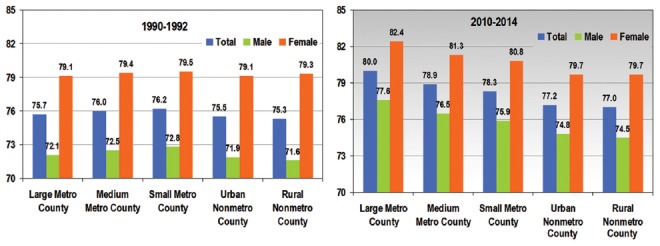
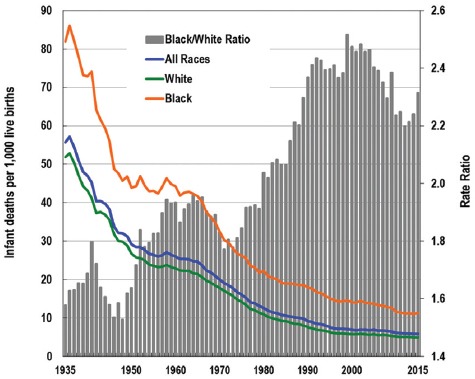
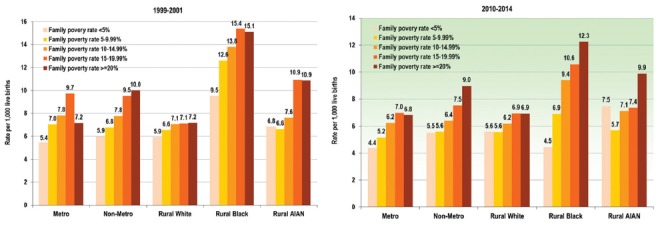
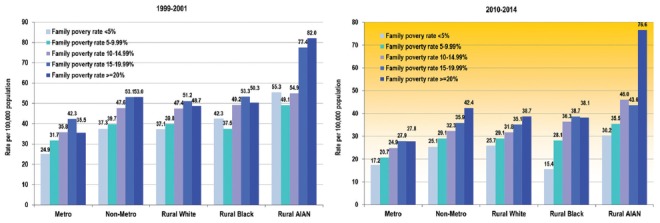
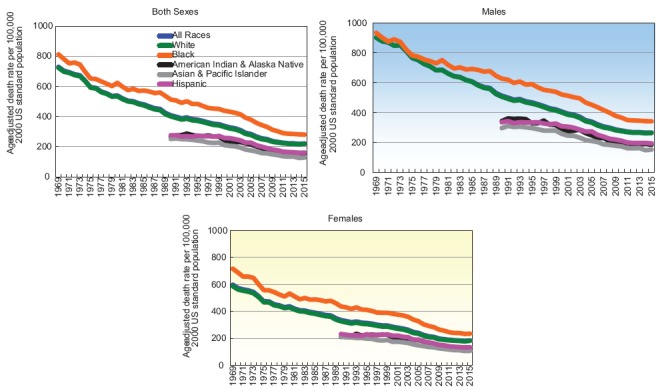
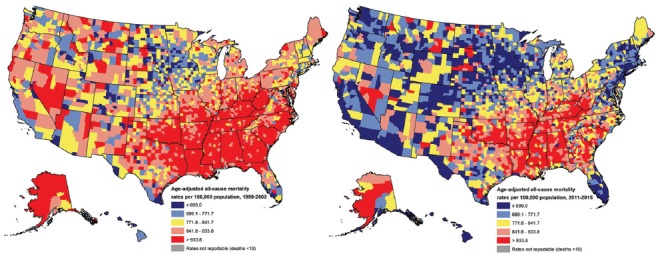
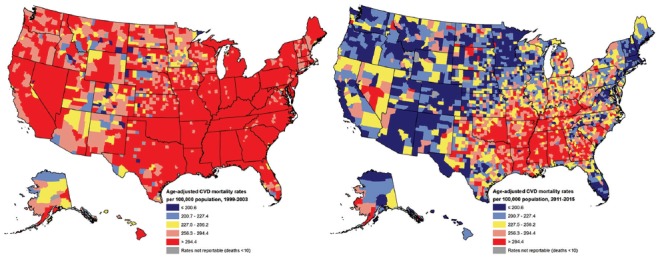
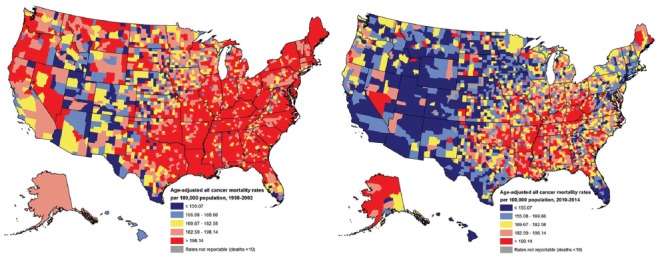
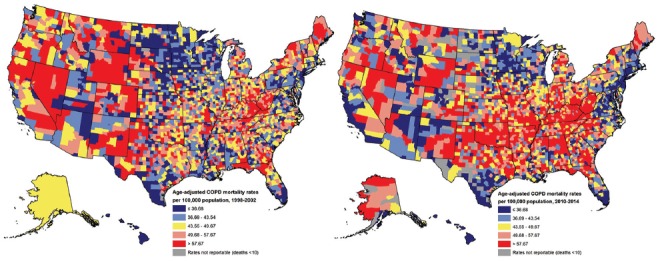
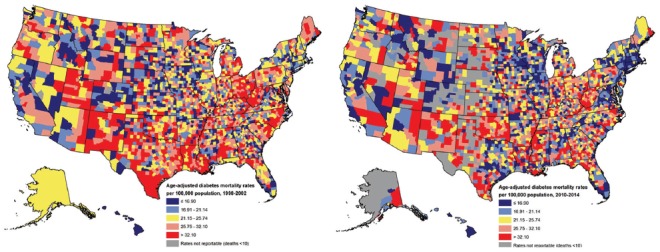
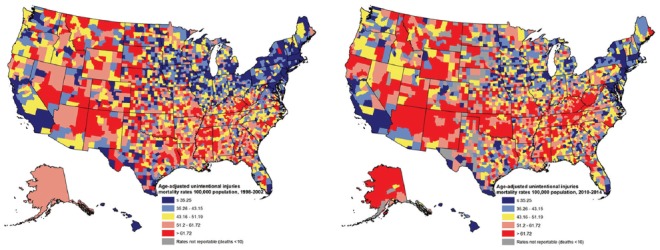
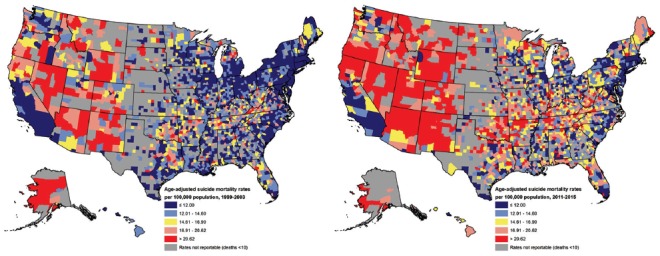
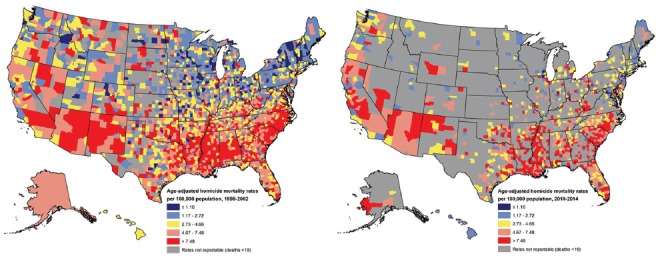
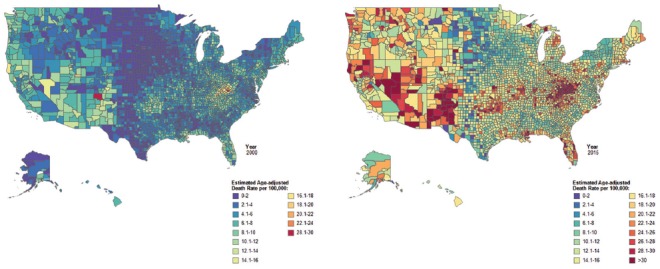
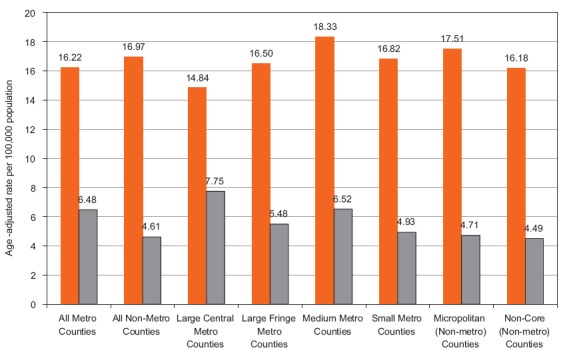
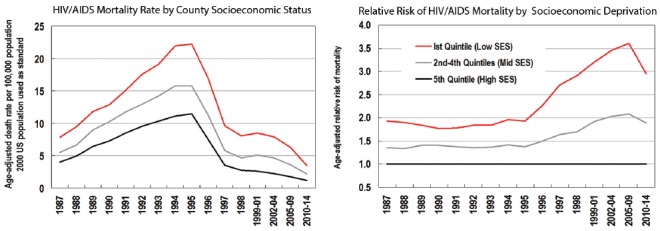
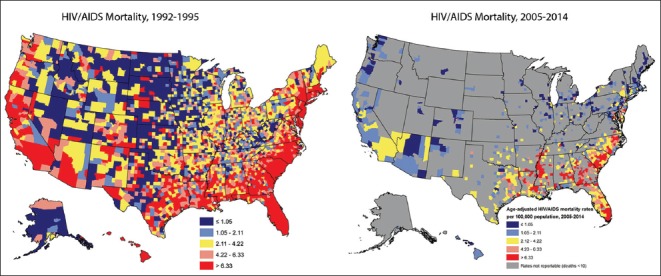
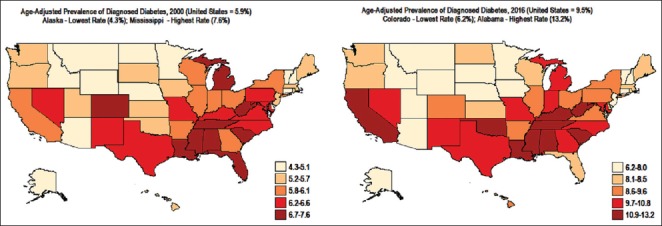
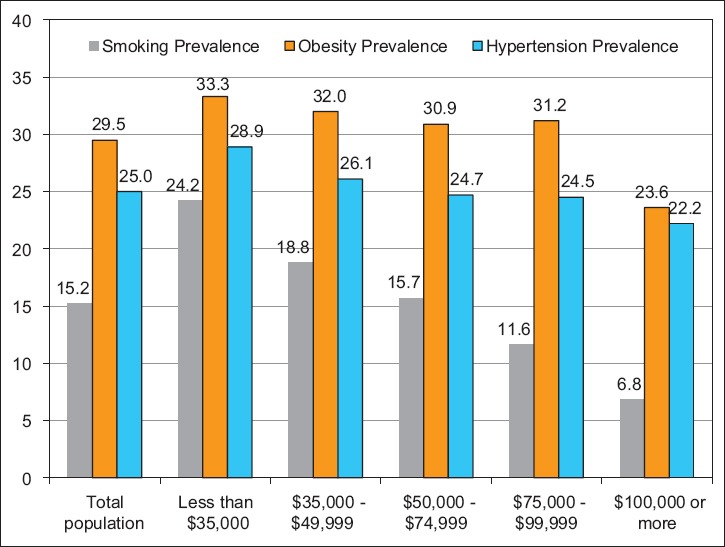
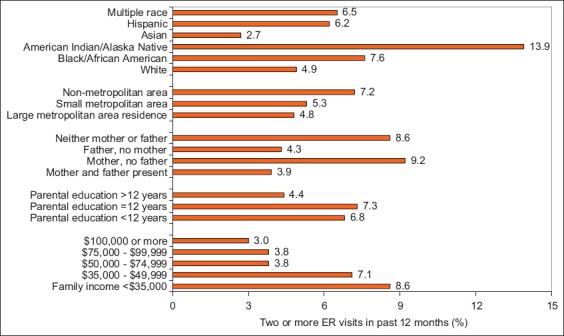
Results: Life expectancy of Americans increased from 69.7 years in 1950 to 78.8 years in 2015. However, despite the overall improvement, substantial gender and racial/ethnic disparities remained. In 2015, life expectancy was highest for Asian/Pacific Islanders (87.7 years) and lowest for African-Americans (75.7 years). Life expectancy was lower in rural areas and varied from 74.5 years for men in rural areas to 82.4 years for women in large metro areas, with rural-urban disparities increasing during the 1990-2014 time period. Infant mortality rates declined dramatically during the past eight decades. However, racial disparities widened over time; in 2015, black infants had 2.3 times higher mortality than white infants (11.4 vs. 4.9 per 1,000 live births). Infant and child mortality was markedly higher in rural areas and poor communities. Black infants and children in poor, rural communities had nearly three times higher mortality rate compared to those in affluent, rural areas. Racial/ethnic, socioeconomic, and geographic disparities were particularly marked in mortality and/or morbidity from cardiovascular disease, cancer, diabetes, COPD, HIV/AIDS, homicide, psychological distress, hypertension, smoking, obesity, and access to quality health care.
Conclusions and global health implications: Despite the overall health improvement, significant social disparities remain in a number of health indicators, most notably in life expectancy and infant mortality. Marked disparities in various health outcomes indicate the underlying significance of social determinants in disease prevention and health promotion and necessitate systematic and continued monitoring of health inequalities according to social factors. A multi-sectoral approach is needed to tackle persistent and widening health inequalities among Americans.
Keywords: Chronic Disease; Health Care; Health Disparities; Leading Causes Of Death; Life Expectancy; Race/Ethnicity; Social Determinants; Socioeconomic Status.
Conflict of interest statement
Conflicts of Interest: The authors declare that they have no conflicts of interest. Financial Disclosure: None to report. Ethics Approval: All analyses were conducted using public-use data and were thus exempt from the institutional review board (IRB) approval.
Figures
Similar articles
-
Trends and Social Inequalities in Maternal Mortality in the United States, 1969-2018.Int J MCH AIDS. 2021;10(1):29-42. doi: 10.21106/ijma.444. Epub 2020 Dec 30. Int J MCH AIDS. 2021. PMID: 33442490 Free PMC article.
-
Ten Americas: a systematic analysis of life expectancy disparities in the USA.Lancet. 2024 Dec 7;404(10469):2299-2313. doi: 10.1016/S0140-6736(24)01495-8. Epub 2024 Nov 21. Lancet. 2024. PMID: 39581204 Free PMC article.
-
Infant Mortality in the United States, 1915-2017: Large Social Inequalities have Persisted for Over a Century.Int J MCH AIDS. 2019;8(1):19-31. doi: 10.21106/ijma.271. Int J MCH AIDS. 2019. PMID: 31049261 Free PMC article.
-
Annual summary of vital statistics--1995.Pediatrics. 1996 Dec;98(6 Pt 1):1007-19. Pediatrics. 1996. PMID: 8951248 Review.
-
Health inequalities in a middle-income country: a systematic review of the Costa Rican case.Front Public Health. 2024 Aug 21;12:1397576. doi: 10.3389/fpubh.2024.1397576. eCollection 2024. Front Public Health. 2024. PMID: 39234081 Free PMC article.
Cited by
-
Inequities in Access to Tricuspid Valve Treatments: The Impact of Procedure and Volume Requirements.JACC Adv. 2024 Oct 18;3(11):101342. doi: 10.1016/j.jacadv.2024.101342. eCollection 2024 Nov. JACC Adv. 2024. PMID: 39469608 Free PMC article.
-
The Impact of Neighborhood Deprivation on the Survival Rates of Patients with Cancer in Korea.Healthcare (Basel). 2023 Dec 15;11(24):3171. doi: 10.3390/healthcare11243171. Healthcare (Basel). 2023. PMID: 38132061 Free PMC article.
-
Race/Ethnicity and County-Level Social Vulnerability Impact Hospice Utilization Among Patients Undergoing Cancer Surgery.Ann Surg Oncol. 2021 Apr;28(4):1918-1926. doi: 10.1245/s10434-020-09227-6. Epub 2020 Oct 14. Ann Surg Oncol. 2021. PMID: 33057860
-
Improving Patient Satisfaction in the Hispanic American Community.Cureus. 2022 Aug 7;14(8):e27739. doi: 10.7759/cureus.27739. eCollection 2022 Aug. Cureus. 2022. PMID: 36106297 Free PMC article. Review.
-
Care integration goes Beyond Co-Location: Creating a Medical Home.Adm Policy Ment Health. 2024 Jan;51(1):123-133. doi: 10.1007/s10488-023-01317-3. Epub 2023 Nov 28. Adm Policy Ment Health. 2024. PMID: 38015324
References
-
- US Department of Health and Human Services. Healthy People 2020. http://www.healthypeople.gov/2020/default.aspx . - PubMed
-
- National Center for Health Statistics. Health, United States, 2011 with Special Feature on Socioeconomic Status and Health. Hyattsville, MD: U.S. Department of Health and Human Services; 2012. - PubMed
-
- National Center for Health Statistics. Health, United States, 2015 with Special Feature on Racial and Ethnic Health Disparities. Hyattsville, MD: US Department of Health and Human Services; 2016. - PubMed
-
- US Department of Health and Human Services. Eliminating Health Disparities in the United States. Rockville, Maryland: 2000. Nov, Health Resources and Services Administration.
-
- Health Resources and Services Administration. Maternal and Child Health Bureau. MCH Timeline: History, Legacy and Resources for Education and Practice, In-Depth Issues. Rockville, Maryland: [Accessed March 15 2017]. https://mchb.hrsa.gov/about/timeline/in-depth-2-infant-mortality.asp .
LinkOut - more resources
Full Text Sources
Other Literature Sources
Miscellaneous