

Mortality Risk Along the Frailty Spectrum: Data from the National Health and Nutrition Examination Survey 1999 to 2004
- PMID: 29368330
- PMCID: PMC5849536
- DOI: 10.1111/jgs.15220
Mortality Risk Along the Frailty Spectrum: Data from the National Health and Nutrition Examination Survey 1999 to 2004
Abstract
Objectives: To determine the relationship between frailty and overall and cardiovascular mortality.
Design: Longitudinal mortality analysis.
Setting: National Health and Nutrition Examination Survey (NHANES) 1999-2004.
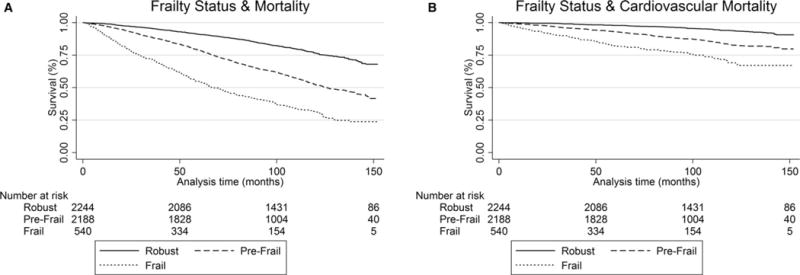
Participants: Community-dwelling older adults aged 60 and older (N = 4,984; mean age 71.1 ± 0.19, 56% female).
Measurements: We used data from 1999-2004 cross-sectional NHANES and mortality data from the National Death Index, updated through December 2011. An adapted version of Fried's frailty criteria was used (low body mass index, slow walking speed, weakness, exhaustion, low physical activity). Frailty was defined as persons meeting 3 or more criteria, prefrailty as meeting 1 or 2 criteria, and robust (reference) as not meeting any criteria. The primary outcome was to evaluate the association between frailty and overall and cardiovascular mortality. Cox proportional hazard models were used to evaluate the association between risk of death and frailty category adjusted for age, sex, race, smoking, education, coronary artery disease, heart failure, nonskin cancer, diabetes, and arthritis.
Results: Half (50.4%) of participants were classified as robust, 40.3% as prefrail, and 9.2% as frail. Fully adjusted models demonstrated that prefrail (hazard ratio (HR) = 1.64, 95% confidence interval (CI) = 1.45-1.85) and frail (HR = 2.79, 95% CI = 2.35-3.30) participants had a greater risk of death and of cardiovascular death (prefrail: HR = 1.84, 95% CI = 1.45-2.34; frail: HR = 3.39, 95% CI = 2.45-4.70).
Conclusion: Frailty and prefrailty are associated with increased risk of death. Demonstrating the association between prefrail status and mortality is the first step to identifying potential targets of intervention in future studies.
Keywords: cardiovascular; frailty; mortality; prefrailty.
© 2018, Copyright the Authors Journal compilation © 2018, The American Geriatrics Society.
Conflict of interest statement
Figures
References
-
- Comans TA, Peel NM, Hubbard RE, et al. The increase in healthcare costs associated with frailty in older people discharged to a post-acute transition care program. Age Ageing. 2016;45:317–320. - PubMed
Publication types
MeSH terms
Grants and funding
LinkOut - more resources
Full Text Sources
Other Literature Sources
