. 2018 Jul;596(14):2681-2698.
doi: 10.1113/JP274964. Epub 2018 Mar 12.

A calcium optimum for cytotoxic T lymphocyte and natural killer cell cytotoxicity

Affiliations

A calcium optimum for cytotoxic T lymphocyte and natural killer cell cytotoxicity

Xiao Zhou et al. J Physiol. 2018 Jul.

Abstract

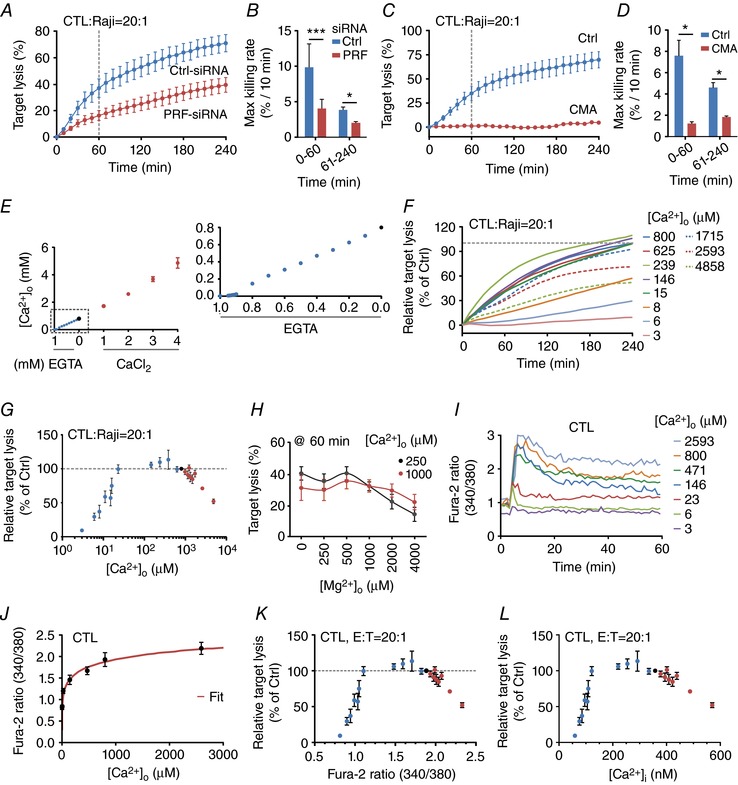
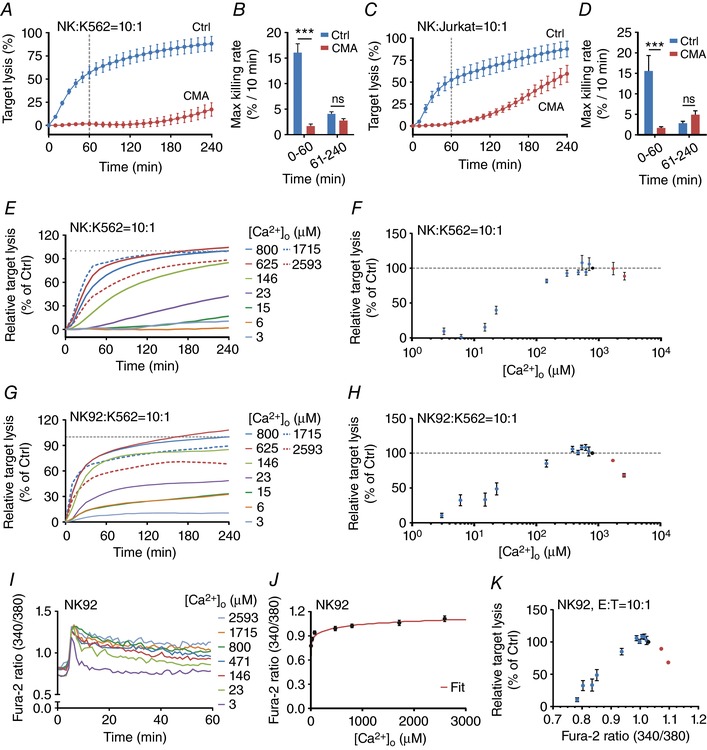
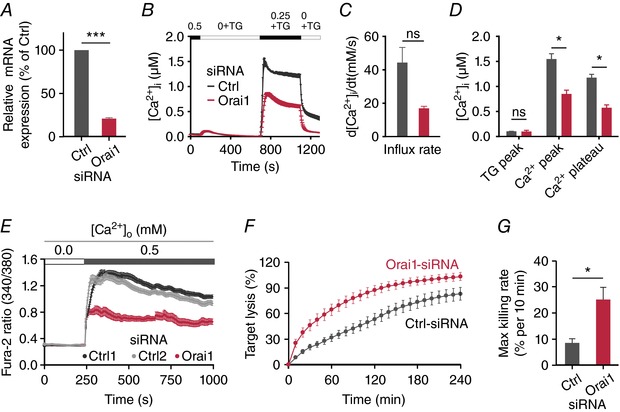
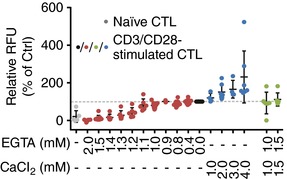
Key points: Cytotoxic T lymphocytes (CTLs) and natural killer (NK) cells are required to eliminate cancer cells. We analysed the Ca2+ dependence of CTL and NK cell cytotoxicity and found that in particular CTLs have a very low optimum of [Ca2+ ]i (between 122 and 334 nm) and [Ca2+ ]o (between 23 and 625 μm) for efficient cancer cell elimination, well below blood plasma Ca2+ levels. As predicted from these results, partial down-regulation of the Ca2+ channel Orai1 in CTLs paradoxically increases perforin-dependent cancer cell killing. Lytic granule release at the immune synapse between CTLs and cancer cells has a Ca2+ optimum compatible with this low Ca2+ optimum for efficient cancer cell killing, whereas the Ca2+ optimum for CTL migration is slightly higher and proliferation increases monotonously with increasing [Ca2+ ]o . We propose that a partial inhibition of Ca2+ signals by specific Orai1 blockers at submaximal concentrations could contribute to tumour elimination.

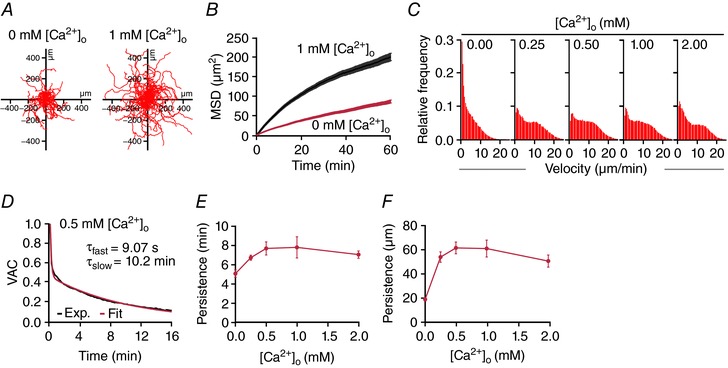
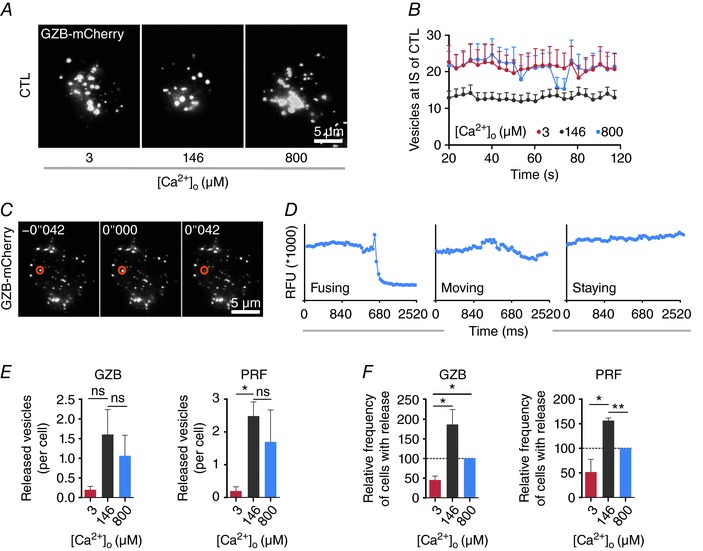
Abstract: Cytotoxic T lymphocytes (CTLs) and natural killer (NK) cells are required to protect the human body against cancer. Ca2+ is a key metabolic factor for lymphocyte function and cancer homeostasis. We analysed the Ca2+ dependence of CTL and NK cell cytotoxicity against cancer cells and found that CTLs have a bell-shaped Ca2+ dependence with an optimum for cancer cell elimination at rather low [Ca2+ ]o (23-625 μm) and [Ca2+ ]i (122-334 nm). This finding predicts that a partial inhibition of Orai1 should increase (rather than decrease) cytotoxicity of CTLs at [Ca2+ ]o higher than 625 μm. We tested this hypothesis in CTLs and indeed found that partial down-regulation of Orai1 by siRNA increases the efficiency of cancer cell killing. We found two mechanisms that may account for the Ca2+ optimum of cancer cell killing: (1) migration velocity and persistence have a moderate optimum between 500 and 1000 μm [Ca2+ ]o in CTLs, and (2) lytic granule release at the immune synapse between CTLs and cancer cells is increased at 146 μm compared to 3 or 800 μm, compatible with the Ca2+ optimum for cancer cell killing. It has been demonstrated in many cancer cell types that Orai1-dependent Ca2+ signals enhance proliferation. We propose that a decrease of [Ca2+ ]o or partial inhibition of Orai1 activity by selective blockers in the tumour microenvironment could efficiently reduce cancer growth by simultaneously increasing CTL and NK cell cytotoxicity and decreasing cancer cell proliferation.

Keywords: cancer cells; cytotoxic immune cells; killing efficiency.


Figures

Figure 1
Figure 1. Ca2+ dependence of perforin‐dependent CTL cytotoxicity
A and B, real‐time killing assay using SEA‐stimulated CTLs as effector and SEA‐pulsed Raji cells as target cells with an E:T ratio of 20:1 (A) and the statistical analysis of the maximal killing rate (B) in perforin down‐regulated CTLs (PRF‐siRNA, n = 4 independent experiments) in comparison to the mean of control siRNA transfected CTLs (Ctrl‐siRNA, n = 4 independent experiments). C and D, real‐time killing assay in CMA‐treated CTLs with SEA‐pulsed Raji cells as target cells with an E:T ratio of 20:1 (C, CMA n = 2 or Ctrl n = 4 independent experiments) and the statistical analysis of the maximal killing rate (D). E, measurement of [Ca2+]o in AIM V medium (black circle) with the addition of EGTA (blue circles) or CaCl2 (red circles) using a Ca2+‐selective electrode or a blood gas analyser. Each data point was measured independently 2–6 times. If no error bars are shown, they are smaller than the points themselves. F, real‐time killing assay with SEA‐pulsed Raji cells as target cells with an E:T ratio of 20:1 in different [Ca2+]o (values as indicated) manipulated by the addition of EGTA (continuous lines) or CaCl2 (dashed lines). Data are normalized to target lysis in 800 μm [Ca2+]o after 4 h. Data are from 2–17 different donors and 4–24 experiments for each [Ca2+]o. G, statistical analysis of the relative target lysis after 4 h plotted against the [Ca2+]o. Data are from 2–17 different donors and 4–24 experiments. Data points in blue represent AIM V medium with added EGTA, in red AIM V medium with added CaCl2 and the data point in black represents AIM V medium. H, statistical analysis of real‐time killing assay with SEA‐pulsed Raji cells as target cells with an E:T ratio of 20:1 at 60 min plotted against different Mg2+ (0–4000 μm) concentrations. The Ca2+ concentration was fixed to 250 and 1000 μm. Data are shown as mean ± SEM from 5–15 donors with 5–18 experiments. I, average Ca2+ ratio values of CTL forming an IS with Raji target cells in AIM V medium with the indicated [Ca2+]o. Fura‐2 ratio kinetics were temporally aligned before averaging. J, steady state values for Fura‐2 ratios of CTLs in contact with target cells (shown in I) plotted against the corresponding [Ca2+]o values. Data were fitted by a Hill equation using Igor Pro 6.22A (red line). K, relative target lysis of CTLs (normalized to target lysis in AIM V medium) is plotted against plateau Fura‐2 ratios during target contact. Fura‐2 ratios were calculated based on [Ca2+]o using the Hill function from Fig. 1J. Data points in blue represent AIM V medium with added EGTA, in red AIM V medium with added CaCl2 and the data point in black represents AIM V medium. L, relative target lysis of CTLs (normalized to target lysis in AIM V medium) plotted against plateau [Ca2+]i of CTLs during contact with target cells. [Ca2+]i values were derived by in situ calibration of Fura‐2 as described in Methods. Data points in blue represent AIM V medium with added EGTA, in red AIM V medium with added CaCl2 and the data point in black represents AIM V medium.
Figure 2
Figure 2. Ca2+ dependence of perforin‐dependent NK cell cytotoxicity
A and B, real‐time killing assay with K562 cells as target cells with an E:T ratio of 10:1 (A) and the statistical analysis of the maximal killing rate (B) of CMA‐treated NK cells (100 nm CMA, 4 h pre‐incubation, n = 3 independent experiments) in comparison to the mean of untreated NK cells (n = 3 independent experiments). C and D, real‐time killing assay of CMA‐treated NK cells with Jurkat T cells as target cells with an E:T ratio of 10:1 (n = 3 independent experiments) and the statistical analysis of the maximal killing rate (D). E–H, Ca2+ dependence of NK cell‐mediated cytotoxicity. Killing kinetics was determined using the real‐time killing assay for primary NK cells (E and F) or NK‐92 cells (G and H). K562 cells were used as target cells with an E:T ratio of 10:1. Target lysis of the condition with AIM V (800 μm [Ca2+]o) at 240 min was set as 100%. The relative target lysis at 240 min from various [Ca2+]o from E and G are plotted against the corresponding [Ca2+]o in F and H, respectively. Results are shown as mean (E and G) or mean ± SEM (F and H) from 3–10 independent experiments. I, average Fura‐2 ratios of NK‐92 cells in contact with K562 target cells at different [Ca2+]o. Fura‐2 ratio kinetics were temporally aligned before averaging. J, plateau values for Fura‐2 ratios of NK‐92 cells in contact with target cells (in Fig. 2I) were determined and plotted against the corresponding [Ca2+]o values. Data were fitted by a Hill equation using Igor Pro 6.22A (red line). K, relative target lysis of NK‐92 cells (normalized to target lysis in AIM V medium) is plotted against plateau Fura‐2 ratios during target contact. Fura‐2 ratios were calculated based on [Ca2+]o using the Hill function from Fig. 2J.
Figure 3
Figure 3. Orai1 down‐regulation increases perforin‐dependent killing
A, relative expression of Orai1 mRNA analysed in control siRNA‐ (Ctrl) and Orai1 siRNA‐ (Orai1) transfected CTLs by qRT‐PCR after 70 h. Expression was normalized to the reference genes TBP and RNAPolII. Data are shown as mean ± SEM from 3 independent experiments. B, store‐operated Ca2+ entry in SEA‐stimulated CTLs transfected with non‐silencing RNA or siRNA against Orai1 for 3 days. Cells were initially kept in buffer solution containing 0.5 mm of CaCl2. After store depletion in Ca2+‐free solution containing thapsigargin (TG, 1 μm), a solution containing 0.25 mm [Ca2+]o was added back to record the influx rate and the resulting plateau value. Subsequently, [Ca2+]o was removed again. C and D, quantification of single cell parameters from B as indicated. E, Ca2+ influx of CTLs upon target recognition 70 h after the transfection with control siRNAs (Ctrl1 (dark grey) or Ctrl2 (light grey)) and Orai1 siRNA (red); 2 × 105 CTLs were loaded with 2 μm Fura‐2/AM and settled on the coverslip in modified Ringer solution containing 0 mm Ca2+. Images were acquired every 5 s at both 340 nm and 380 nm excitation (n = 21 cells Orai1 siRNA, n = 44 cells Ctrl1; n = 74 cells Ctrl2). F, real‐time killing assay with SEA‐pulsed Raji cells as target cells with an E:T ratio of 20:1. CTLs were transfected with Orai1 siRNA (red) or control siRNA (dark grey). Data are from 4 donors (n = 8 independent experiments for two different Ctrl siRNA; n = 4 for Orai1 siRNA). G, statistical analysis of the maximal killing rate from data is shown in F.
Figure 4
Figure 4. Ca2+ dependence of CTL proliferation
A, proliferation of anti‐CD3/anti‐CD28 bead‐stimulated CTLs compared to non‐stimulated CTLs (naïve, grey circles) was determined after 72 h. [Ca2+]o was manipulated by the addition of EGTA (red circles) or CaCl2 (blue circles) or both at the same concentration as control (green circles). AIM V medium alone (no manipulation) is set to 100% (black circles). Data are shown as mean ± SD of 4 independent experiments from 2–9 different donors.
Figure 5
Figure 5. Ca2+ dependence of CTL migration
CTL migration was visualized at 37°C every 10 s for 1 h using a Zeiss Cell Observer HS. CTLs were not fluorescently labelled. CTLs were tracked with ImageJ (Plugin Specle TrackerJ) with manual correction. A, representative tracks of SEA‐stimulated CTLs migrating for 60 min. B, mean squared displacement of about 500 cells per condition from 5 independent experiments of 2‐3 donors as for the ones shown in A. C, velocity distribution of CTLs at different [Ca2+]o. D, the velocity autocorrelation function of CTL tracks was fitted with a double exponential function to yield two time constants reflecting the directional persistence of cell movement. E and F, average persistence time (slow exponential component from 5D) and average persistence distance (as calculated from the MSD) of CTLs as a function of [Ca2+]o.
Figure 6
Figure 6. Ca2+ dependence of lytic granule release
A, snapshots of LG accumulation stained with granzyme B–mCherry at the IS. Anti‐CD3/anti‐CD28 bead‐stimulated CTLs were transfected with granzyme B–mCherry and settled onto anti‐CD3/anti‐CD28/anti‐LFA‐1 antibody‐coated coverslips in modified Ringer solution containing 0 mm Ca2+ and then switched to AIM V with indicated [Ca2+]o. Images were taken at TIRF mode with a penetration depth of 110 nm. Scale bar is 5 μm. B, quantification of the accumulated granzyme B‐positive LGs at the IS. Data are shown as mean + SEM from 3 independent experiments. C, sequential images of a fusing LG at IS. CTLs were transfected with granzyme B–mCherry and were settled onto anti‐CD3/anti‐CD28/anti‐LFA‐1 antibody‐coated coverslips in modified Ringer solution containing 0 mm Ca2+ and then switched to AIM V with indicated [Ca2+]o. The orange cycle indicates a LG fusing at 42 ms. Scale bar is 5 μm. D, defining LG release by analysing the fluorescence intensity. The region of interest (ROI) covers the individual LG and the fluorescence intensity of the ROI is depicted over time. E, quantitative analysis of granzyme B or perforin positive LG fusion at different [Ca2+]o. CTLs were transfected with granzyme B–mCherry or perforin–mCherrry. The number of released LGs containing either granzyme B or perforin was analysed at different [Ca2+]o (3, 146 or 800 μm) during an interval of 2 min after Ca2+ application (= 49 cells for 3 μm, n = 48 cells for 146 μm and n = 43 cells for 800 μm [Ca2+]o). Data are from 4 independent experiments from 4 donors. F, quantification of the relative frequency of cells with LG release (at least one fused LG). Cells are taken from E (n= 20 cells for 3 μm, n = 22 cells for 146 μm and n = 15 cells for 800 μm [Ca2+]o). Frequency at 800 μm [Ca2+]o was set as 100%. Data are from 4 independent experiments of 4 donors.

References

    1. Becherer U, Medart MR, Schirra C, Krause E, Stevens D & Rettig J (2012). Regulated exocytosis in chromaffin cells and cytotoxic T lymphocytes: how similar are they? Cell Calcium 52, 303–312. - PubMed
    1. Bergmeier W, Weidinger C, Zee I & Feske S (2013). Emerging roles of store‐operated Ca2+ entry through STIM and ORAI proteins in immunity, hemostasis and cancer. Channels (Austin) 7, 379–391. - PMC - PubMed
    1. Bhat SS, Friedmann KS, Knorck A, Hoxha C, Leidinger P, Backes C, Meese E, Keller A, Rettig J, Hoth M, Qu B & Schwarz EC (2016). Syntaxin 8 is required for efficient lytic granule trafficking in cytotoxic T lymphocytes. Biochim Biophys Acta 1863, 1653–1664. - PubMed
    1. Chaigne‐Delalande B, Li FY, O'Connor GM, Lukacs MJ, Jiang P, Zheng L, Shatzer A, Biancalana M, Pittaluga S, Matthews HF, Jancel TJ, Bleesing JJ, Marsh RA, Kuijpers TW, Nichols KE, Lucas CL, Nagpal S, Mehmet H, Su HC, Cohen JI, Uzel G & Lenardo MJ (2013). Mg2+ regulates cytotoxic functions of NK and CD8 T cells in chronic EBV infection through NKG2D. Science 341, 186–191. - PMC - PubMed
    1. Chen YF, Chiu WT, Chen YT, Lin PY, Huang HJ, Chou CY, Chang HC, Tang MJ & Shen MR (2011). Calcium store sensor stromal‐interaction molecule 1‐dependent signaling plays an important role in cervical cancer growth, migration, and angiogenesis. Proc Natl Acad Sci USA 108, 15225–15230. - PMC - PubMed

Publication types