. 2018 Jan 25;16(1):e2003992.
doi: 10.1371/journal.pbio.2003992. eCollection 2018 Jan.

Mitochondria are physiologically maintained at close to 50 °C

Affiliations

Mitochondria are physiologically maintained at close to 50 °C

Dominique Chrétien et al. PLoS Biol. .

Abstract

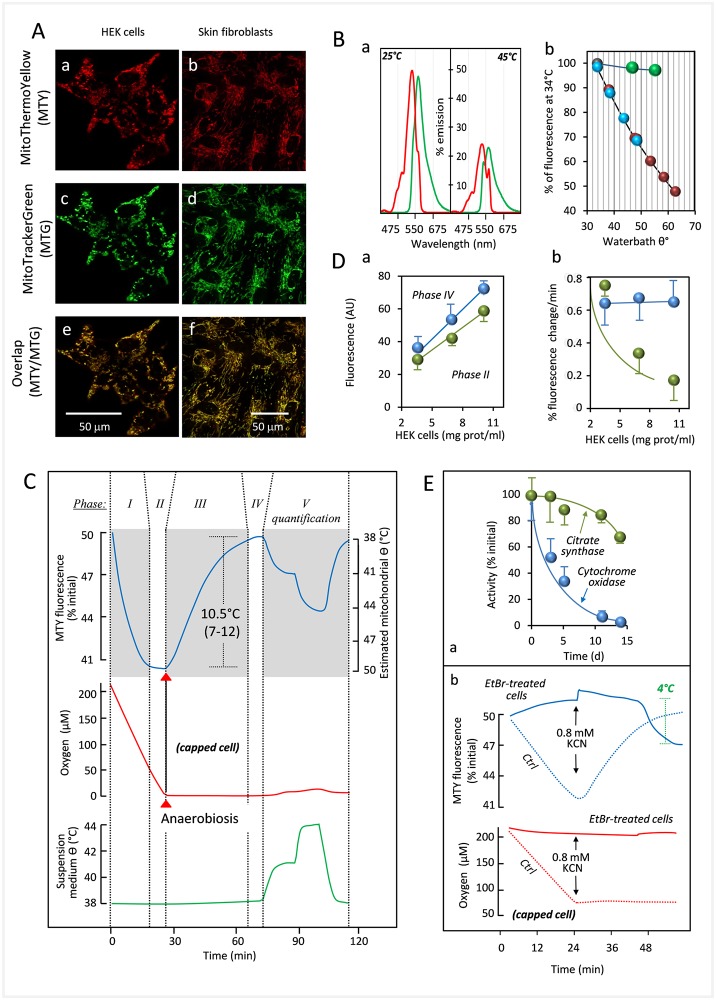
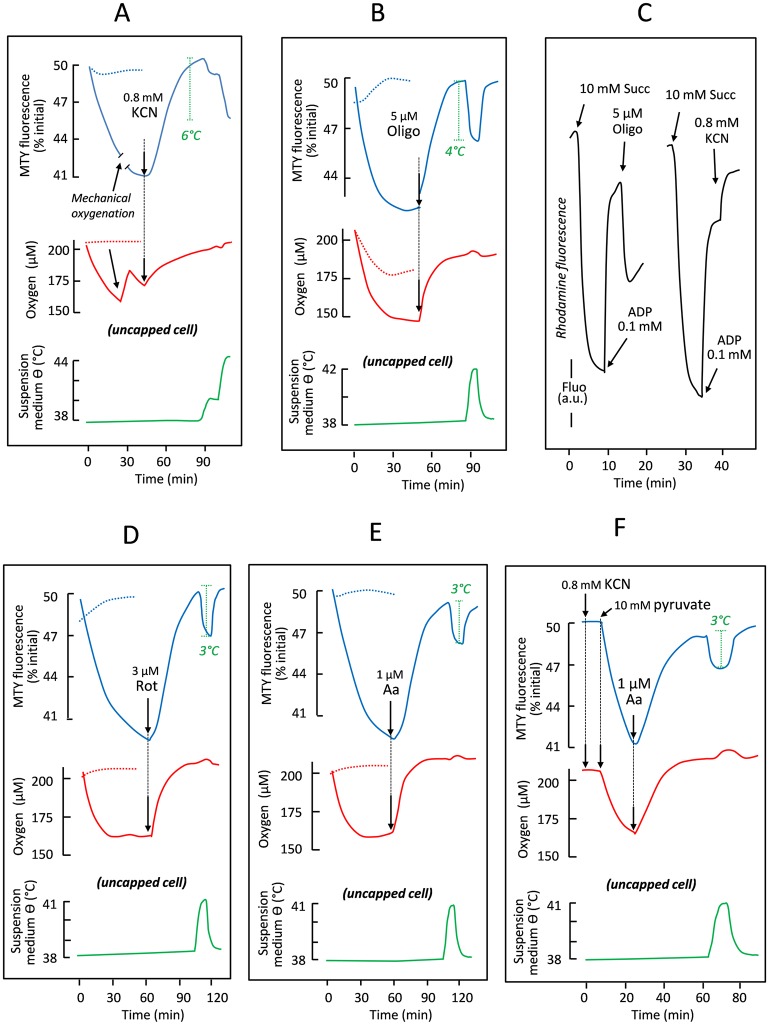
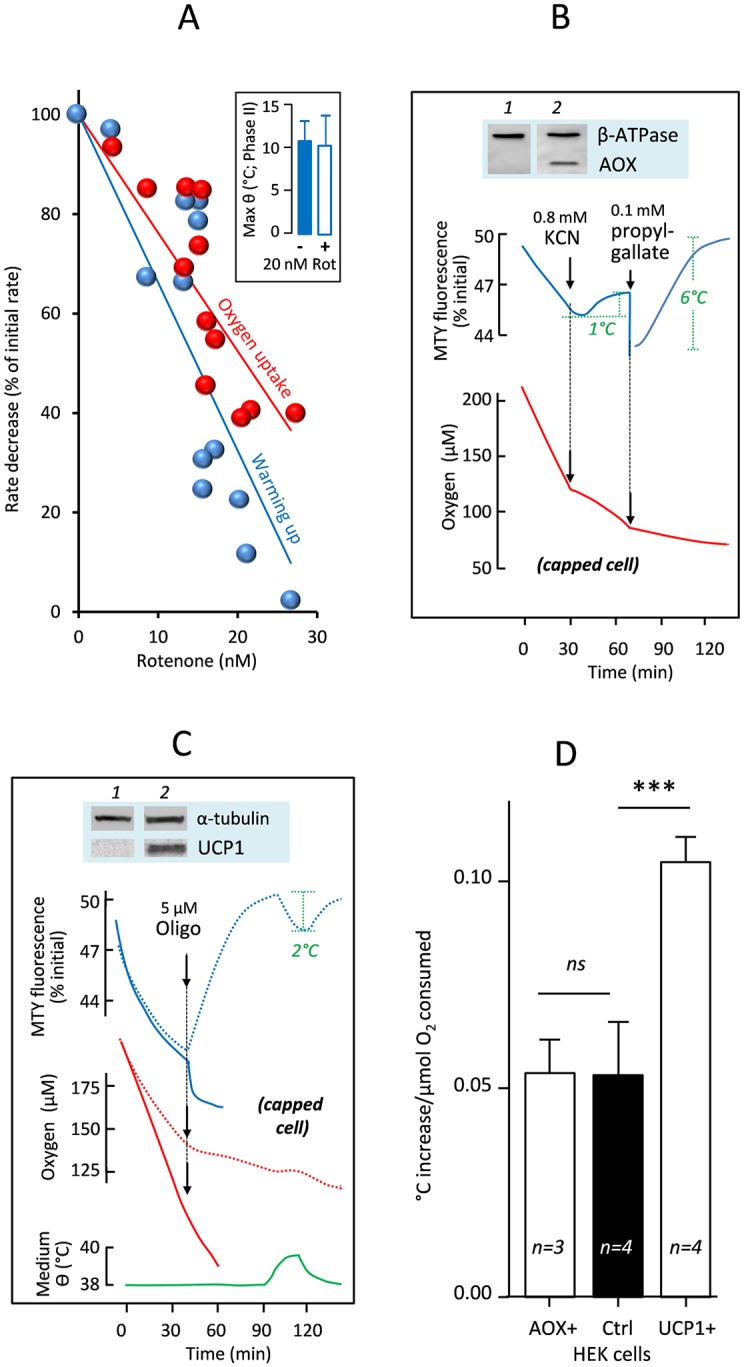
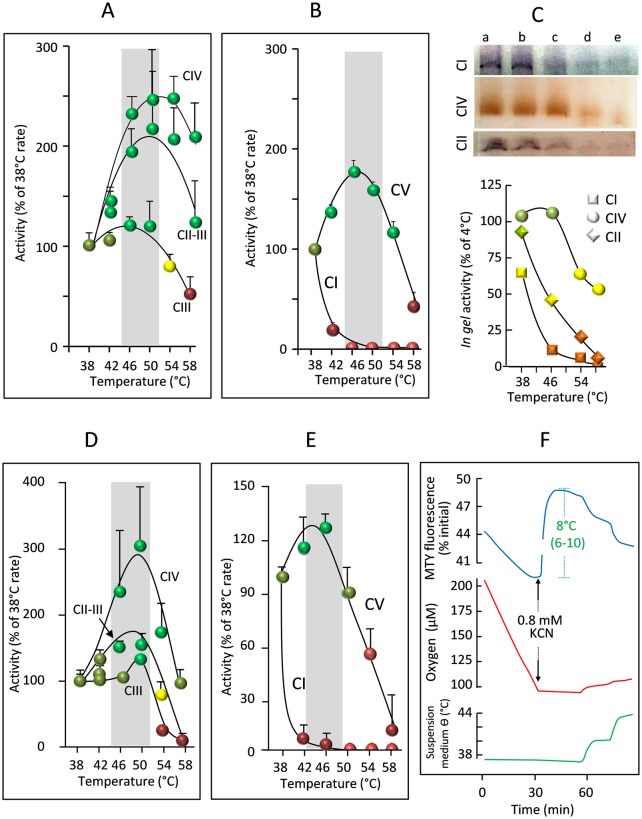
In endothermic species, heat released as a product of metabolism ensures stable internal temperature throughout the organism, despite varying environmental conditions. Mitochondria are major actors in this thermogenic process. Part of the energy released by the oxidation of respiratory substrates drives ATP synthesis and metabolite transport, but a substantial proportion is released as heat. Using a temperature-sensitive fluorescent probe targeted to mitochondria, we measured mitochondrial temperature in situ under different physiological conditions. At a constant external temperature of 38 °C, mitochondria were more than 10 °C warmer when the respiratory chain (RC) was fully functional, both in human embryonic kidney (HEK) 293 cells and primary skin fibroblasts. This differential was abolished in cells depleted of mitochondrial DNA or treated with respiratory inhibitors but preserved or enhanced by expressing thermogenic enzymes, such as the alternative oxidase or the uncoupling protein 1. The activity of various RC enzymes was maximal at or slightly above 50 °C. In view of their potential consequences, these observations need to be further validated and explored by independent methods. Our study prompts a critical re-examination of the literature on mitochondria.


Conflict of interest statement

The authors have declared that no competing interests exist.

Figures

Fig 1
Fig 1. Determination of mitochondrial temperature in intact human cells.
(A) The temperature-sensitive probe MTY (a, b) colocalizes with MTG (c, d), merge (e, f), in HEK293 cells and in primary skin fibroblasts, as indicated. (B) (a) Fluorescence excitation (red) and emission (green) spectra of MTY (1 mM) in 2 mL PBS at 25 and 45 °C; (b) Fluorescence response to temperature (34–64 °C) of MTY (blue and red) and rhodamine (green, also 1 mM) in 2 mL PBS. Note that the pseudo-linear decrease of MTY fluorescence corresponding to increasing temperature (blue) is essentially reversed upon cooling (red) of the solution to the initial temperature. (C) The definition of the various phases of fluorescence in MTY-preloaded HEK293 cells, as used in this study. Note that the initial value is given systematically as 50%, as set automatically by the spectrofluorometer (under these conditions; photo multiplier tension about 500 mV), allowing either increases or decreases to be recorded. Phase I: cell respiration (red trace) after cells are exposed to aerobic conditions in PBS, resulting in decreased MTY fluorescence (blue trace), as mitochondria heat up (cells were initially maintained for 10 min at 38 °C under anaerobic conditions, before being added to the cuvette). Phase II: cell respiration under aerobic conditions, in which a steady state of MTY fluorescence has been reached (maximal warming of mitochondria). Phase III: cell respiration arrested due to oxygen exhaustion—MTY fluorescence progressively increases to the starting value as mitochondria cool down. Phase IV: respiration remains stalled due to anaerobiosis; after reaching steady state, MTY fluorescence is dictated only by the water-bath temperature of 38 °C. Phase V, respiration remains stalled due to anaerobiosis, whilst temperature of the cell suspension medium (green trace) is shifted by making stepwise adjustments to water-bath temperature. Measurements were carried out in a closed quartz chamber (capped cell) except for a 0.6-mm addition hole in the handmade cap. The MTY fluorescence reached at the end of phase I was significantly different (n = 10; ***) from the starting value of 50%, whilst the final value in phase IV was not. (D) (a) Linear increase of fluorescence of HEK293 cells (preloaded for a minimum of 10 min, with 100 nM MTY), according to cell number (using cell protein concentration as surrogate parameter); (b) Maximal rate of decrease of MTY fluorescence (percentage, blue circles, corresponding with mitochondrial warming) is not significantly affected by cell number, whereas initial fluorescence increase in the presence of cyanide (percentage, green circles, corresponding with initial rate of mitochondrial cooling) is modulated by cell number (values at the three cell concentrations tested were significantly different from each other). (E) (a) HEK293 cells were made severely deficient for cytochrome c oxidase by culturing (10 days) in the presence of EtBr (1 μg/ml). Cytochrome c oxidase activity (blue circles) declined to a few percent of the activity measured at t = 0, whilst citrate synthase activity (green circles) was little changed; (b) The fluorescence of EtBr-treated HEK293 cells (10 days of EtBr treatment) preloaded with MTY (blue continuous line) does not decrease following suspension in oxygenated medium, whilst that of control HEK293 cells (blue dotted lines) follows the profile documented in Fig 1C; in contrast to control cells (red dotted line), EtBr-treated HEK293 cells also do not consume appreciable amounts of oxygen (red continuous line). Graphic drawings, means, and standard deviations are from values accessible in S1 Data. EtBr, ethidium bromide; HEK, human embryonic kidney, KCN, potassium cyanide; MTG, MitoTracker Green; MTY, MitoThermo Yellow.
Fig 2
Fig 2. The rate of respiratory electron flow determines the temperature of mitochondria in intact HEK293 cells.
(A) The effect of 0.8 mM cyanide on MTY fluorescence (blue lines) and cell respiration (red lines), when added under aerobic conditions (continuous lines), or when present from the start of the experiment (dotted lines). Changes in the temperature of the cell suspension medium (green line), imposed by water-bath adjustment, were used to calibrate the MTY fluorescence changes. (B) The effect of 5 μM oligomycin on MTY fluorescence (blue lines) and oxygen tension (affected by cell respiration balanced by medium stirring) in the uncapped quartz-cuvette (red lines), when added to freely respiring cells (continuous lines) or when present from the start of the experiment (dotted lines). (C) The effects of different inhibitors on rhodamine fluorescence, in digitonin (0.01%)-permeabilized HEK293 cells supplied with 10 mM succinate and 0.1 mM ADP, as indicated. Under state 3 conditions, 5 μM oligomycin and 0.8 mM potassium cyanide have qualitatively opposite effects on rhodamine fluorescence, used as an indicator of membrane potential (ΔΨ). The effects of 3 μM rotenone (D) and 1 μM antimycin (E) on MTY fluorescence and oxygen tension, plotted as for oligomycin in (B). (F) The effect of adding pyruvate on MTY fluorescence (blue line) and oxygen uptake (red line) by KCN-inhibited HEK293 cells. Temperature calibration (green line) of MTY fluorescence as in (A). Note that, in all experiments in which MTY fluorescence was measured prior to respiratory inhibition, the value reached at the end of phase I was in all cases significantly different (n ≥ 5; ***) from the starting value, whilst that in phase IV was not. Aa, antimycin A; ADP, adenosine diphosphate; a.u., arbitrary unit; HEK, human embryonic kidney; KCN, potassium cyanide; MTY, MitoThermo Yellow; Oligo, oligomycin; Rot, rotenone; Succ, succinate.
Fig 3
Fig 3. Effects on mitochondrial temperature of respiratory inhibitors, uncouplers, and expression of heterologous mitochondrial proteins.
(A) Effect of variable rotenone addition to control HEK293 cells on the rates of oxygen uptake and fluorescence decrease of MTY. Rotenone was added at t = 4 min; rates calculated from 4–7 min and expressed as a percent of initial rate. Inset: maximal warming of HEK293 cell mitochondria in the absence or presence of 20 μM rotenone. (B, C) Changes in MTY fluorescence (blue lines), cell respiration (B, C) (red lines), and temperature of cell suspension medium (green line), with additions of inhibitors as shown (potassium cyanide, n-propyl gallate, and/or oligomycin), alongside western blots confirming expression of the indicated genes: Ciona intestinalis AOX (B), UCP1 (C), alongside loading controls, as indicated. Traces for control cells are shown by dotted lines. The abrupt change in fluorescence upon addition of n-propyl gallate is due to the absorbance of the chemical itself. Note that in all experiments in which MTY fluorescence was measured, the value reached at the end of phase I was in all cases significantly different from the starting value, whilst that in phase IV was not (n = 4; ***). (D) Computed from experiments using HEK293 cells endowed with AOX (AOX+), UCP1 (UCP1+) or control cells, initial increases of temperature (°C) per μmol oxygen consumed were compared and statistically analyzed by one-way ANOVA with Bonferroni’s multiple comparison test (n = 3–4; means ± SD). Graphic drawings, means, and standard deviations are from values accessible in S1 Data. AOX, alternative oxidase; Ctrl, control; HEK, human embryonic kidney; KCN, potassium cyanide; MTY, MitoThermo Yellow; ns, nonsignificant; Oligo, oligomycin; Rot, rotenone; UCP1, uncoupling protein 1.
Fig 4
Fig 4. Effects of assay medium temperature on RC activities.
(A, D) Temperature profile of cytochrome c oxidase (CIV), malonate-sensitive succinate:cytochrome c reductase (CII+CIII), and antimycin-sensitive decylubiquinol:cytochrome c reductase (CIII) activity in (A) HEK293 cells and (D) primary skin fibroblasts, after two freeze–thaw cycles, and (B, E) oligomycin-sensitive ATPase (CV) and rotenone-sensitive NADH:decylubiquinone reductase (CI) activity, after disruption of inner mitochondrial membrane in frozen (B) HEK293 cells and (E) primary skin fibroblasts by osmolysis with water [10]. Colors denote optimal (green), minimal (red), and degrees of intermediate (pale greens, yellow) activity. Grey bars indicate optimal temperature range. (C) clear native electrophoresis (CNE) in-gel activities of CI, CIV, and CII extracted from mitochondria previously incubated for 10 min in water at (a) 4 °C, (b) 37 °C, (c) 42 °C, (d) 46 °C, and (e) 55 °C, also plotted graphically (lower panel). (F) Changes in MTY fluorescence (blue), cell respiration (red), and temperature of cell suspension medium (green) for primary skin fibroblasts, as denoted in Fig 2A, with the addition of KCN, as shown. Graphic drawings, means, and standard deviations are from values accessible in S1 Data. HEK, human embryonic kidney; KCN, potassium cyanide; MTY, MitoThermo Yellow; RC, respiratory chain.

References

    1. Arai S, Suzuki M, Park SJ, Yoo JS, Wang L, et al. (2015) Mitochondria-targeted fluorescent thermometer monitors intracellular temperature gradient. Chem Commun (Camb) 51: 8044–8047. - PubMed
    1. Benit P, Chretien D, Porceddu M, Yanicostas C, Rak M, et al. (2017) An Effective, Versatile, and Inexpensive Device for Oxygen Uptake Measurement. J Clin Med 6. - PMC - PubMed
    1. Abad MF, Di Benedetto G, Magalhaes PJ, Filippin L, Pozzan T (2004) Mitochondrial pH monitored by a new engineered green fluorescent protein mutant. J Biol Chem 279: 11521–11529. doi: 10.1074/jbc.M306766200 - DOI - PubMed
    1. Hackenbrock CR (1968) Ultrastructural bases for metabolically linked mechanical activity in mitochondria. II. Electron transport-linked ultrastructural transformations in mitochondria. J Cell Biol 37: 345–369. - PMC - PubMed
    1. Hackenbrock CR, Rehn TG, Weinbach EC, Lemasters JJ (1971) Oxidative phosphorylation and ultrastructural transformation in mitochondria in the intact ascites tumor cell. J Cell Biol 51: 123–137. - PMC - PubMed

Publication types