

Improving generation length estimates for the IUCN Red List
- PMID: 29370251
- PMCID: PMC5784970
- DOI: 10.1371/journal.pone.0191770
Improving generation length estimates for the IUCN Red List
Abstract
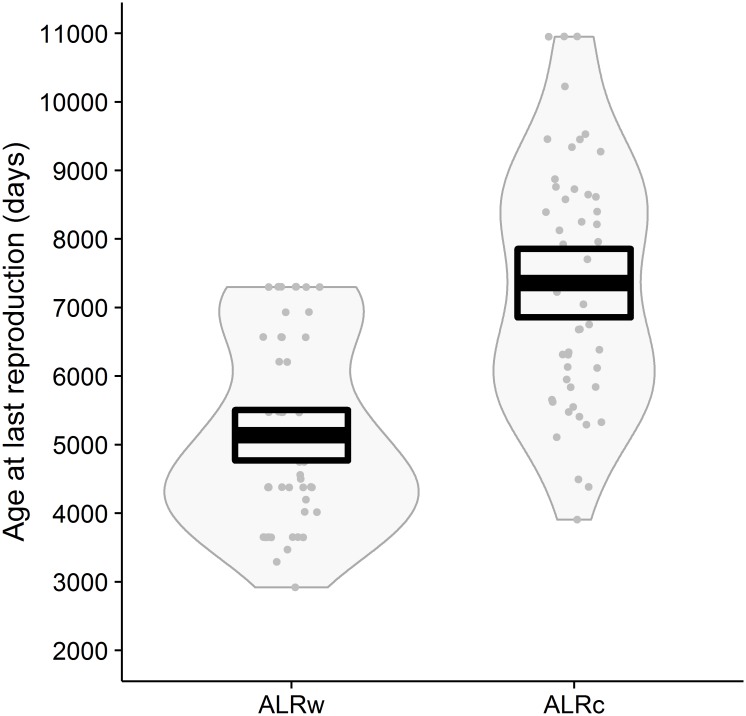
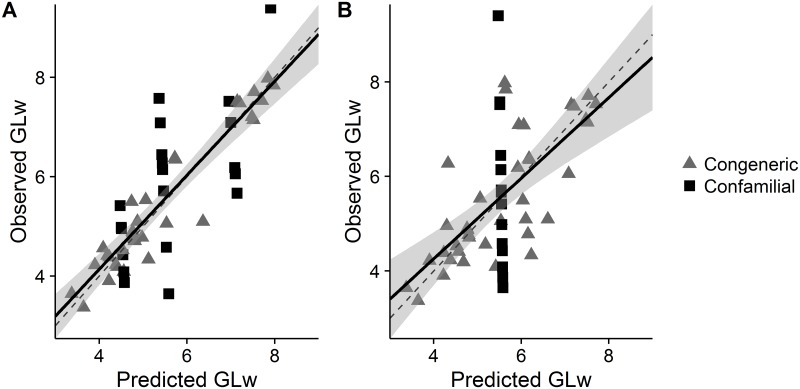
The International Union for the Conservation of Nature (IUCN) Red List classifies species according to their risk of extinction, informing local to global conservation decisions. Here we look to advance the estimation of generation length, which is used as a time-scalar in the Red List as a way of accounting for differences in species' life-histories. We calculated or predicted generation length for 86 species of antelope following the Rspan approach. We also tested the importance of both allometry (body-mass) and phylogeny (phylogenetic eigenvectors) as predictors of generation length within a Phylogenetic Eigenvector Map (PEM) framework. We then evaluated the predictive power of this PEM and two binning approaches, following a leave-one-out cross-validation routine. We showed that captive and wild longevity data are nonequivalent and that both body-mass and phylogeny are important predictors for generation length (body-mass explained 64% and phylogeny 36% of the partitioned explained variance). Plus, both the PEM, and the binning approach that included both taxonomic rank and body-mass, had good predictive power and therefore are suitable for extrapolating generation length to missing-data species. Therefore, based on our findings, we advise separating captive and wild data when estimating generation length, and considering the implications of wild and captive data more widely in life-history analyses. We also recommend that body-mass and phylogeny should be used in combination, preferably under a PEM framework (as it was less reliant on available reference species and more explicitly accounts for phylogenetic relatedness) or a binning approach if a PEM is not feasible, to extrapolate generation length to missing-data species. Overall, we provide a transparent, consistent and transferable workflow for improving the use of the Rspan method to calculate generation length for the IUCN Red List.
Conflict of interest statement
Figures


References
-
- D’Elia J, McCarthy S. Time Horizons and Extinction Risk in Endangered Species Categorization Systems. Bioscience. 2010;60: 751–758. doi: 10.1525/bio.2010.60.9.12 - DOI
-
- Rodrigues ASL, Pilgrim JD, Lamoreux JF, Hoffmann M, Brooks TM. The value of the IUCN Red List for conservation. Trends Ecol Evol. 2006;21: 71–76. doi: 10.1016/j.tree.2005.10.010 - DOI - PubMed
-
- Taylor BL, Chivers SJ, Larese J, Perrin WF. Generation length and percent mature estimates for IUCN assessments of cetaceans. Administrative Report LJ-07-01 National Marine Fisheries. 2007.
-
- Mace GM, Collar NJ, Gaston KJ, Hilton-Taylor C, Akcakaya HR, Leader-Williams N, et al. Quantification of Extinction Risk: IUCN’s System for Classifying Threatened Species. Conserv Biol. 2008;22: 1424–1442. doi: 10.1111/j.1523-1739.2008.01044.x - DOI - PubMed
-
- Butchart SHM, Akcakaya HR, Kennedy E, Hilton-Taylor C. Biodiversity indicators based on trends in conservation status: Strengths of the IUCN red list index. Conserv Biol. 2006;20: 579–581. doi: 10.1111/j.1523-1739.2006.00410.x - DOI - PubMed
Publication types
MeSH terms
LinkOut - more resources
Full Text Sources
Other Literature Sources
Research Materials
