. 2018 Jan 25;14(1):e1006874.
doi: 10.1371/journal.ppat.1006874. eCollection 2018 Jan.

Lipid droplet formation in Mycobacterium tuberculosis infected macrophages requires IFN-γ/HIF-1α signaling and supports host defense

Affiliations

Lipid droplet formation in Mycobacterium tuberculosis infected macrophages requires IFN-γ/HIF-1α signaling and supports host defense

Matthew Knight et al. PLoS Pathog. .

Abstract

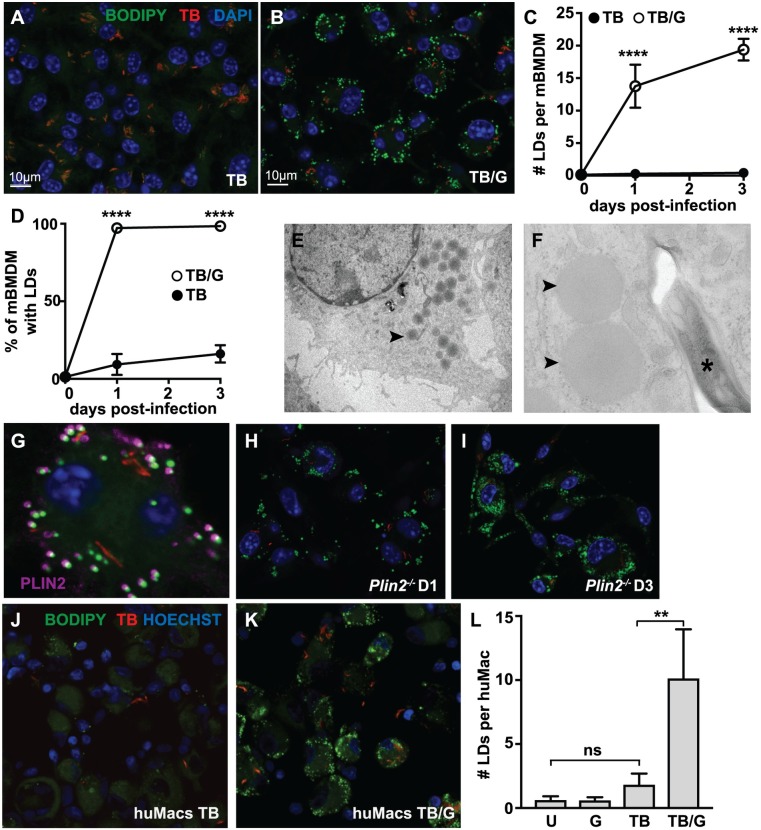
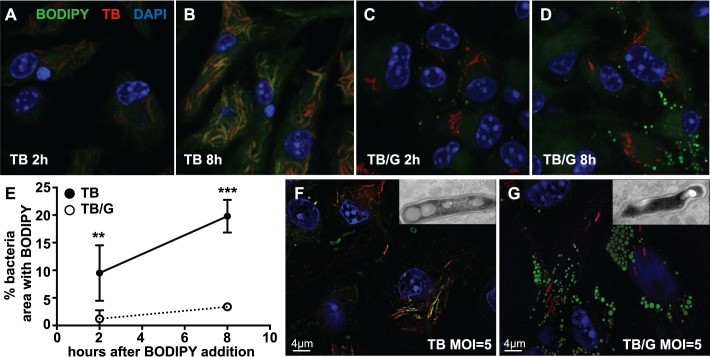
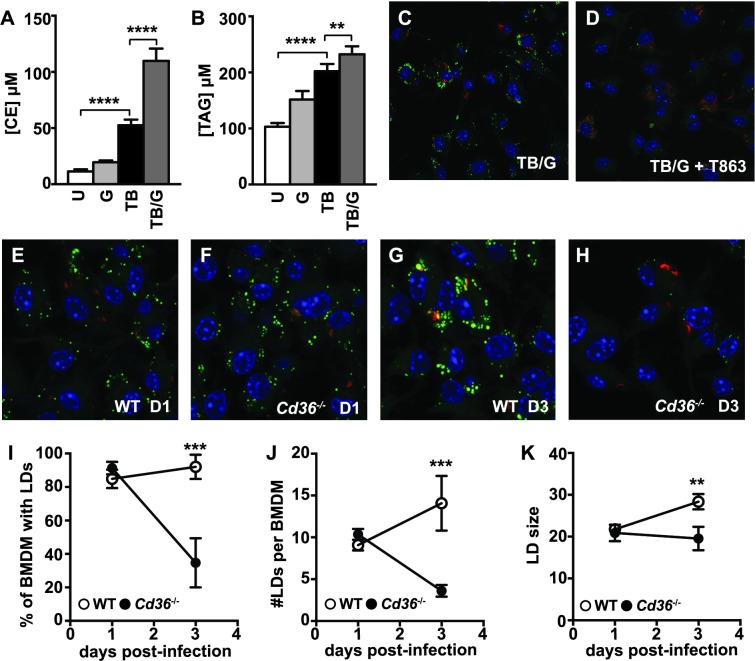
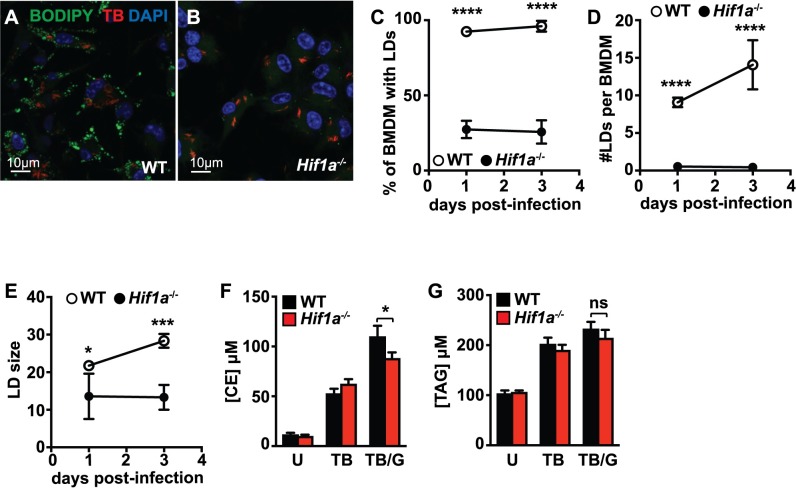
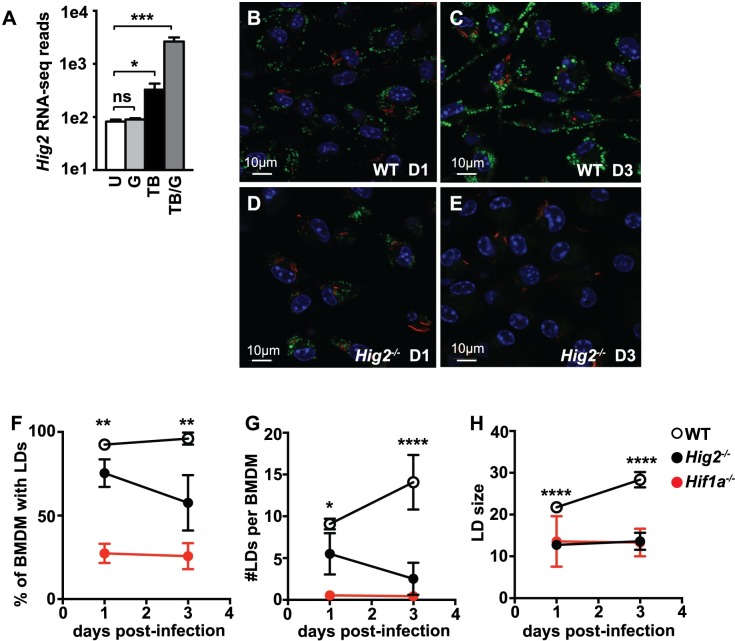
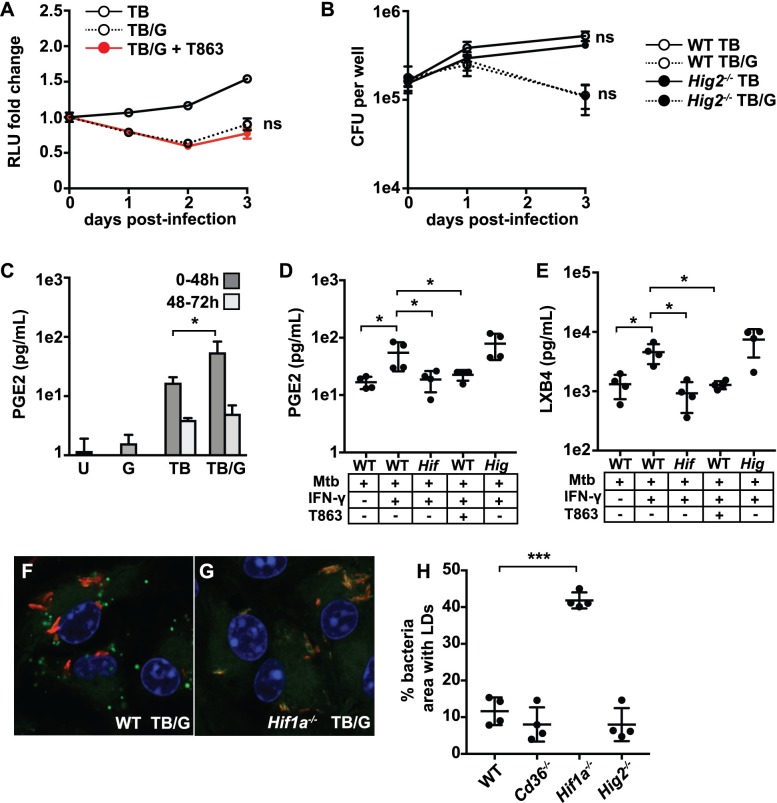
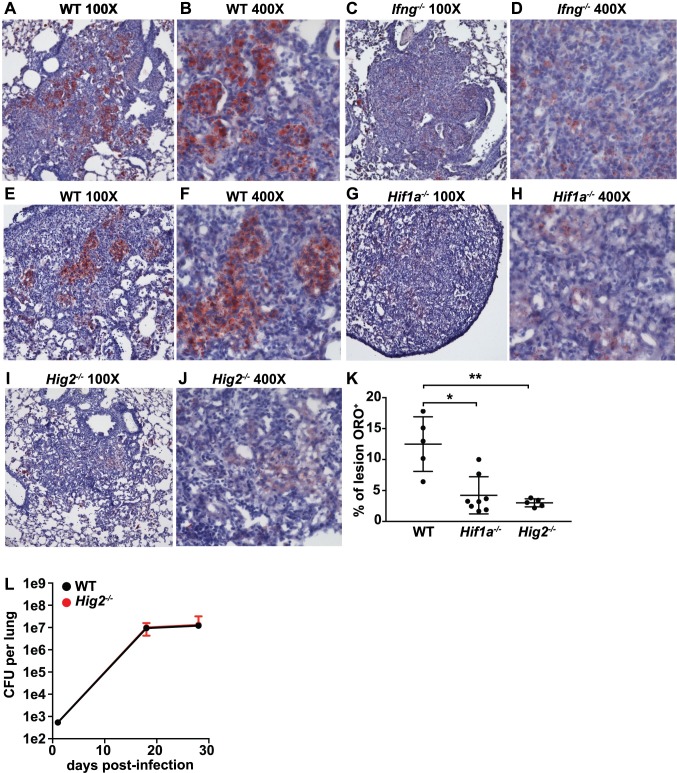
Lipid droplet (LD) formation occurs during infection of macrophages with numerous intracellular pathogens, including Mycobacterium tuberculosis. It is believed that M. tuberculosis and other bacteria specifically provoke LD formation as a pathogenic strategy in order to create a depot of host lipids for use as a carbon source to fuel intracellular growth. Here we show that LD formation is not a bacterially driven process during M. tuberculosis infection, but rather occurs as a result of immune activation of macrophages as part of a host defense mechanism. We show that an IFN-γ driven, HIF-1α dependent signaling pathway, previously implicated in host defense, redistributes macrophage lipids into LDs. Furthermore, we show that M. tuberculosis is able to acquire host lipids in the absence of LDs, but not in the presence of IFN-γ induced LDs. This result uncouples macrophage LD formation from bacterial acquisition of host lipids. In addition, we show that IFN-γ driven LD formation supports the production of host protective eicosanoids including PGE2 and LXB4. Finally, we demonstrate that HIF-1α and its target gene Hig2 are required for the majority of LD formation in the lungs of mice infected with M. tuberculosis, thus demonstrating that immune activation provides the primary stimulus for LD formation in vivo. Taken together our data demonstrate that macrophage LD formation is a host-driven component of the adaptive immune response to M. tuberculosis, and suggest that macrophage LDs are not an important source of nutrients for M. tuberculosis.


Conflict of interest statement

The authors have declared that no competing interests exist.

Figures

Fig 1
Fig 1. Macrophage LD formation during M. tuberculosis infection requires IFN-γ.
(A) Unstimulated and (B) IFN-γ activated BMDM were infected with fluorescent M. tuberculosis 635-Turbo at MOI = 5 and imaged by confocal microscopy 3 days post-infection. Nuclei were visualized with DAPI staining and neutral lipids were visualized with BODIPY 493/503 staining. (C,D) Images from 1 and 3 days post-infection were quantified using CellProfiler for (C) the average number of LDs per BMDM and (D) the percentage of BMDM containing LDs. Each data point is quantified from ~500 BMDM. (E,F) TEM was performed on IFN-γ activated BMDMs infected with M. tuberculosis 3 days post-infection. LDs (arrowheads) and M. tuberculosis (asterisk) are indicated. (E) is at 890x magnification and (F) is at 9300x magnification. (G) IFN-γ activated BMDM were infected with fluorescent M. tuberculosis 635-Turbo. Immunofluorescence microscopy was performed 1 day post-infection, and localization of PLIN2 to BODIPY-stained structures was observed. (H,I) IFN-γ activated Plin2-/- BMDM were infected with M. tuberculosis and LD formation was evaluated using BODIPY 493/503 staining 1 day post-infection (H) and 3 days post-infection (I). (J) Unstimulated and (K) IFN-γ activated primary human monocyte derived macrophages were infected with M. tuberculosis 635-Turbo at MOI = 3 and imaged by confocal microscopy 1 day post-infection. Nuclei were visualized by Hoechst 33342 and neutral lipids with BODIPY 493/503. (L) The average number of LDs per cell was quantified using CellProfiler in uninfected [U], IFN-γ activated [G], M. tuberculosis infected [TB], or IFN-γ activated and M. tuberculosis infected [TB/G] human macrophages at 1 day post-infection. Each data point is quantified from ~200 cells. All figures are representative of a minimum of three independent experiments with the exception of electron microscopy which was performed once in triplicate and human macrophages infections which were performed in duplicate. Error bars are standard deviation, **p<0.01, ****p<0.0001 by unpaired t-test.
Fig 2
Fig 2. M. tuberculosis acquisition of host lipids does not correlate with LD formation in infected macrophages.
(A-D) Fluorescently labeled fatty acid BODIPY FL C16 was added to media of M. tuberculosis 635-Turbo infected BMDM 3 days post-infection. Bacterial lipid accumulation was analyzed by confocal microscopy at 2 hours and 8 hours after BODIPY FL C16 addition in the absence of IFN-γ activation (A,B), and with IFN-γ activation (C,D). (E) Bacterial accumulation of BODIPY FL C16 during M. tuberculosis infection of BMDM without IFN-γ activation [TB] and with IFN-γ activation [TB/G] was quantified using CellProfiler from images as in (A-D). Each data point is quantified from bacteria contained within ~100 infected BMDM. (F) BMDM were infected with M. tuberculosis 635-Turbo in the absence of IFN-γ. 3 days post-infection, BMDM were fixed, BODIPY 493/503 stained, and analyzed by SIM. Punctate BODIPY 493/503 staining co-localizing with M. tuberculosis was observed. TEM of infected BMDM at the same time point shows that these BODIPY 493/503 puncta are bacterial lipid inclusions (inset). (G) IFN-γ activated BMDM were infected and analyzed as in (F). SIM and TEM imaging indicates that in IFN-γ activated BMDM, BODIPY 493/503 signal does not localize with M. tuberculosis and bacterial lipid inclusions are not present (inset). All figures are representative of three experiments with the exception of TEM, which was performed once in triplicate. Error bars are standard deviation, **p<0.01, ***p<0.001 by unpaired t-test.
Fig 3
Fig 3. LD formation is associated with an increase in intracellular triacylglycerols and cholesterol esters, and requires the fatty acid translocase CD36.
Lipidomic quantification of (A) total cellular cholesterol ester [CE] and (B) total triacylglycerol [TAG] concentrations in wildtype BMDM 1 day post-infection was performed by Metabolon, Inc using mass spectrometric analysis of quintuplicate samples. BMDM were either uninfected [U], IFN-γ activated [G], M. tuberculosis infected [TB], or IFN-γ activated and M. tuberculosis infected [TB/G]. (C,D) IFN-γ activated BMDM were infected with M. tuberculosis and the DGAT1 inhibitor T863 was added after the 4 hour phagocytosis period (D). Microscopy was performed 1 day post-infection. (E-H) IFN-γ activated wildtype and Cd36-/- BMDM were infected with M. tuberculosis 635-Turbo. BODIPY 493/503 staining and confocal microscopy was performed 1 day post-infection (E,F) and 3 days post-infection (G,H). CellProfiler was used to quantify (I) the percentage of BMDM with LDs, (J) the number of LDs per BMDM, and (K) LD size. Each data point is quantified from ~500 BMDM. (C-K) Figures are representative of three independent experiments. (A,B) Lipidomic profiling was performed once in quintuplicate. Error bars are standard deviation, **p<0.01, ***p<0.001, ****p<0.0001 by unpaired t-test.
Fig 4
Fig 4. HIF-1α is required for LD formation during M. tuberculosis infection.
(A) Wildtype and (B) Hif1a-/- BMDMs were infected with M. tuberculosis 635-Turbo following IFN-γ activation. 1 day post-infection, BMDM were stained with BODIPY 493/503 and confocal microscopy was performed. CellProfiler was used to quantify (C) the percentage of BMDM with LDs, (D) the number of LDs per BMDM, and (E) LD size 1 and 3 days post-infection. Each data point is quantified from ~500 BMDM. (F,G) Lipidomic quantification of (F) total cellular cholesterol ester [CE] and (G) total triacylglycerol [TAG] concentrations in wildtype and Hif1a-/- BMDM was performed by Metabolon, Inc using mass spectrometric analysis of quintuplicate samples. BMDM were infected with M. tuberculosis and cell lysates were prepared 1 day post-infection. BMDM were either uninfected [U], M. tuberculosis infected [TB], or IFN-γ activated and M. tuberculosis infected [TB/G]. (A-E) Figures are representative of a minimum of three experiments. (F,G) Lipidomic profiling was performed once in quintuplicate. Error bars are standard deviation, *p<0.05, ***p<0.001, ****p<0.0001 by unpaired t-test.
Fig 5
Fig 5. HIF-1α target gene Hig2 is required for LD maintenance during M. tuberculosis infection.
(A) RNA-seq data for transcript levels of Hig2 in wildtype BMDM either unstimulated [U], IFN-γ activated [G], M. tuberculosis infected [TB], or IFN-γ activated and M. tuberculosis infected [TB/G]. Samples were collected 1 day post-infection in 3 independent experiments. (B-E) IFN-γ activated wildtype and Hig2-/- BMDM were infected with M. tuberculosis 635-Turbo. BODIPY 493/503 staining and confocal microscopy was performed 1 day post-infection (B,D) and 3 days post-infection (C,E). CellProfiler was used to quantify (F) the percentage of BMDM with LDs, (G) the number of LDs per BMDM, and (H) LD size. Each data point is quantified from ~500 BMDM. Figures are representative of three experiments, error bars are standard deviation, *p<0.05, **p<0.01, ***p < .001, ****p<0.0001 by unpaired t-test.
Fig 6
Fig 6. LDs support host immunity in M. tuberculosis infected and IFN-γ activated macrophages.
(A) Resting and IFN-γ activated BMDM were infected with TB-Lux M. tuberculosis at MOI = 5, and T863 was added after the 4 hour phagocytosis. Lux readings were taken at day 0 (after the 4 hour phagocytosis), and days 1, 2, and 3 post-infection. Data is normalized to the day 0 read. (B) Wildtype and Hig2-/- BMDM were infected as in (A) and bacterial numbers were enumerated by plating for CFU at the indicated time points. (C) LC-MS/MS measurement of PGE2 in supernatants from wildtype BMDM either unstimulated [U], IFN-γ activated [G], M. tuberculosis infected [TB], or IFN-γ activated and M. tuberculosis infected [TB/G]. Supernatant samples were taken in quadruplicate at both 48 hours post-infection and again at 72 hours post-infection from the same cells. (D,E) LC-MS/MS measurement of PGE2 (D) and LXB4 (E) from supernatants of BMDM infected with M. tuberculosis, 48 hours post-infection. Samples are from wildtype [WT], Hif1a-/- [Hif] and Hig2-/- [Hig] BMDM, with IFN-γ and T863 treatment as indicated. (F,G) Wildtype and Hif1a-/- BMDM were activated with IFN-γ and infected with M. tuberculosis 635-Turbo and stained with BODIPY 493/503 at 3 days post-infection. (H) Quantification of bacterial area colocalizing with lipid staining at 3 days post-infection in wildtype, Cd36-/-, Hif1a-/-, and Hig2-/- BMDM activated with IFN-γ and infected with M. tuberculosis. Figures are representative of a minimum of three experiments, except for LC-MS/MS eicosanoid profiling which was performed once in quadruplicate. Error bars are standard deviation. *p<0.05, ***p<0.001 by unpaired t-test.
Fig 7
Fig 7. IFN-γ signaling is required for LD formation during M. tuberculosis infection in vivo.
(A-J) Mice were infected with ~200 CFU of M. tuberculosis via the aerosol route and lungs were collected for histological analysis of LD formation by Oil Red O (ORO) staining. (A-D) ORO stained lung sections from wildtype and Ifng-/- mice 21 days post-infection. Sections were counter-stained with hematoxylin. (E-J) ORO stained lung sections from wildtype (E,F), LysMcre+/+; Hif1afl/fl (G,H), and Hig2-/- mice (I,J) at 28 days post-infection. (K) ORO signal as a percentage of lesion area was quantified in sections from wildtype, LysMcre+/+; Hif1afl/fl, and Hig2-/- mice. (L) Bacterial burden in the lungs of wildtype and Hig2-/- mice was enumerated by plating for CFU at 1, 18 and 28 days post-infection. Images and figures are representative of at least 3 independent experiments. Error bars are standard deviation, *p<0.05, **p<0.01 by unpaired t-test.

Similar articles

Cited by

References

    1. Floyd K. Global Tuberculosis Report 2016. Geneva: World Health Organization; 2016. December pp. 1–214.
    1. Getahun H, Matteelli A, Chaisson RE, Raviglione M. Latent Mycobacterium tuberculosis infection. The New England journal of medicine. 2015;372: 2127–2135. doi: 10.1056/NEJMra1405427 - DOI - PubMed
    1. Peyron P, Vaubourgeix J, Poquet Y, Levillain F, Botanch C, Bardou F, et al. Foamy macrophages from tuberculous patients' granulomas constitute a nutrient-rich reservoir for M. tuberculosis persistence. PLOS Pathogens. 2008;4: e1000204 doi: 10.1371/journal.ppat.1000204 - DOI - PMC - PubMed
    1. Russell DG, Cardona P-J, Kim M-J, Allain S, Altare F. Foamy macrophages and the progression of the human tuberculosis granuloma. Nat Immunol. 2009;10: 943–948. doi: 10.1038/ni.1781 - DOI - PMC - PubMed
    1. Kim M-J, Wainwright HC, Locketz M, Bekker L-G, Walther GB, Dittrich C, et al. Caseation of human tuberculosis granulomas correlates with elevated host lipid metabolism. EMBO Mol Med. 2010;2: 258–274. doi: 10.1002/emmm.201000079 - DOI - PMC - PubMed

Publication types

Substances