. 2018 Mar;39(3):507-514.
doi: 10.3174/ajnr.A5526. Epub 2018 Jan 25.

Local Glioma Cells Are Associated with Vascular Dysregulation

Affiliations

Local Glioma Cells Are Associated with Vascular Dysregulation

S G Bowden et al. AJNR Am J Neuroradiol. 2018 Mar.

Abstract

Background and purpose: Malignant glioma is a highly infiltrative malignancy that causes variable disruptions to the structure and function of the cerebrovasculature. While many of these structural disruptions have known correlative histopathologic alterations, the mechanisms underlying vascular dysfunction identified by resting-state blood oxygen level-dependent imaging are not yet known. The purpose of this study was to characterize the alterations that correlate with a blood oxygen level-dependent biomarker of vascular dysregulation.

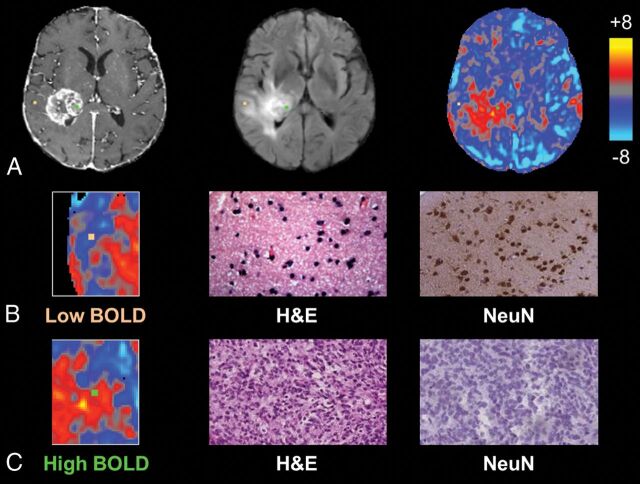
Materials and methods: Thirty-two stereotactically localized biopsies were obtained from contrast-enhancing (n = 16) and nonenhancing (n = 16) regions during open surgical resection of malignant glioma in 17 patients. Preoperative resting-state blood oxygen level-dependent fMRI was used to evaluate the relationships between radiographic and histopathologic characteristics. Signal intensity for a blood oxygen level-dependent biomarker was compared with scores of tumor infiltration and microvascular proliferation as well as total cell and neuronal density.

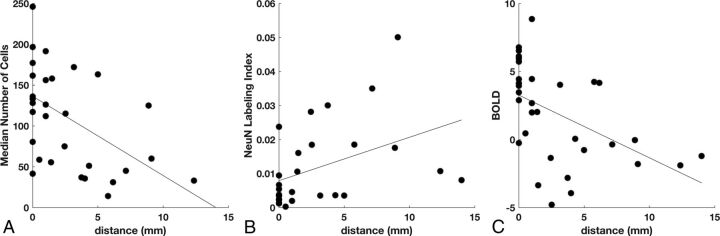
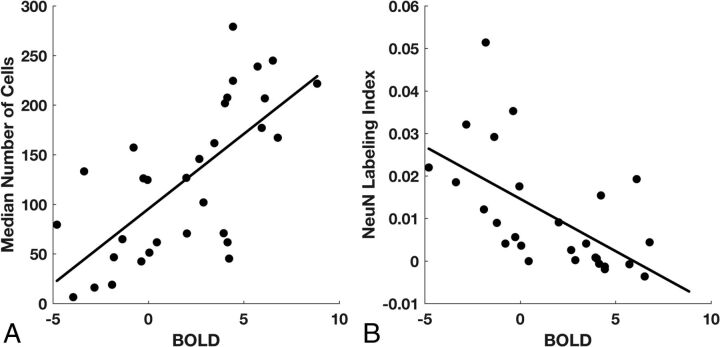
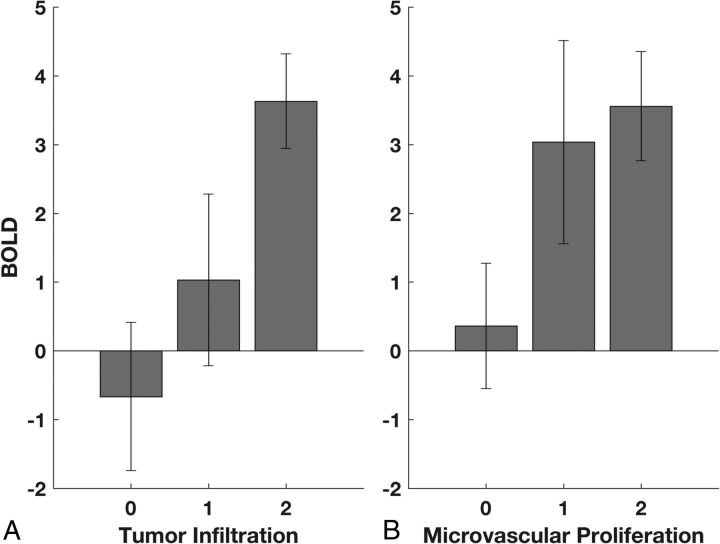
Results: Biopsies corresponded to a range of blood oxygen level-dependent signals, ranging from relatively normal (z = -4.79) to markedly abnormal (z = 8.84). Total cell density was directly related to blood oxygen level-dependent signal abnormality (P = .013, R2 = 0.19), while the neuronal labeling index was inversely related to blood oxygen level-dependent signal abnormality (P = .016, R2 = 0.21). The blood oxygen level-dependent signal abnormality was also related to tumor infiltration (P = .014) and microvascular proliferation (P = .045).

Conclusions: The relationship between local, neoplastic characteristics and a blood oxygen level-dependent biomarker of vascular function suggests that local effects of glioma cell infiltration contribute to vascular dysregulation.


Figures

Fig 1.
Fig 1.
Individual biopsies from areas of intact and disrupted vascular function exhibit distinct histopathologic characteristics. A, Biopsy locations overlaid onto T1 postcontrast, FLAIR, and BOLD images with correlative histopathology in B and C. The sample from relatively normal BOLD signal, representing normal vascular function (orange, B), shows normal cellularity and high NeuN staining, suggestive of noninfiltrated gray matter, whereas the sample from a region of BOLD signal abnormality (green, C) shows tumor tissue and no neuronal staining.
Fig 2.
Fig 2.
Effect of distance from contrast enhancement on cellularity, neuronal density, and BOLD signal abnormality. A, Cell density decreases with the distance to the nearest contrast-enhancing voxel (n = 31, P = .003). B, Neuronal density increases with the distance to contrast enhancement (n = 27, P = .032). C, Intensity of the BOLD biomarker decreases with the distance to contrast enhancement (n = 32, P = .004).
Fig 3.
Fig 3.
BOLD signal abnormality is related to total cell and neuronal density. A, After we controlled for the effect of distance on the BOLD signal, median cell density is positively related to the BOLD z statistic (n = 31, P = 2 × 10⁻⁵). B, The NeuN labeling index is inversely related to the BOLD z statistic (n = 27, P = .001).
Fig 4.
Fig 4.
BOLD signal abnormality is related to tumor infiltration and microvascular proliferation. A, ANOVA demonstrates a significant relationship between the BOLD z statistic and tumor infiltration (P = .014). Scores of 0, 1, and 2 represent no detectable tumor, infiltrating tumor, and highly cellular tumor, respectively. B, ANOVA demonstrates a significant relationship between the BOLD z statistic and microvascular proliferation (P = .045). Scores of 0, 1, and 2 represent normal vascular architecture, simple hyperplastic structures, and complex microvascular hyperplasia, respectively.

References

    1. Watkins S, Robel S, Kimbrough IF, et al. Disruption of astrocyte-vascular coupling and the blood-brain barrier by invading glioma cells. Nat Commun 2014;5:4196 10.1038/ncomms5196 - DOI - PMC - PubMed
    1. Persidsky Y, Ramirez SH, Haorah J, et al. Blood-brain barrier: structural components and function under physiologic and pathologic conditions. J Neuroimmune Pharmacol 2006;1:223–36 10.1007/s11481-006-9025-3 - DOI - PubMed
    1. Cuddapah VA, Robel S, Watkins S, et al. A neurocentric perspective on glioma invasion. Nat Rev Neurosci 2014;15:455–65 10.1038/nrn3765 - DOI - PMC - PubMed
    1. Wen PY, Macdonald DR, Reardon DA, et al. Updated response assessment criteria for high-grade gliomas: Response Assessment in Neuro-Oncology working group. J Clin Oncol 2010;28:1963–72 10.1200/JCO.2009.26.3541 - DOI - PubMed
    1. Pillai JJ, Zacà D. Comparison of BOLD cerebrovascular reactivity mapping and DSC MR perfusion imaging for prediction of neurovascular uncoupling potential in brain tumors. Technol Cancer Res Treat 2012;11:361–74 10.7785/tcrt.2012.500284 - DOI - PubMed

Publication types