

Knockdown of the mitochondria-localized protein p13 protects against experimental parkinsonism
- PMID: 29371327
- PMCID: PMC5836091
- DOI: 10.15252/embr.201744860
Knockdown of the mitochondria-localized protein p13 protects against experimental parkinsonism
Abstract
Mitochondrial dysfunction in the nigrostriatal dopaminergic system is a critical hallmark of Parkinson's disease (PD). Mitochondrial toxins produce cellular and behavioural dysfunctions resembling those in patients with PD Causative gene products for familial PD play important roles in mitochondrial function. Therefore, targeting proteins that regulate mitochondrial integrity could provide convincing strategies for PD therapeutics. We have recently identified a novel 13-kDa protein (p13) that may be involved in mitochondrial oxidative phosphorylation. In the current study, we examine the mitochondrial function of p13 and its involvement in PD pathogenesis using mitochondrial toxin-induced PD models. We show that p13 overexpression induces mitochondrial dysfunction and apoptosis. p13 knockdown attenuates toxin-induced mitochondrial dysfunction and apoptosis in dopaminergic SH-SY5Y cells via the regulation of complex I. Importantly, we generate p13-deficient mice using the CRISPR/Cas9 system and observe that heterozygous p13 knockout prevents toxin-induced motor deficits and the loss of dopaminergic neurons in the substantia nigra. Taken together, our results suggest that manipulating p13 expression may be a promising avenue for therapeutic intervention in PD.
Keywords: Parkinson's disease; cell death; complex I; mitochondria; p13.
© 2018 The Authors.
Figures
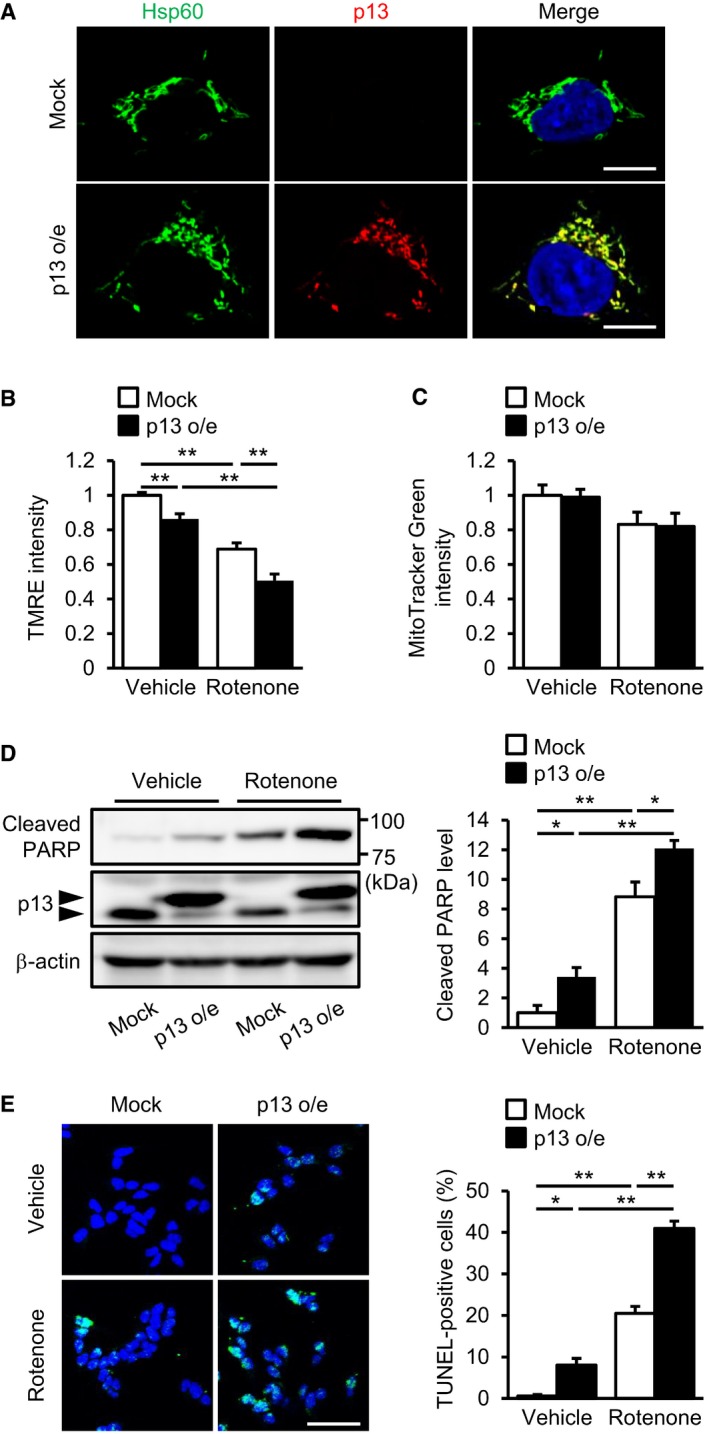
- A
Co‐localization of overexpressed p13 and Hsp60, a mitochondrial matrix protein, in p13‐infected cells. Nucleus was stained with Hoechst (blue). Scale bars, 10 μm.
- B, C
Exacerbated rotenone‐induced decrease in ΔΨm but no change in mitochondrial mass in p13‐infected cells. ΔΨm and mitochondrial mass were determined by measuring the fluorescence levels of TMRE (B) and MitoTracker Green FM (C), respectively.
- D, E
Exacerbated rotenone‐induced apoptosis in p13‐infected cells. Apoptosis levels were evaluated by measuring the increases in PARP cleavage (D) and in percentage of TUNEL‐positive cells (E). The levels of cleaved PARP were normalized to those of β‐actin (D). The percentage of TUNEL‐positive cells was determined by TUNEL (green) and Hoechst (blue, a nuclear marker) staining (E). Representative images (left) and their quantification (right) were shown. Scale bar, 50 μm.
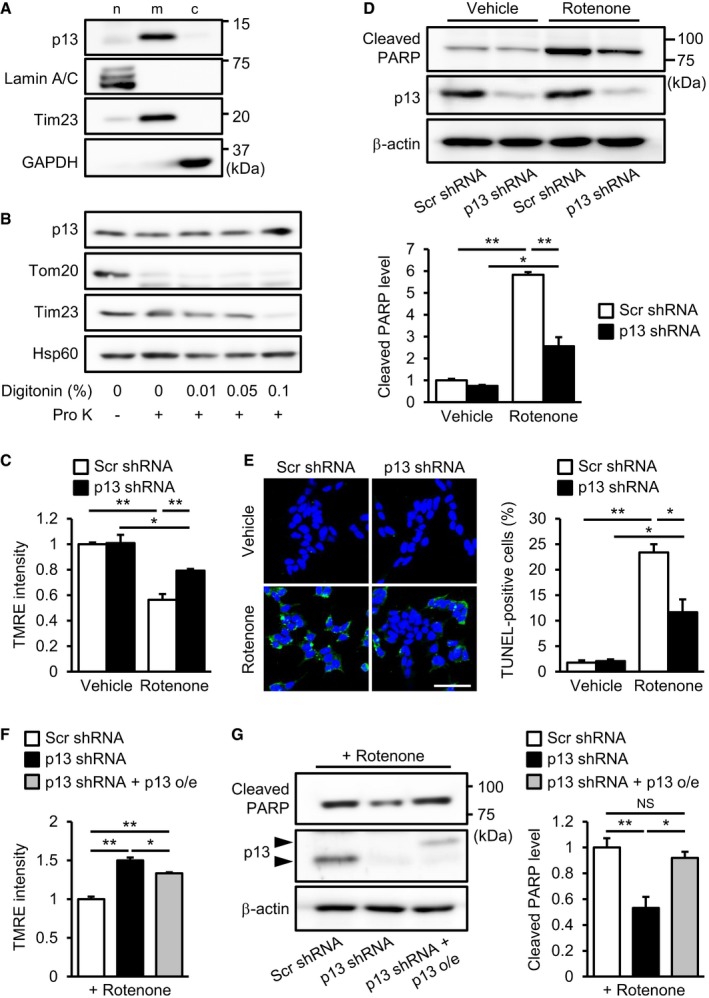
- A
Distribution of p13 in the nuclear (n)‐, mitochondria (m)‐ and cytosol (c)‐enriched fractions of SH‐SY5Y cells. The blot was probed with antibodies against p13, Lamin A/C (a nuclear marker), Tim23 (a mitochondrial marker) and GAPDH (a cytoplasmic marker).
- B
Mitochondrial localization of p13 in SH‐SY5Y cells. Isolated mitochondria were treated with 20 μg/ml proteinase K (Pro K) in the absence or presence of increasing concentrations of digitonin (0.01, 0.05 and 0.1%). Samples were subjected to Western blotting with antibodies against p13, Tom20 (outer mitochondrial membrane marker), Tim23 (inner mitochondrial membrane marker) and Hsp60 (mitochondrial matrix marker).
- C–E
Prevention of the rotenone‐induced decrease in ΔΨm (C), increase in PARP cleavage (D) and increase in percentage of TUNEL‐positive cells (E) in p13 shRNA‐infected cells. Scale bar, 50 μm.
- F, G
Attenuation of the rotenone‐induced decrease in ΔΨm (F) and increase in PARP cleavage (G) by the restoration of p13 expression in p13 shRNA‐infected cells. Arrowheads showed FLAG‐tagged p13 (p13 o/e) and endogenous p13.
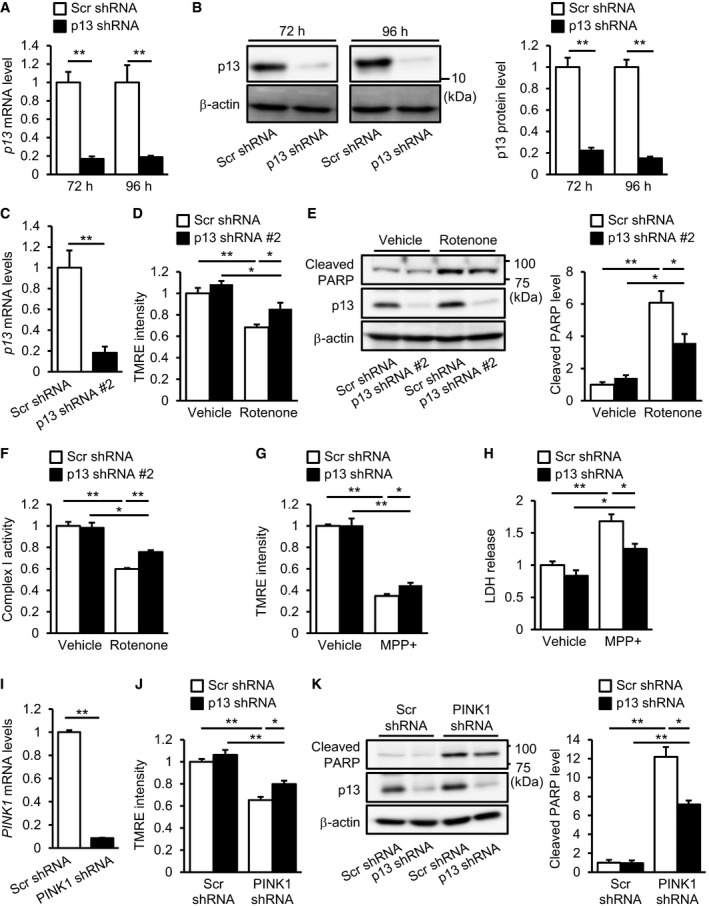
- A, B
Decreased expression of p13 mRNA (A) or p13 protein (B) in cells 72 or 96 h after infection with lentiviral vectors expressing p13 shRNA. mRNA levels were quantified by real‐time RT–PCR (A). The levels of cleaved PARP were normalized to those of β‐actin (B). Representative images (left) and their quantification (right) were shown.
- C
Decreased expression of p13 mRNA in cells 96 h after infection with lentiviral vectors expressing p13 shRNA #2. mRNA levels were quantified by real‐time RT–PCR.
- D–F
Prevention of the rotenone‐induced decrease in ΔΨm (D), increase in PARP cleavage (E) and decrease in complex I activity (F) in cells infected with lentiviral vectors expressing p13 shRNA #2. Complex I activity was measured on the basis of NADH‐oxidizing activity. Seventy‐two hours after infection, cells were exposed to vehicle or 100 nM rotenone for 24 h.
- G, H
Prevention of the MPP+‐induced decrease in ΔΨm (G) and release of LDH (H) in p13 shRNA‐infected cells. LDH release was measured in culture medium of SH‐SY5Y cells using the LDH assay kit. Seventy‐two hours after infection, cells were treated with vehicle or 5 mM MPP+ for 24 h.
- I
Decreased expression of PINK1 mRNA in cells 96 h after infection with lentiviral vectors expressing PINK1 shRNA. mRNA levels were quantified by real‐time RT–PCR.
- J, K
Prevention of the PINK1‐knockdown‐induced decrease in ΔΨm (J) and increase in PARP cleavage (K) in p13 shRNA‐infected cells 96 h after infection with lentiviral vectors.
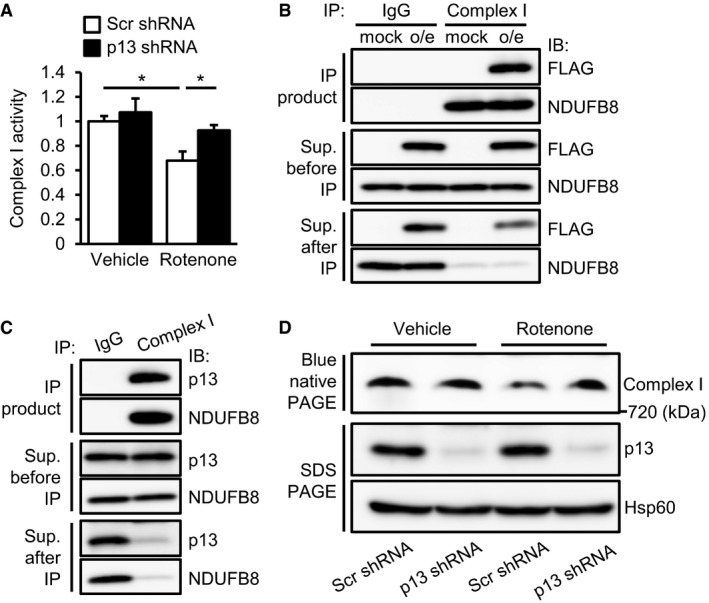
- A
Prevention of the rotenone‐induced decrease in complex I activity in p13 shRNA‐infected cells. Complex I activity was measured on the basis of NADH‐oxidizing activity. Data are presented as the mean ± SEM (n = 3). *P < 0.05 by the Tukey–Kramer test.
- B, C
Physical interaction between overexpressed p13 (B) or endogenous p13 (C) and complex I proteins. Lysates were immunoprecipitated with anti‐complex I antibody and control IgG. The lysates and immunoprecipitates were subjected to Western blotting with antibodies against FLAG (B), p13 (C) or NDUFB8 (complex I protein). Cells were infected with lentiviral vectors expressing mock or FLAG‐tagged p13 (p13 o/e, B).
- D
Prevention of rotenone‐induced impairment of complex I assembly by p13 knockdown in p13 shRNA‐infected cells. Mitochondrial fractions were subjected to blue native PAGE, followed by Western blotting with an antibody against NDUFB8 (complex I protein). Levels of p13 and Hsp60 (for loading control) in the mitochondrial fraction were analysed.
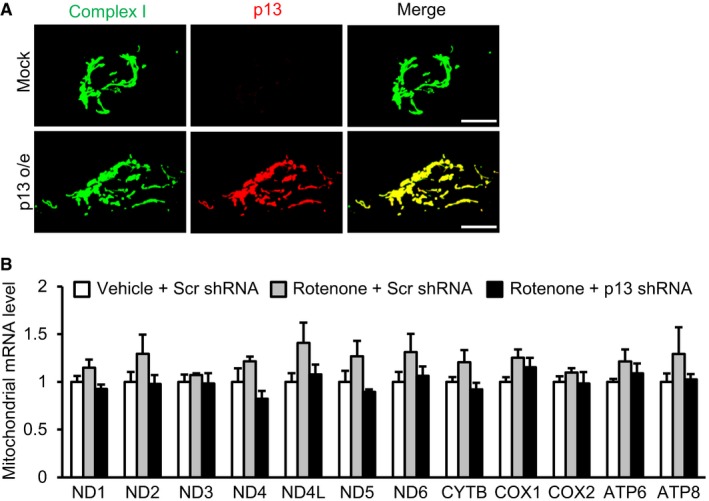
Co‐localization of overexpressed p13 and complex I proteins in cells infected with lentiviral vectors expressing FLAG‐tagged p13 (p13 o/e). Overexpressed p13 was detected using an antibody against p13. Scale bars, 10 μm.
Effects of p13 knockdown on the mRNAs encoded by the mitochondrial genome in cells. Seventy‐two hours after infection with lentiviral vectors expressing scrambled shRNA (Scr shRNA) or p13 shRNA, cells were treated with vehicle or rotenone for 24 h. mRNA levels of each gene were normalized to those in vehicle‐treated and Scr shRNA‐infected cells. Data are presented as the mean ± SEM (n = 3).
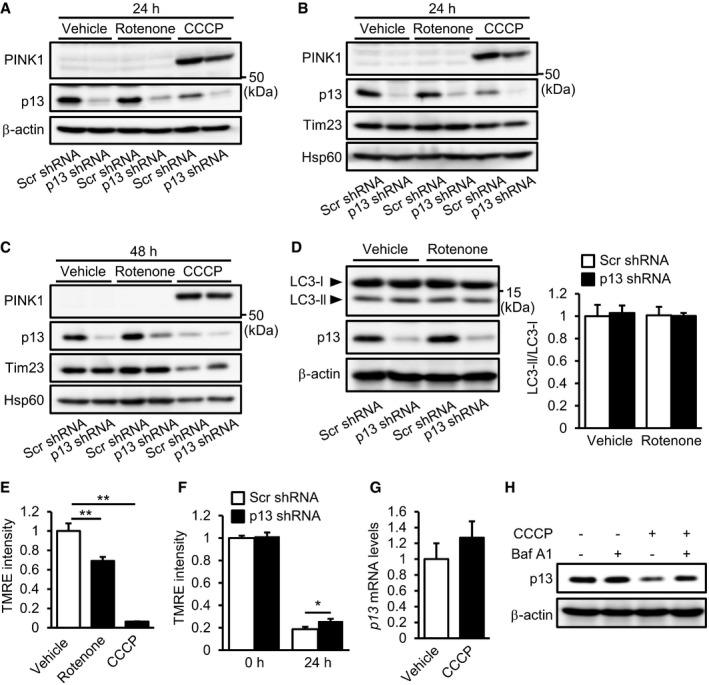
- A
PINK1 accumulation in p13 shRNA‐infected SH‐SY5Y cells. Seventy‐two hours after infection, cells were exposed to vehicle, 100 nM rotenone or 10 μM CCCP for 24 h. Total cell lysates were subjected to Western blotting with antibodies against PINK1, p13 and β‐actin.
- B, C
PINK1 accumulation in isolated mitochondria from p13 shRNA‐infected cells. Seventy‐two hours after infection, cells were exposed to vehicle, 100 nM rotenone or 10 μM CCCP for 24 h (B) or 48 h (C). Mitochondrial fractions were purified and subjected to Western blotting with antibodies against PINK1, p13, Tim23 and Hsp60.
- D
No significant change in autophagy induction by p13 knockdown in p13 shRNA‐infected cells. Seventy‐two hours after infection, cells were exposed to vehicle or 100 nM rotenone for 24 h. Autophagy was measured by the conversion of cytosolic LC3‐I to the autophagosome‐associated LC3‐II. Representative images (left) and the quantification of the ratio of LC3‐II to LC3‐I (right). Total cell lysates were subjected to Western blotting with antibodies against LC3, p13 and β‐actin.
- E
Decrease in ΔΨm in SH‐SY5Y cells 24 h after treatment with 100 nM rotenone or 10 μM CCCP. ΔΨm was determined by measuring the TMRE fluorescence levels.
- F
Attenuated CCCP‐induced decrease in ΔΨm in p13 shRNA‐infected SH‐SY5Y cells. ΔΨm was determined by measuring the TMRE fluorescence levels. Seventy‐two hours after infection, cells were exposed to vehicle or 10 μM CCCP for 24 h.
- G
No change in expression of p13 mRNA 24 h after treatment of 10 μM CCCP in SH‐SY5Y cells. mRNA levels were quantified by real‐time RT–PCR.
- H
Blockage of the CCCP‐induced decrease in p13 expression by bafilomycin A1 (BafA1) in SH‐SY5Y cells. Cells were exposed to vehicle or 10 μM CCCP for 24 h. Cells were treated with or without 50 nM BafA1 for 2 h before harvest. Total cell lysates of these cells were subjected to Western blotting with antibodies against p13 and β‐actin.
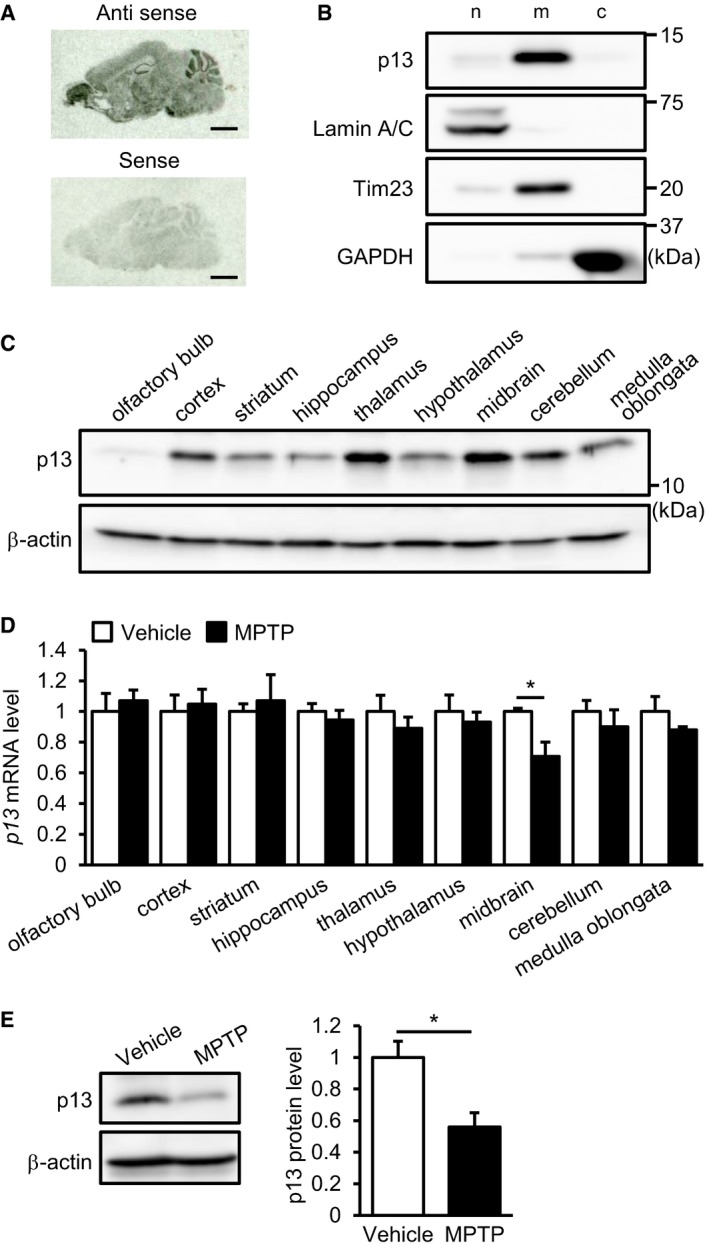
Distribution of p13 mRNA in sagittal brain sections of mice analysed by in situ hybridization. Scale bars, 2 mm.
Distribution of p13 in nuclear (n)‐, mitochondria (m)‐ and cytosol (c)‐enriched fractions of the mouse brain. The nuclear, mitochondria and cytosol fractions were purified and subjected to Western blotting with antibodies against p13, Lamin A/C (a nuclear marker), Tim23 (a mitochondrial marker) and GAPDH (a cytoplasmic marker).
Expression of p13 protein in various brain regions of mice. Brain lysates of each region were prepared and subjected to Western blotting with antibodies against p13 and β‐actin.
Expression of p13 mRNA in various brain regions of mice treated with 10 mg/kg MPTP. mRNA levels were quantified by real‐time RT–PCR. The mRNA level in each brain region of the MPTP‐treated mice was normalized to that of vehicle‐treated mice.
Expression of p13 protein in the midbrain of mice treated with 10 mg/kg MPTP. Total lysates were subjected to Western blotting with antibodies against p13 and β‐actin. p13 levels were normalized to β‐actin levels.
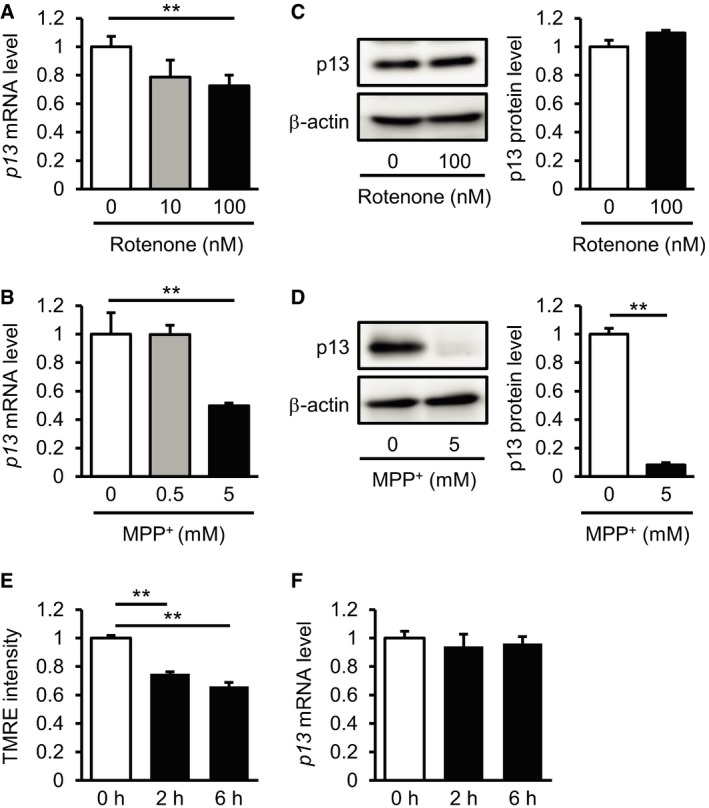
- A, B
Decreased expression of p13 mRNA 24 h after treatment with 100 nM rotenone (A) or 5 mM MPP+ (B) in SH‐SY5Y cells. mRNA levels were quantified by real‐time RT–PCR.
- C
No change in expression of p13 protein 24 h after treatment with 100 nM rotenone in SH‐SY5Y cells. Total cell lysates were subjected to Western blotting with antibodies against p13 and β‐actin. The levels of p13 were normalized to those of β‐actin.
- D
Decreased expression of p13 protein 24 h after treatment with 5 mM MPP+ in SH‐SY5Y cells. Total cell lysates were subjected to Western blotting with antibodies against p13 and β‐actin. The levels of p13 were normalized to those of β‐actin.
- E
Decrease in ΔΨm in SH‐SY5Y cells 2 or 6 h after treatment with 100 nM rotenone. ΔΨm was determined by measuring the TMRE fluorescence levels.
- F
Expression of p13 mRNA in SH‐SY5Y cells 2 or 6 h after treatment with 100 nM rotenone. mRNA levels were quantified by real‐time RT–PCR.
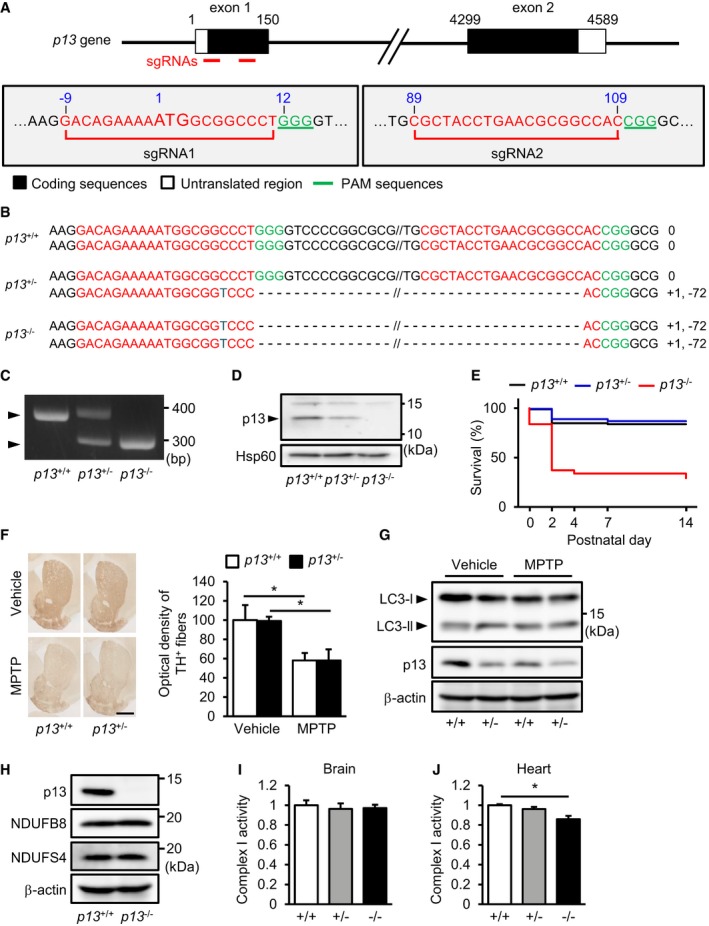
- A
Schematic diagram of single‐guide RNAs (sgRNAs) targeting the mouse p13 gene. Two sgRNA sequences, sgRNA1 and sgRNA2, are shown in red. The protospacer adjacent motif (PAM) sequences are shown in green.
- B
Genomic sequence analysis of the obtained p13 +/+, p13 +/− and p13 −/− mice. p13 +/− and p13 −/− mice harboured a 71‐bp deletion in exon 1 of the p13 gene.
- C
Genotyping indicated of p13 +/+, p13 +/− and p13 −/− mice by genomic PCR using primers for p13 (see Materials and Methods).
- D
Expression of p13 in mitochondria from the brains of p13 +/+, p13 +/− and p13 −/− mice. Mitochondrial fractions were purified and subjected to Western blotting with antibodies against p13 and Hsp60 (control).
- E
Kaplan–Meier survival curves for p13 +/+, p13 +/− and p13 −/− mice (p13 +/+, n = 86; p13 +/−, n = 143; and p13 −/−, n = 65).
- F
No significant change in the MPTP‐induced decrease in optical density of TH+ fibres in the striatum of p13 +/+ and p13 +/− mice, as analysed by immunohistochemistry (n = 3). Representative images (left) and the quantification of optical density of TH+ fibres in the striatum (right). Scale bar, 1 mm.
- G
No significant changes in autophagy induction in the substantia nigra of MPTP‐treated p13 +/+ and p13 +/− mice. Autophagy was measured by the conversion of LC3‐I to LC3‐II. Total lysates were subjected to Western blotting with antibodies against LC3, p13 and β‐actin.
- H
Expression of p13, NDUFB8 and NDUFS4 in the brains of p13 +/+ and p13 −/− mice. Total cell lysates were subjected to Western blotting with antibodies against p13, NDUFB8, NDUFS4 and β‐actin.
- I, J
Complex I activity in the brains (I) or the hearts (J) of p13 +/+, p13 +/− and p13 −/− mice. Brain or heart extracts were prepared, and complex I activity was measured based on NADH‐oxidizing activity.
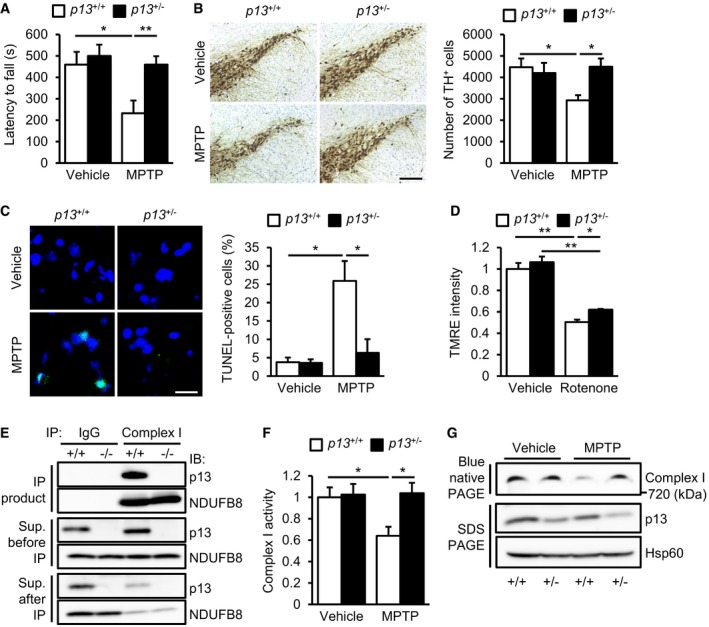
Prevention of MPTP‐induced motor deficits on the rotarod test in p13 +/− mice. Latency to fall in two consecutive trials is presented (n = 10).
Prevention of MPTP‐induced decrease in TH+ neurons in the substantia nigra of p13 +/− mice analysed by immunohistochemistry (n = 4). Representative images (left) and the quantification of the number of TH+ cells in the substantia nigra (right). Scale bar, 200 μm.
Prevention of MPTP‐induced increase in TUNEL‐positive cells in the substantia nigra of p13 +/− mice (n = 3). Representative images (left, TUNEL, shown in green; Hoechst, shown in blue) and the quantification of percentage of TUNEL‐positive cells (right). Scale bar, 20 μm.
Attenuation of rotenone‐induced decrease in ΔΨm in isolated mitochondria from the midbrain of p13 +/− mice (n = 3). Isolated mitochondria were exposed to 1 μM rotenone for 10 min.
Physical interaction between endogenous p13 and complex I proteins in the brain. Brain extracts from p13 +/+ and p13 −/− mice were immunoprecipitated with anti‐complex I antibody and control IgG. The lysates and immunoprecipitates were subjected to Western blotting with antibodies against p13 and NDUFB8 (complex I protein).
Prevention of the MPTP‐induced decrease in complex I activity in the midbrain of p13 +/− mice (n = 3). Complex I activity was measured on the basis of NADH‐oxidizing activity.
Prevention of MPTP‐induced impairment of complex I assembly in the midbrain of p13 +/− mice. Mitochondrial fractions were subjected to blue native PAGE, followed by Western blotting with an antibody against NDUFB8 (complex I protein). Levels of p13 and Hsp60 (for loading control) in the mitochondrial fraction were analysed.
Comment in
-
p13 protects against Parkinson's disease.EMBO Rep. 2018 Mar;19(3):e45900. doi: 10.15252/embr.201845900. Epub 2018 Feb 19. EMBO Rep. 2018. PMID: 29459485 Free PMC article.
References
-
- Postuma RB, Berg D, Stern M, Poewe W, Olanow CW, Oertel W, Obeso J, Marek K, Litvan I, Lang AE et al (2015) MDS clinical diagnostic criteria for Parkinson's disease. Mov Disord 30: 1591–1601 - PubMed
-
- Jenner P (2008) Molecular mechanisms of L‐DOPA‐induced dyskinesia. Nat Rev Neurosci 9: 665–677 - PubMed
-
- Athauda D, Foltynie T (2015) The ongoing pursuit of neuroprotective therapies in Parkinson disease. Nat Rev Neurol 11: 25–40 - PubMed
-
- Kalia LV, Kalia SK, Lang AE (2015) Disease‐modifying strategies for Parkinson's disease. Mov Disord 30: 1442–1450 - PubMed
Publication types
MeSH terms
Substances
Supplementary concepts
LinkOut - more resources
Full Text Sources
Other Literature Sources
Medical
Molecular Biology Databases
