. 2018 Jan 25;9(1):374.
doi: 10.1038/s41467-017-02795-4.

AMPK activation counteracts cardiac hypertrophy by reducing O-GlcNAcylation

Affiliations

AMPK activation counteracts cardiac hypertrophy by reducing O-GlcNAcylation

Roselle Gélinas et al. Nat Commun. .

Abstract

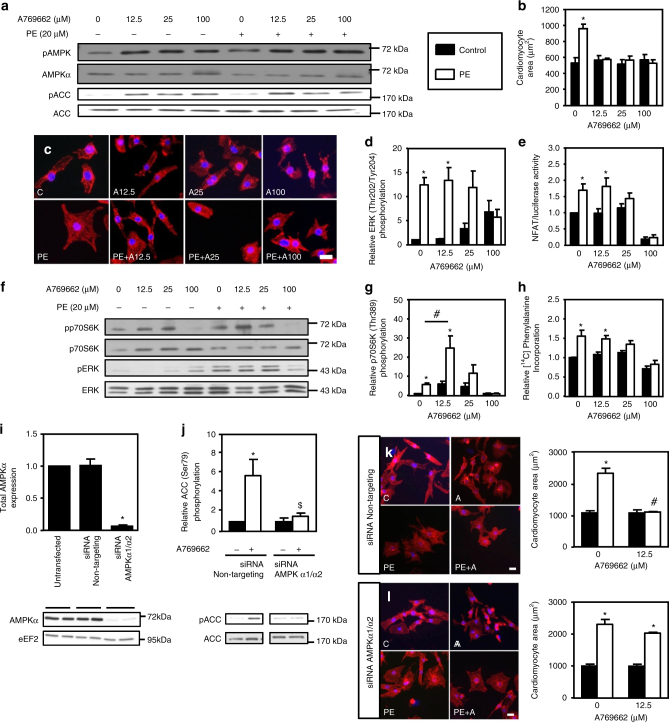
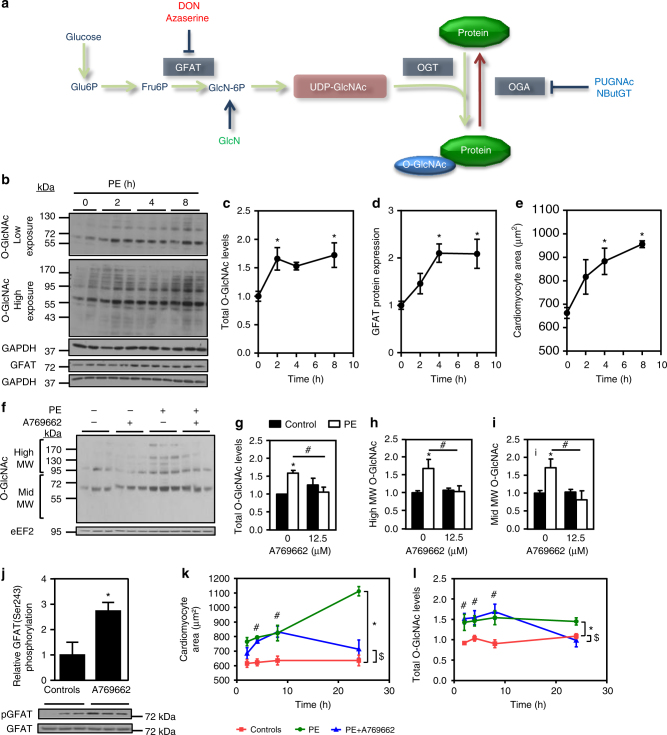
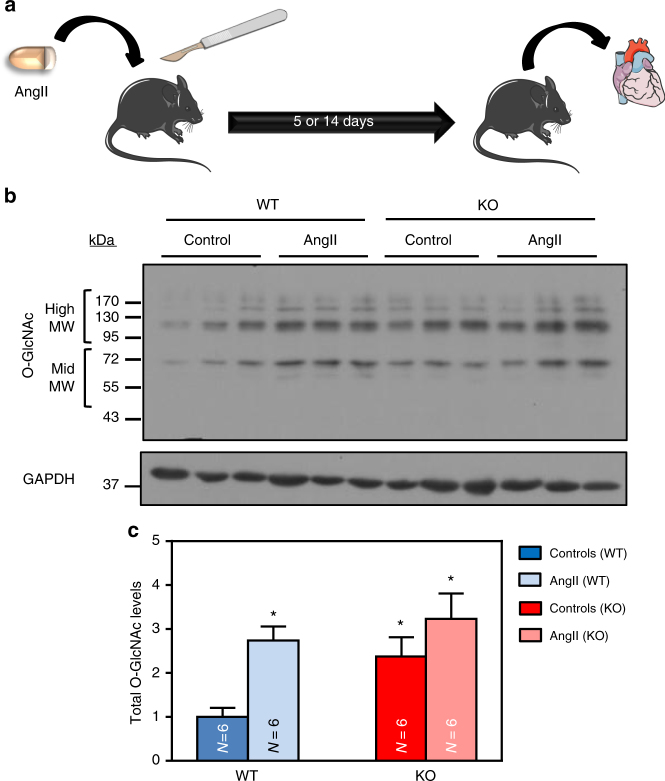
AMP-activated protein kinase (AMPK) has been shown to inhibit cardiac hypertrophy. Here, we show that submaximal AMPK activation blocks cardiomyocyte hypertrophy without affecting downstream targets previously suggested to be involved, such as p70 ribosomal S6 protein kinase, calcineurin/nuclear factor of activated T cells (NFAT) and extracellular signal-regulated kinases. Instead, cardiomyocyte hypertrophy is accompanied by increased protein O-GlcNAcylation, which is reversed by AMPK activation. Decreasing O-GlcNAcylation by inhibitors of the glutamine:fructose-6-phosphate aminotransferase (GFAT), blocks cardiomyocyte hypertrophy, mimicking AMPK activation. Conversely, O-GlcNAcylation-inducing agents counteract the anti-hypertrophic effect of AMPK. In vivo, AMPK activation prevents myocardial hypertrophy and the concomitant rise of O-GlcNAcylation in wild-type but not in AMPKα2-deficient mice. Treatment of wild-type mice with O-GlcNAcylation-inducing agents reverses AMPK action. Finally, we demonstrate that AMPK inhibits O-GlcNAcylation by mainly controlling GFAT phosphorylation, thereby reducing O-GlcNAcylation of proteins such as troponin T. We conclude that AMPK activation prevents cardiac hypertrophy predominantly by inhibiting O-GlcNAcylation.


Conflict of interest statement

The authors declare no competing financial interests.

Figures

Fig. 1
Fig. 1
A769662 prevents NRVM hypertrophy. ah NRVMs were treated with (open bars) or without (solid bars) phenylephrine (PE, 20 µM) in the presence or absence of increasing concentration of A769662 (from 12.5 to 100 µM) for 24 h except for ERK1/2 phosphorylation which has been evaluated after 1 h. a Representative immunoblot of AMPKThr172 and ACCSer79 phosphorylation. b, c Representative images and quantification of cardiomyocyte area evaluated after α-actinin immunostaining. Scale bar, 20 µm. N = 3. d Quantification of ERKThr202/Tyr204 phosphorylation. N = 3. e Evaluation of NFAT transcriptional activity by luciferase activity. N = 3. f Representative immunoblots of p70S6KThr389 and ERKThr202/Tyr204 phosphorylation. g Quantification of p70S6KThr389 phosphorylation. N = 4. h Amino acids incorporation into proteins measured by [14C]-phenylalanine incorporation. N = 3. il NRVMs were transfected with control non-targeting siRNA or AMPKα1/α2 siRNA (50 nM) for 66 h. Then, NRVMs were treated with (open bars) or without (solid bars) phenylephrine (PE, 20 μM) in the presence or absence of A769662 (12.5 μM) for 24 h. i Representative immunoblot and quantification of total AMPKα. N = 3. j Representative immunoblot and quantification of ACCSer79 phosphorylation. N = 3. k Representative images and quantification of cardiomyocyte area evaluated after α-actinin immunostaining of NRVMs transfected with non-targeting siRNA. Scale bar, 20 µm. N = 3. l Representative images and quantification of cardiomyocyte area evaluated after α-actinin immunostaining of NRVMs transfected with AMPKα1/α2 siRNA. Scale bar, 20 µm. N = 3. Data in (al) are mean ± s.e.m. The data were analyzed using One-way ANOVA followed by Bonferroni post-test in (i) and Two-way ANOVA followed by Bonferroni post-test in (b, d, e, g, h, and jl). *p < 0.05 vs. untreated cells, #p < 0.05 vs. corresponding PE-treated cells, $p < 0.05 vs. cells transfected with non-targeting siRNA. eEF2 was used as a loading control
Fig. 2
Fig. 2
AICAr and phenformin mimick A769662 effects. ae NRVMs were treated with (open bars) or without (solid bars) phenylephrine (PE, 20 µM) in the presence or not of AICAr (from 0.06 to 1 mM) for 24 h except for ERK1/2 phosphorylation which has been evaluated after 1 h. a, b Representative images and quantification of cardiomyocyte area evaluated after α-actinin immunostaining. Scale bar, 20 µm. N = 3. c Representative immunoblots of AMPKThr172, ACCSer79, ERKThr202/Tyr204 and p70S6KThr389 phosphorylation. d Evaluation of NFAT transcriptional activity by luciferase activity. N = 3. e Amino acids incorporation into proteins measured by [14C]-phenylalanine incorporation. N = 5. fj NRVMs were treated with (open bars) or without (solid bars) phenylephrine (PE, 20 µM) in the presence or not of phenformin (from 0.01 to 1 mM) for 24 h except for ERK1/2 phosphorylation which has been evaluated after 1 h. f, g Representative images and quantification of cardiomyocyte area evaluated after α-actinin immunostaining. Scale bar, 20 µm. N = 3. h Representative immunoblots of AMPKThr172, ACCSer79, ERKThr202/Tyr204, and p70S6KThr389 phosphorylation. i Evaluation of NFAT transcriptional activity by luciferase activity. N = 3. j Amino acids incorporation into proteins measured by [14C]-phenylalanine incorporation. N = 4. Data in (aj) are mean ± s.e.m. The data in (b, d, e, g, and i, j) were analyzed using Two-way ANOVA followed by Bonferroni post-test. *p < 0.05 vs. untreated cells
Fig. 3
Fig. 3
AMPK activation reduces protein O-GlcNAcylation. a Schematic representation of the HBP/O-GlcNAcylation pathway. be NRVMs were treated with phenylephrine (PE, 20 µM) for increasing time periods (from 2 to 8 h). b Representative immunoblots of protein O-GlcNAcylation levels and GFAT protein expression. c Quantification of protein O-GlcNAcylation levels. N = 5. d Quantification of GFAT protein expression. N = 5. e Quantification of cardiomyocyte area evaluated after α-actinin immunostaining. N = 3. fi NRVMs were treated with (open bars) or without (solid bars) phenylephrine (PE, 20 µM) in the presence or not of A769662 (12.5 µM) for 24 h. Representative immunoblot and quantification of protein O-GlcNAcylation levels. N = 3. j Representative immunoblot and quantification of GFATSer243 phosphorylation in NRVMs treated 1 h with A769662. N = 3. kl NRVMs were treated with phenylephrine (PE, 20 µM) in the presence or absence of A769662 (12.5 µM) for increasing time periods (from 2 to 24 h). k Quantification of cardiomyocyte area evaluated after α-actinin immunostaining. N = 3–6. l Quantification of protein O-GlcNAcylation levels. N = 5–7. Data in (cl) are mean ± s.e.m. The data were analyzed using Two-way ANOVA followed by Bonferroni post-test in (gi) and (k, l), One-way Anova followed by Bonferroni post-test in (ce) and unpaired Student’s t-test in (j). *p < 0.05 vs. untreated cells, #p < 0.05 vs. PE-treated cells for (ce and j. *p < 0.05 global effect of PE vs. controls, $p < 0.05 global effect of PE + A vs. controls and #p < 0.05 PE + A vs. controls at each time point for (k, l). GAPDH and eEF2 were used as loading control, MW molecular weight
Fig. 4
Fig. 4
Glucosamine or PUGNAc prevents the anti-hypertrophic action of AMPK. ad NRVMs were treated with (open bars) or without (solid bars) phenylephrine (PE, 20 µM) in the presence or absence of A769662 (12.5 µM), phenformin (phen, 0.03 mM), AICAr (0.25 mM), PUGNAc (50 µM) and/or glucosamine (GlcN, 5 mM) for 24 h. a Representative immunoblot of protein O-GlcNAcylation levels and ACCSer79 phosphorylation in GlcN experiments. b Effect of GlcN on the anti-hypertrophic action of AMPK activators. N = 3. c Representative immunoblot of protein O-GlcNAcylation levels and ACCSer79 phosphorylation in PUGNAc experiments. d Effect of PUGNAc on the anti-hypertrophic action of AMPK activators. N = 3. e Quantification of cardiomyocyte area of NRVMs treated with (open bars) or without (solid bars) phenylephrine (PE, 20 µM) in the presence or not of Azaserine (Aza, 5 µM), DON (20 µM) and/or glucosamine (GlcN, 5 mM) for 24 h. N = 3. Data in (b, d and e) are mean ± s.e.m. The data were analyzed using Two-way ANOVA followed by Bonferroni post-test in (b, d and e). *p < 0.05 vs. untreated cells. eEF2 was used as loading control, MW molecular weight
Fig. 5
Fig. 5
O-GlcNAc levels are increased in AMPKα2 KO mice. ae Representative immunoblot and quantification of protein O-GlcNAcylation levels (b), GFAT (c), OGT (d), OGA (e) and AMPKα2 expression in AMPKα2 KO mice compared to control littermates (WT). N = 4. Data in be are expressed as mean ± s.e.m. The data were analyzed using unpaired Student’s t-test. *p < 0.05 vs. WT. GAPDH was used as loading control, MW molecular weight
Fig. 6
Fig. 6
AngII treatment increases O-GlcNAc levels in the presence of AMPK. WT (in blue) and AMPKα2 KO (in red) mice were treated with or without angiotensin II (AngII, 2 mg/kg/d) for 5 days in order to evaluate O-GlcNAcylated protein levels. a Schematic representation of the experimental protocol where mice were treated for 5 or 14 days in order to evaluate O-GlcNAcylated protein levels or cardiac hypertrophy respectively. b Representative immunoblot of protein O-GlcNAcylation levels in WT and AMPKα2 KO mouse hearts. c Quantification of protein O-GlcNAcylation levels in WT and AMPKα2 KO mouse hearts. N = 6. Data in c are expressed as mean ± s.e.m and were analyzed using Two-way ANOVA followed by Bonferroni post-test. *p < 0.05 vs. untreated WT mice. GAPDH is used as loading control, MW molecular weight
Fig. 7
Fig. 7
Metformin prevents cardiac hypertrophy in an AMPK-dependent manner. af WT (in blue) and AMPKα2 KO (in red) mice were treated with or without angiotensin II (AngII, 2 mg/kg/d) in the presence or absence of metformin (met, 200 mg/kg/d) for 14 days in order to evaluate cardiac hypertrophy. a Left ventricular (LV) mass on tibia length (TL) ratio in WT mice. N = 5–9 bc Representative images and quantification of myocyte cross sectional area evaluated after WGA staining in WT mouse hearts. Scale bar, 10 µm. N = 4–6 d LV mass on TL ratio in AMPKα2 KO mice. N = 5–8 ef Representative images and quantification of myocyte cross sectional area evaluated after WGA staining in AMPKα2 KO mouse hearts. Scale bar, 10 µm. N = 4–6. Data in (a, c, d, and f) are expressed as mean ± s.e.m. and were analyzed using Two-way ANOVA followed by Bonferroni post-test. *p < 0.05 vs. untreated mice, #p < 0.05 vs. AngII-treated mice
Fig. 8
Fig. 8
NButGT prevents the anti-hypertrophic effect of metformin. ag WT (in blue) and AMPKα2 KO (in red) mice were treated with or without angiotensin II (AngII, 2 mg/kg/d) in the presence or absence of metformin (met, 200 mg/kg/d). Two groups of WT mice also received NButGT (50 mg/kg/d). a, b Representative images and quantification of myocyte cross sectional area after WGA staining in WT mouse heart. Scale bar, 10 µm. N = 6–12 (c) Left ventricular (LV) mass on tibia length (TL) ratio in WT mice. N = 6–15 d, e Representative immunoblot and quantification of total O-GlcNAc levels in WT mouse hearts. N = 4–5 f, g Representative immunoblot and quantification of total O-GlcNAc levels in AMPKα2 KO mouse hearts. N = 4–5. Data in (b, c, e, and g) are expressed as mean ± s.e.m. and were analyzed using One-way ANOVA followed by Bonferroni post-test. *p < 0.05 vs. untreated mice, #p < 0.05 vs. AngII-treated mice, $p < 0.05 vs. AngII + met-treated mice. GAPDH was used as loading control, MW molecular weight
Fig. 9
Fig. 9
AMPK activation promotes GFAT phosphorylation in vivo. aj WT (in blue) and AMPKα2 KO (in red) mice were treated with or without angiotensin II (AngII, 2 mg/kg/d) in the presence or absence of metformin (met, 200 mg/kg/d). a Representative immunoblot and quantification of GFAT protein expression in WT mouse hearts. N = 4–7 b Representative immunoblots of GFATSer243, AMPKThr172, and ACCSer79 phosphorylation in WT mouse hearts. c Quantification of GFATSer243 phosphorylation in WT mouse hearts. N = 3 d Quantification of AMPKThr172 phosphorylation in WT mouse hearts. N = 3–4 e Quantification of ACCSer79 phosphorylation in WT mouse hearts. N = 7 f Representative immunoblot and quantification of GFAT protein expression in AMPKα2 KO mouse hearts. N = 3 g Representative immunoblots of GFATSer243, AMPKThr172, and ACCSer79 phosphorylation in AMPKα2 KO mouse hearts. h Quantification of GFATSer243 phosphorylation in AMPKα2 KO mouse hearts. N = 3 i Quantification of AMPKThr172 phosphorylation in AMPKα2 KO mouse hearts. N = 5 j Quantification of ACCSer79 phosphorylation in AMPKα2 KO mouse hearts. N = 6. Data in (aj) are expressed as mean ± s.e.m. The data were analyzed using One-way ANOVA followed by Bonferroni post-test in (a, f) and unpaired Student’s t-test in (ce and hj). *p < 0.05 vs. untreated mice. GAPDH was used as loading control
Fig. 10
Fig. 10
AMPK activation regulates OGT expression and troponin T O-GlcNAc level. a, b WT (in blue) and AMPKα2 KO (in red) mice were treated with or without Angiotensin II (AngII, 2 mg/kg/d) for 5 days. a Representative immunoblot and quantification of OGT protein expression in WT mouse hearts. N = 6 b Representative immunoblot and quantification of OGT protein expression in AMPKα2 KO mouse hearts. N = 6 c, d WT (in blue) and AMPKα2 KO (in red) mice were treated with or without Angiotensin II (AngII, 2 mg/kg/d) in the presence or absence of metformin (met, 200 mg/kg/d) for 5 days. c Representative immunoblot and quantification of OGT protein expression in WT mouse hearts. N = 7 d Representative immunoblot and quantification of OGT protein expression in AMPKα2 KO mouse hearts. N = 5 e Representative immunoblot and quantification of O-GlcNAcylated troponin T (TnT) in WT mouse hearts. N = 6 f Representative immunoblot and quantification of O-GlcNAcylated TnT in AMPKα2 KO mouse hearts. N = 5 g Schematic model of the proposed interplay in the regulation of cardiac hypertrophy by O-GlcNAcylation and AMPK. Data in (af) are expressed as mean ± s.e.m. The data were analyzed using One-way ANOVA followed by Bonferroni post-test in (e, f) and unpaired Student’s t-test in (ad). *p < 0.05 vs. untreated mice, #p < 0.05 vs. AngII-treated mice. GAPDH was used as a loading control

Comment in

References

    1. Levy D, Larson MG, Vasan RS, Kannel WB, Ho KK. The progression from hypertension to congestive heart failure. JAMA. 1996;275:1557–1562. doi: 10.1001/jama.1996.03530440037034. - DOI - PubMed
    1. Lorell BH, Carabello BA. Left ventricular hypertrophy: pathogenesis, detection, and prognosis. Circulation. 2000;102:470–479. doi: 10.1161/01.CIR.102.4.470. - DOI - PubMed
    1. Heineke J, Molkentin JD. Regulation of cardiac hypertrophy by intracellular signalling pathways. Nat. Rev. Mol. Cell Biol. 2006;7:589–600. doi: 10.1038/nrm1983. - DOI - PubMed
    1. van Berlo JH, Maillet M, Molkentin JD. Signaling effectors underlying pathologic growth and remodeling of the heart. J. Clin. Invest. 2013;123:37–45. doi: 10.1172/JCI62839. - DOI - PMC - PubMed
    1. Tham YK, Bernardo BC, Ooi JY, Weeks KL, McMullen JR. Pathophysiology of cardiac hypertrophy and heart failure: signaling pathways and novel therapeutic targets. Arch. Toxicol. 2015;89:1401–1438. doi: 10.1007/s00204-015-1477-x. - DOI - PubMed

Publication types

MeSH terms