. 2018 Jan 25;8(1):1565.
doi: 10.1038/s41598-018-19275-4.

Risks, Release and Concentrations of Engineered Nanomaterial in the Environment

Affiliations

Risks, Release and Concentrations of Engineered Nanomaterial in the Environment

Bernd Giese et al. Sci Rep. .

Abstract

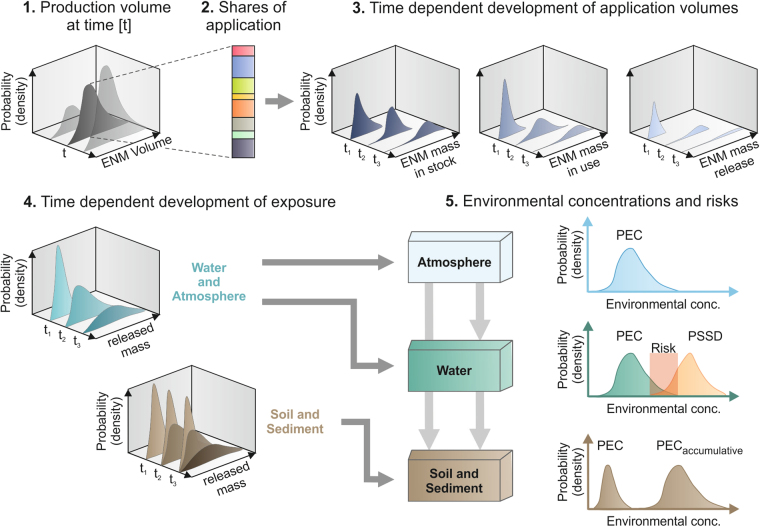
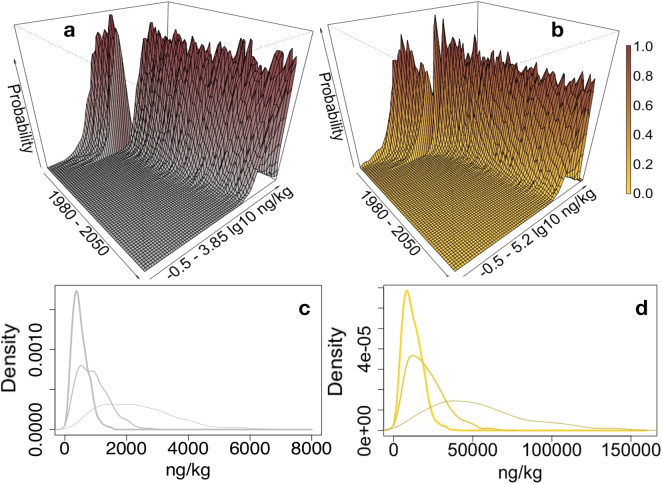
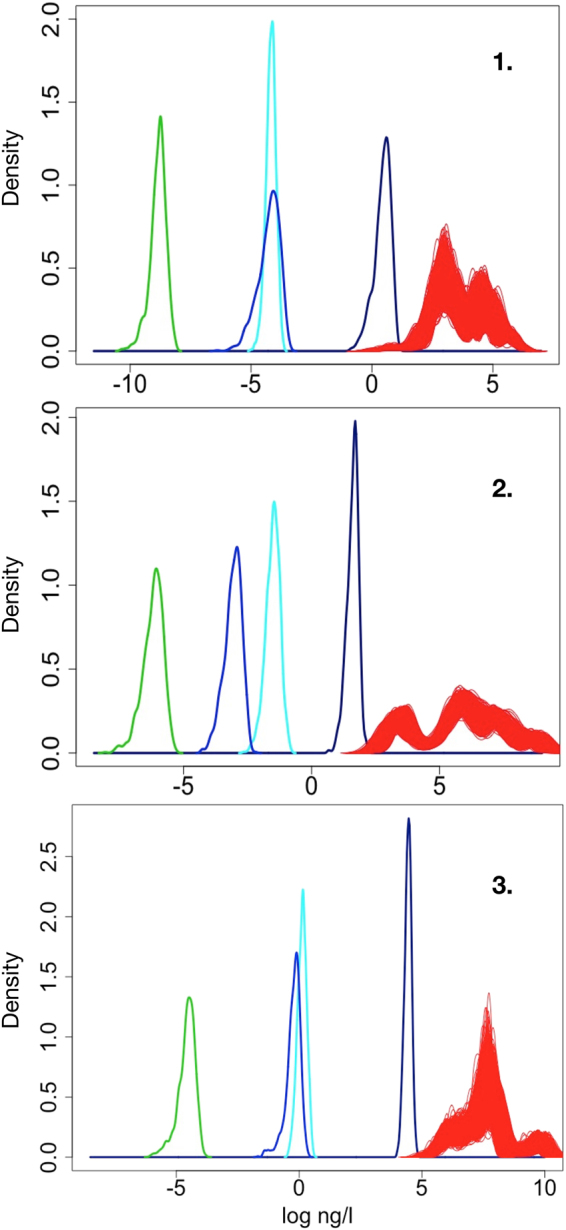
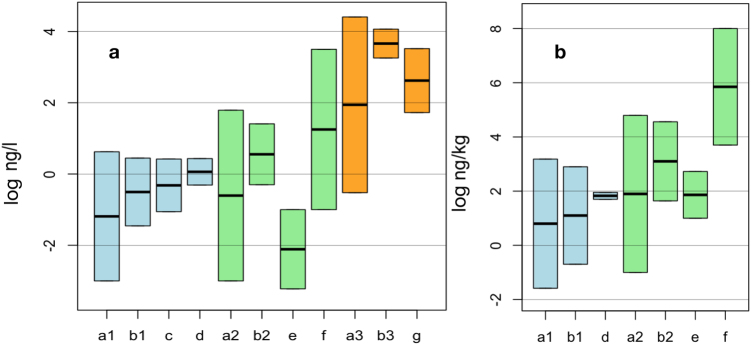
For frequently used engineered nanomaterials (ENMs) CeO2-, SiO2-, and Ag, past, current, and future use and environmental release are investigated. Considering an extended period (1950 to 2050), we assess ENMs released through commercial activity as well as found in natural and technical settings. Temporal dynamics, including shifts in release due to ENM product application, stock (delayed use), and subsequent end-of-life product treatment were taken into account. We distinguish predicted concentrations originating in ENM use phase and those originating from end-of-life release. Furthermore, we compare Ag- and CeO2-ENM predictions with existing measurements. The correlations and limitations of the model, and the analytic validity of our approach are discussed in the context of massive use of assumptive model data and high uncertainty on the colloidal material captured by the measurements. Predictions for freshwater CeO2-ENMs range from 1 pg/l (2017) to a few hundred ng/l (2050). Relative to CeO2, the SiO2-ENMs estimates are approximately 1,000 times higher, and those for Ag-ENMs 10 times lower. For most environmental compartments, ENM pose relatively low risk; however, organisms residing near ENM 'point sources' (e.g., production plant outfalls and waste treatment plants), which are not considered in the present work, may be at increased risk.


Conflict of interest statement

The authors declare that they have no competing interests.

Figures

Figure 1
Figure 1
Data processing scheme for the calculation of a PEC and risk assessment. Each ENM was examined separately in the given order. After an initial estimation of the annual production volume of the respective ENM (1), according to the shares for different applications in processes and products, the mass fractions for these uses were calculated (2). Based on general trends for production volume, and taking into account factors for ENM release during its production, manufacture of ENM-containing products, use of ENMs and respective products, and end-of-life (EOL), the temporal distribution of ENM volumes for (i) stock, (ii) use, and (iii) release were determined stochastically (3). Information on release volumes enabled the computation of temporal probability distributions of ENM volumes in the atmosphere, water, and soil incl. sediment (4). To consider a large range of potential ENM concentrations for soil and sediment, we took into account two options for the persistence of ENM: on the one hand, an annual degradation of the released amount and, on the other hand, full ENM persistence and therefore an accumulation of annual releases that lead to considerably higher environmental concentrations of the respective ENM (PECaccumulative). Besides the relevant volume within the environmental compartments, flux between compartments has to be considered for the calculation of PEC (gray arrows). Comparison of PEC with probabilistic species sensitivity distribution (PSSD) curves for the three investigated ENMs enabled a risk evaluation for waterbodies.
Figure 2
Figure 2
CeO2-ENM released into natural (waters, soils, air) and technical compartments (landfills, recycling, waste incineration, and sewage treatment). The former release is shown in the Figures (ad), the latter in the Figures (eh). The left side (a,c,e,g) shows ENM released during product uses. The right side (b,d,f,h) represents release during ENM products’ end-of-life phase. The corresponding relative density curves (c taken from a, d taken from b, g taken from e, h taken from f) represent, from left to right, outputs for the years 2017, 2030, and 2050. Shown are the whole ranges (range with some probability) of the stochastic modeling. Scenarios that theoretically run all ENM applications simultaneously at the lowest, or, in another scenario, at the highest ENM production, use and environmental release are not considered here.
Figure 3
Figure 3
SiO2-ENM contributions in t/a (x axis) to use release into wastewater in 2017 (most probable range). From left (mean contribution to total release): 1. colloidal silica (4%), 2. pyrogenic silica (12%), 3. gel silica (22%), and 4. precipitated silica (62%).
Figure 4
Figure 4
Predicted ENM mass (most probable range) between 1990 and 2050 (1980 and 2050) from two exemplary and relevant CeO2-ENM applications. From left: ENM release mass to nature (a and d), ENM mass (b and e) in circulation (release delay during product use), and ENM mass (c and f) deposited or eliminated in technical treatment (landfilling, recycling, waste incineration, and sewage treatment). Above (ac), chemical-mechanical polishing (CMP) application; below (df), use for ACCs (automotive catalytic converters).
Figure 5
Figure 5
Temporal dynamics of CeO2-ENM PEC (most probable range) for agricultural soils (left side, scenario of immediate ENM degradation after one year (a and c); right side (b and d), persistent scenario of no ENM degradation or elimination at all after being released into soils). The density curves refer in each scenario (c out of a, and d out of b) to the results for 2017, 2030, and 2050 (from left).
Figure 6
Figure 6
Water risk evaluations (1) for Ag-, (2) CeO2-, and (3) SiO2-ENMs by comparing PECs (most probable range) of 2050 and 1,000 PSSD curves (in red). The PEC curves (form left to right) represent marine water (green) loaded only from releases associated with end of life (EOL) of ENMs, in blue marine water loaded from ENM product uses, and EOL releases followed by the equivalent freshwater loadings from EOL (light blue) and total (use and EOL) release (dark blue).
Figure 7
Figure 7
Comparisons of modeled PEC ranges (and means) for current values, logarithmically shown on the y axis for surface waters (Figure a) and soils (Figure b) (blue: Ag-ENMs; green: CeO2-ENMs; orange: SiO2-ENMs). Shown for all three materials are (a1a3) the full range from our work, (b1b3) our most probable range, (c) the full range of all PECs from the first probabilistic models, (d) recent results, (e) Denmark-specific PECs, (f) results of a recent multimedia fate model, and (g) silica-specific results. Background colors are randomly chosen for clarity.

Similar articles

Cited by

References

    1. The Royal Society & The Royal Academy of Engineering. Nanoscience and nanotechnologies: opportunities and uncertainties. (Royal Society, 2004).
    1. Pulit-Prociak J, Banach M. Silver nanoparticles – a material of the future…? Open Chemistry. 2016;14:76–91. doi: 10.1515/chem-2016-0005. - DOI
    1. D’Mello SR, et al. The evolving landscape of drug products containing nanomaterials in the United States. Nat Nano. 2017;12:523–529. doi: 10.1038/nnano.2017.67. - DOI - PubMed
    1. Sun TY, et al. Envisioning Nano Release Dynamics in a Changing World: Using Dynamic Probabilistic Modeling to Assess Future Environmental Emissions of Engineered Nanomaterials. Environ. Sci. Technol. 2017;51:2854–2863. doi: 10.1021/acs.est.6b05702. - DOI - PubMed
    1. Ricardo Energy & Environment. Support for 3rd regulatory review on nanomaterials: Interim/Background Report. (2016).

Publication types

Substances