. 2018 Jan 25;9(1):373.
doi: 10.1038/s41467-017-02342-1.

A global ocean atlas of eukaryotic genes

Collaborators, Affiliations

A global ocean atlas of eukaryotic genes

Quentin Carradec et al. Nat Commun. .

Abstract

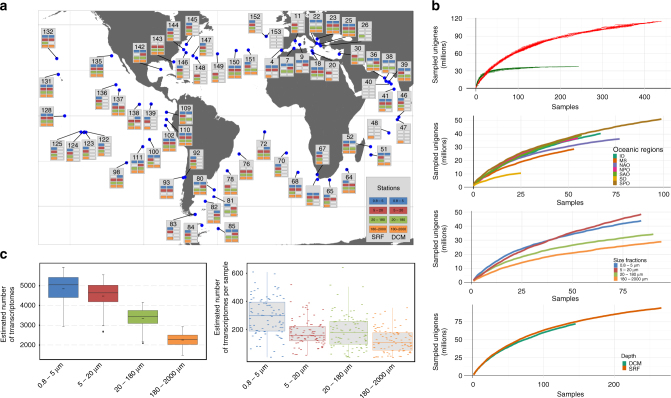
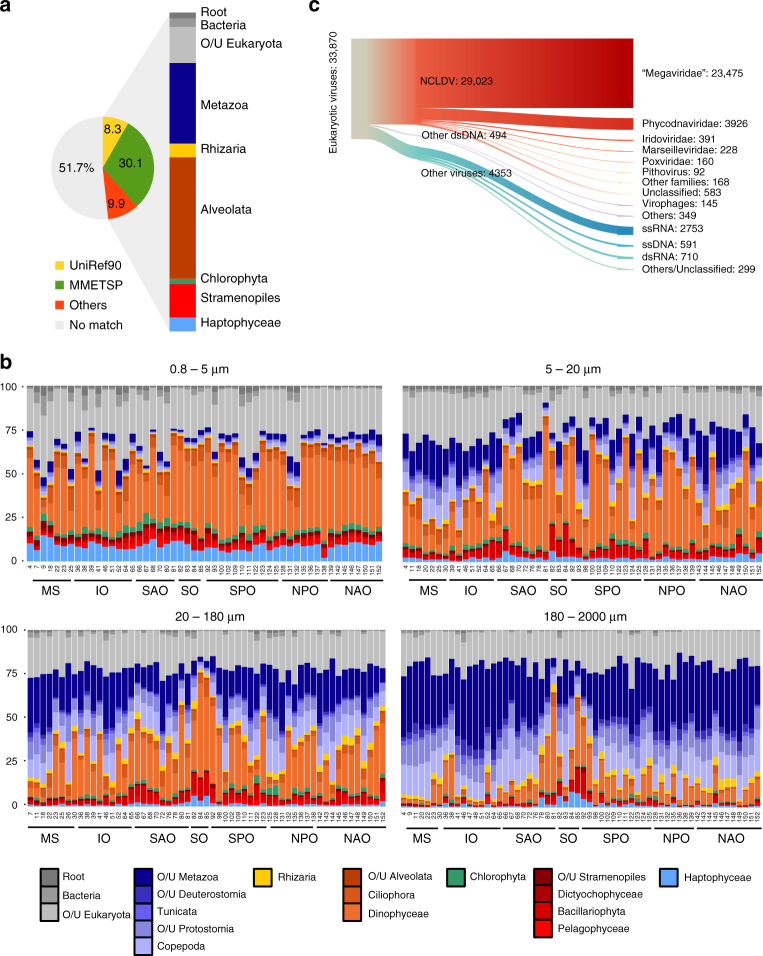
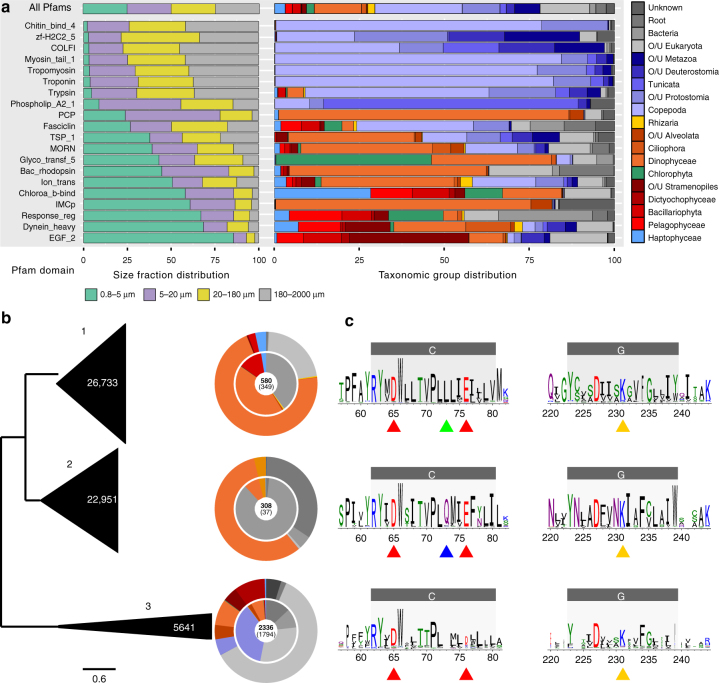
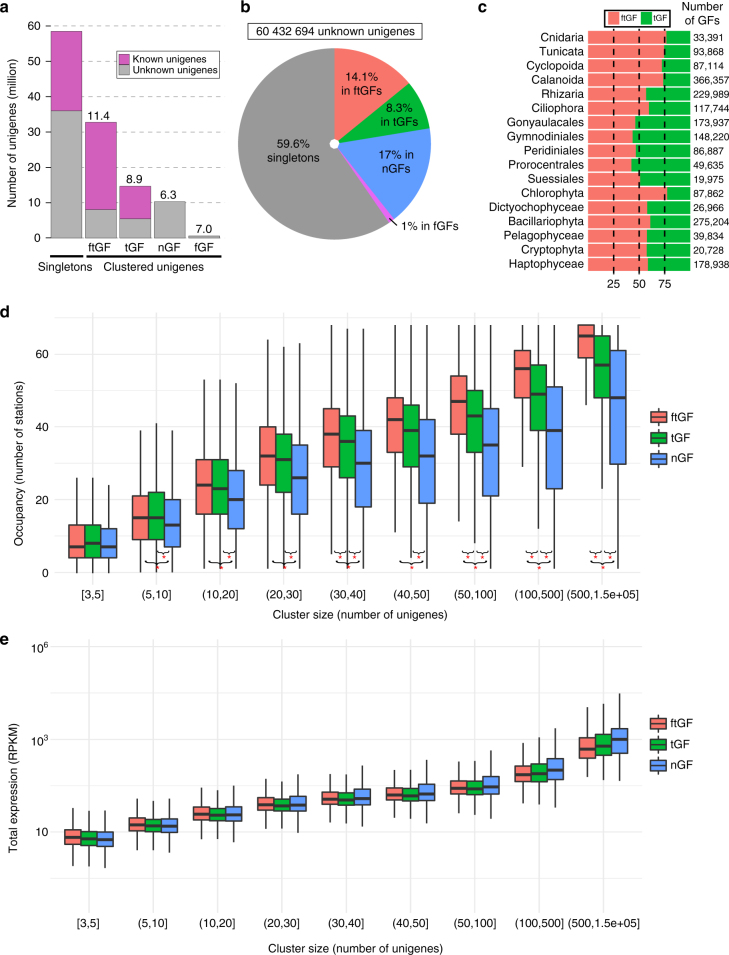
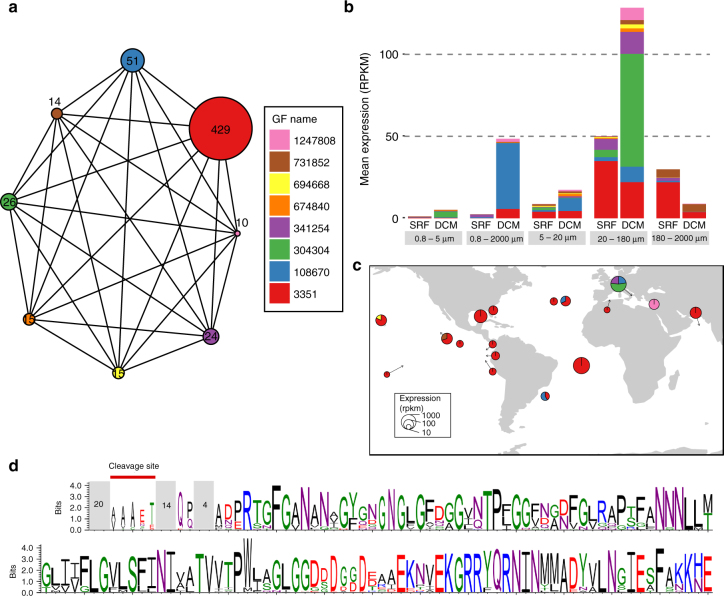
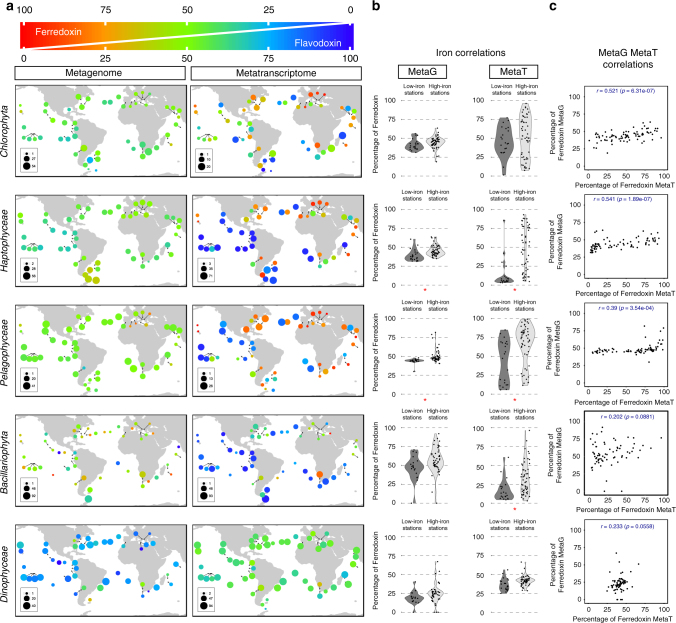
While our knowledge about the roles of microbes and viruses in the ocean has increased tremendously due to recent advances in genomics and metagenomics, research on marine microbial eukaryotes and zooplankton has benefited much less from these new technologies because of their larger genomes, their enormous diversity, and largely unexplored physiologies. Here, we use a metatranscriptomics approach to capture expressed genes in open ocean Tara Oceans stations across four organismal size fractions. The individual sequence reads cluster into 116 million unigenes representing the largest reference collection of eukaryotic transcripts from any single biome. The catalog is used to unveil functions expressed by eukaryotic marine plankton, and to assess their functional biogeography. Almost half of the sequences have no similarity with known proteins, and a great number belong to new gene families with a restricted distribution in the ocean. Overall, the resource provides the foundations for exploring the roles of marine eukaryotes in ocean ecology and biogeochemistry.


Conflict of interest statement

The authors declare no competing financial interests.

Figures

Fig. 1
Fig. 1
The Tara Oceans eukaryote gene catalog. a Sampling map. Geographic distribution of 68 sampling stations at which seawater from the surface (SRF) and/or the deep chlorophyll maximum (DCM) was collected and size fractionated into four main groups: 0.8–5 µm (blue), 5–20 µm (red), 20–180 µm (green), and 180–2000 µm (orange). Availability of sequence data sets is indicated by the colored boxes at each sampling station. Two stations (TARA_40 and TARA_153) containing only atypical size fractions are shown on this map with empty boxes. b Rarefaction curves of detected genes. Top panel: rarefaction curves of 441 eukaryotic samples (red curve) compared to 139 prokaryotic samples (green curve) derived from Sunagawa et al. Other panels: rarefaction curve of eukaryotic samples by oceanic region (IO, Indian Ocean; MS, Mediterranean Sea; NAO, North Atlantic Ocean; NPO, North Pacific Ocean; SAO, South Atlantic Ocean; SO, Southern Ocean; SPO, South Pacific Ocean), size fraction, and depth (SRF or DCM). For each curve, sampling order has been 10-fold permuted. c Estimated number of transcriptomes in eukaryotic samples. Left panel: distribution of the total number of transcriptomes estimated for each size fraction computed from the number of unigenes similar to a catalog of 24 single-copy ribosomal proteins. Right panel: distribution of the number of transcriptomes in each sample (small dashes) grouped by size fraction
Fig. 2
Fig. 2
Taxonomic composition of the gene catalog. a Origin of the best similarity sequence match as a fraction of the total in the circular diagram (MMETSP: release of August 2014, with manual curation; UniRef90: release of September 2014; “Others”: are other reference transcriptomes that were added as reference to offset the lack of knowledge about organisms in large size fractions, in particular copepods and rhizaria; Methods section). Unigenes without significant matches (i.e., those with an e-value >10–5 for their best similarity match) are tagged as “No match”. The proportion of unigenes affiliated to each major taxonomic group is indicated in the right column. O/U, other or unassigned. b Proportion of each major taxonomic group across Tara Oceans stations based on the mean number of unigenes classified as one of 24 different single-copy ribosomal proteins detected in each sample (IO, Indian Ocean; MS, Mediterranean Sea; NAO, North Atlantic Ocean; NPO, North Pacific Ocean; SAO, South Atlantic Ocean; SO, Southern Ocean; SPO, South Pacific Ocean). c Eukaryotic viral unigenes. NCLDV unigenes are classified at the family level
Fig. 3
Fig. 3
Characterization of highly expressed gene families. a Major Pfam domains present in different size fractions and in different taxonomic groups. Among the highly expressed Pfam domains (Supplementary Fig. 4), those with specific patterns are shown. The relative expression of Pfam domains in the four filter sizes (left panel) and the contribution of each taxonomic group to the total expression of the Pfam domain (right panel) are shown as an average of all Tara Oceans SRF and DCM samples. O/U, other or unassigned. b Unrooted phylogenetic tree of type-I rhodopsin subfamilies (PF01036) obtained using sampling of 300 sequences of the three largest MCL clusters (see details in Supplementary Fig. 5b). The vertical size of the triangles represents the number of unigenes in each cluster (explicitly indicated in white) and their width represents the maximum branch length of 95% of sequences in the cluster. Taxonomic assignments of reference sequences (inner ring) and unigenes (outer ring) are indicated for each cluster with the color code of a. The number of reference sequences in each cluster is indicated in the center in bold, with the number of eukaryotic sequences in parentheses. c Logo consensus sequences, based on the global alignment of each cluster. Two regions of interest (helices C and G and their neighborhoods) containing functional and conserved residues are represented. Specific functional residues are indicated with arrows. Red: proton donor (D65) and acceptor (E76); green: residue specific to green light-sensitive proteorhodopsins; blue: amino acid specific to blue light-sensitive proteorhodopsins; yellow: lysine residue linked to retinal. Predicted transmembrane helices are represented as gray boxes
Fig. 4
Fig. 4
Eukaryote gene catalog clustering and characterization of novel genes. a Global repartition of unigenes based on the gene catalog clustering. Unigenes were considered as singletons if they are in clusters of less than three units. Gene families are novel (nGF), taxonomically assigned (tGF), functionally assigned (fGF), or both (ftGF) (Methods). Numbers above each bar indicate the numbers of unigenes per cluster. b Distribution of unknown unigenes in the different categories described in a. c Ratio of tGFs vs. ftGFs in the main taxonomic groups. The total number of GFs assigned to each taxonomic group is indicated on the right. d Distribution of GF occupancy for the three main GF categories. GFs are classified according to their size (x-axis) and the y-axis indicates the number of stations where the GF family is expressed (at least one unigene detected with a coverage of more than 80% of the unigene length). Kolmogorov-Smirnov tests with p < 10–5 between occupancy distributions are indicated with red stars. e Distribution of mean expression levels of the three different categories of GFs among all samples. GFs are classified according to their size (x-axis). The expression of a GF in a sample was determined by the sum of the expression of its unigenes in RPKM
Fig. 5
Fig. 5
New gene families expressed in 20–180 μm size fraction. a Graph representation of the protein group number 14079. Each GF of the protein group is represented by a node with a diameter proportional to the number of unigenes in the GF. Protein matches between GFs are represented by an edge. b Mean expression of GFs in different size-fractions and depths. Each color corresponds to a GF of protein group 14079. c World map representation of protein group 14079 expression in the 20–180 µm size fraction. SRF and DCM samples have been pooled. Circle diameters represent the relative expression of the protein group in RPKM. The contribution to expression of each GF is represented by the different colors. d Sequence logo of the multiple alignments of the protein group 14079. 45 ORFs (153 amino acids in average) of protein group 14079 were aligned and positions with more than 50% of gaps were removed. Mean numbers of amino acids on unaligned regions of the protein are indicated in gray boxes. A signal peptide cleavage site, indicated on the left part of the sequence logo was predicted on 21 sequences
Fig. 6
Fig. 6
Ratios of differential gene abundance and relative expression of ferredoxin vs. flavodoxin in the five major photosynthetic groups. a Representation of the relative abundance (left) and expression (right) of the two genes identified in surface samples for Chlorophyta, Pelagophyceae, Haptophyceae (from 0.8 to 5 µm filters), Bacillariophyta and Dinophyceae (from the 5 to 20 µm filters). The circle colors, from red to blue, represent the relative expression of one gene compared to the other, with the color code given in the top diagram. The sum of the expression levels of the two genes affiliated to each taxonomic group is represented by the circle diameter as a percentage of the total expression of these genes. b Distribution of the relative abundance (left) or expression (right) of ferredoxin in low iron stations (<0.02 µmol m−3, 15 stations, dark gray) or iron rich stations (>0.2 µmol m−3, 31 stations, light gray) according to a model of iron concentration in the oceans (Supplementary Data 5). Significant differences of expression between low and rich iron stations are indicated with red stars (non-parametric wilcoxon rank-sum test, p < 10–3) c Correlations between the relative metagenome (MetaG) abundance and metatranscriptome (MetaT) expression of ferredoxin in SRF and DCM samples, expressed as a percentage of the total value of ferredoxin + flavodoxin. Pearson correlation coefficients (r) and their statistical significance (p) are indicated in each graph. Ferredoxins and flavodoxins were identified using the Pfams PF00111 and PF00258, respectively

References

    1. Dortch Q, Packard T. Differences in biomass structure between oligotrophic and eutrophic marine ecosystems. Deep Sea Res. 1989;36:223–240. doi: 10.1016/0198-0149(89)90135-0. - DOI
    1. Gasol JM, Giorgio PAD, Duarte CM. Biomass distribution in marine planktonic communities. Limnol. Oceanogr. 1997;42:1353–1363. doi: 10.4319/lo.1997.42.6.1353. - DOI
    1. Barton AD, et al. The biogeography of marine plankton traits. Ecol. Lett. 2013;16:522–534. doi: 10.1111/ele.12063. - DOI - PubMed
    1. Caron DA, Countway PD, Jones AC, Kim DY, Schnetzer A. Marine protistan diversity. Ann. Rev. Mar. Sci. 2012;4:467–493. doi: 10.1146/annurev-marine-120709-142802. - DOI - PubMed
    1. Wisecaver JH, Hackett JD. Dinoflagellate genome evolution. Annu. Rev. Microbiol. 2011;65:369–387. doi: 10.1146/annurev-micro-090110-102841. - DOI - PubMed

Publication types

MeSH terms