. 2018 Jan 25;8(1):1570.
doi: 10.1038/s41598-018-19817-w.

Development of a novel zebrafish xenograft model in ache mutants using liver cancer cell lines

Affiliations

Development of a novel zebrafish xenograft model in ache mutants using liver cancer cell lines

M Ender Avci et al. Sci Rep. .

Abstract

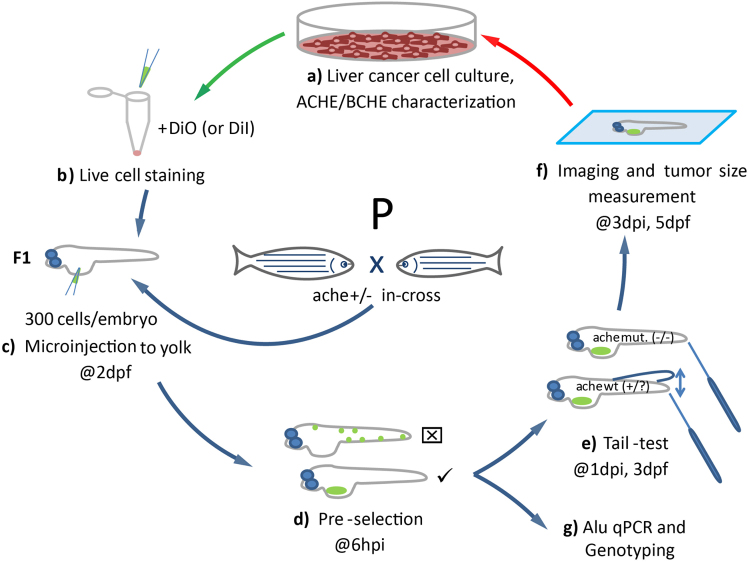
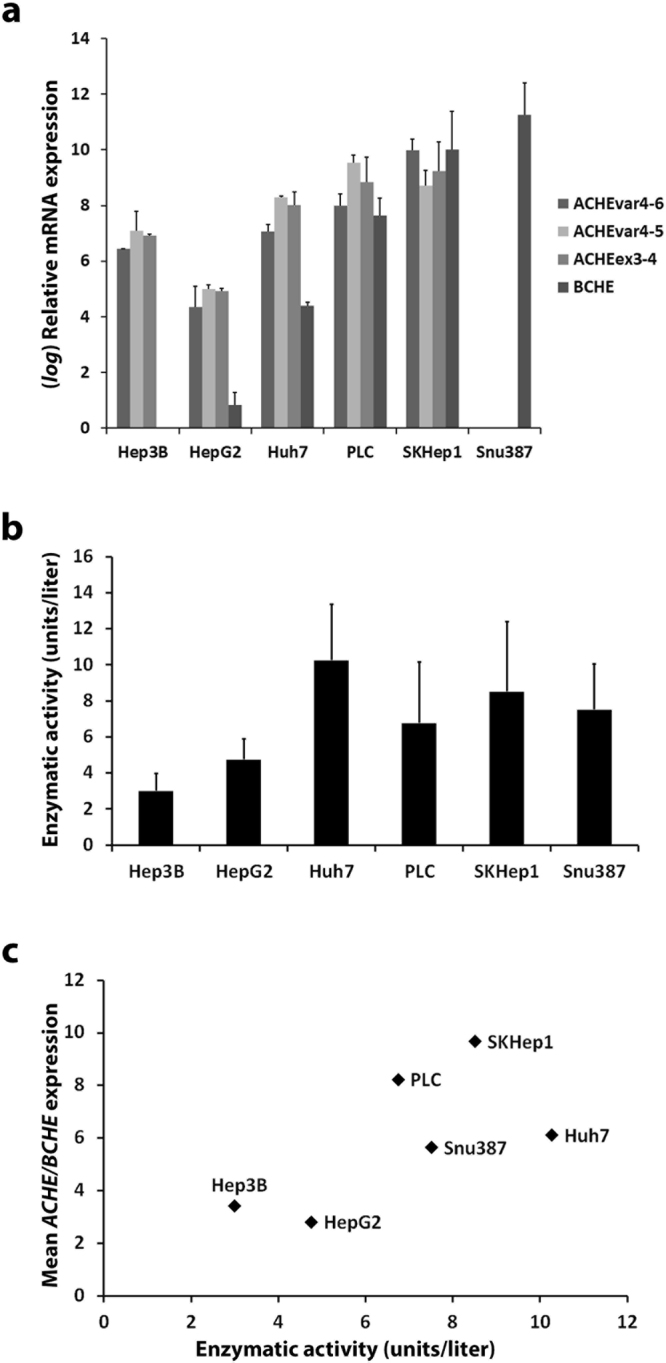
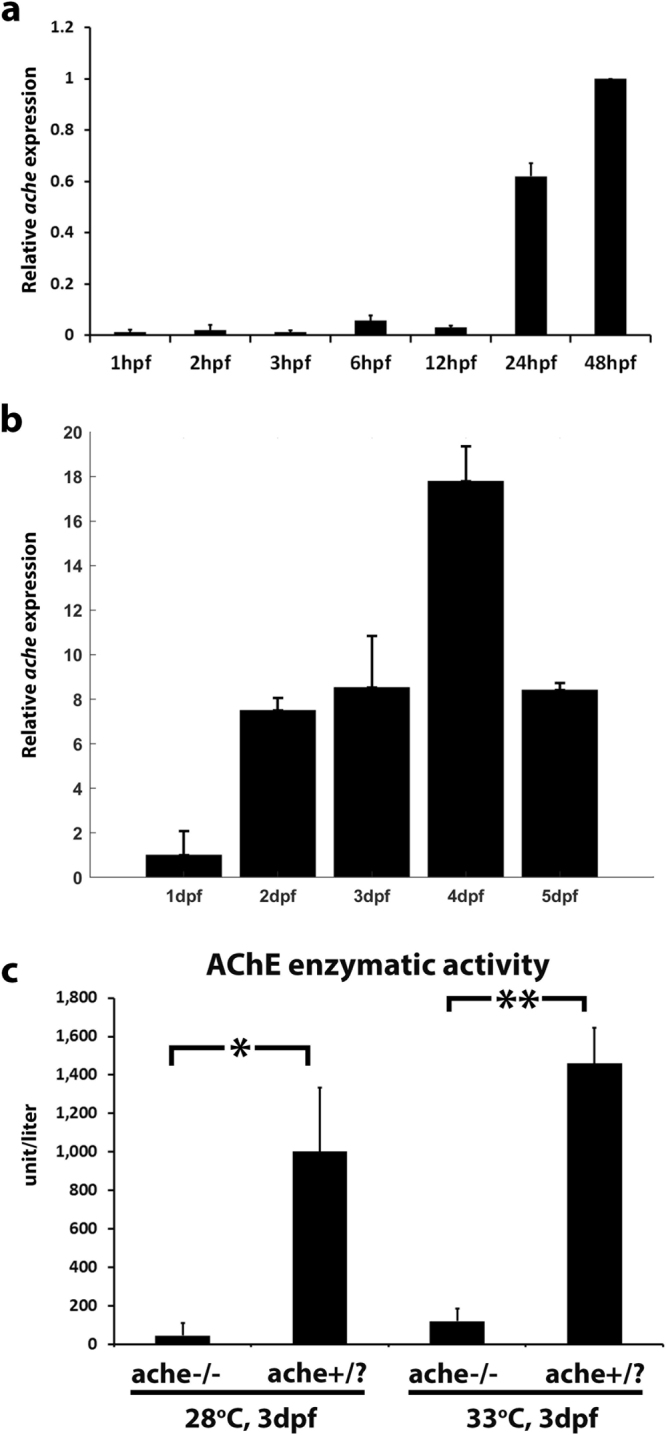
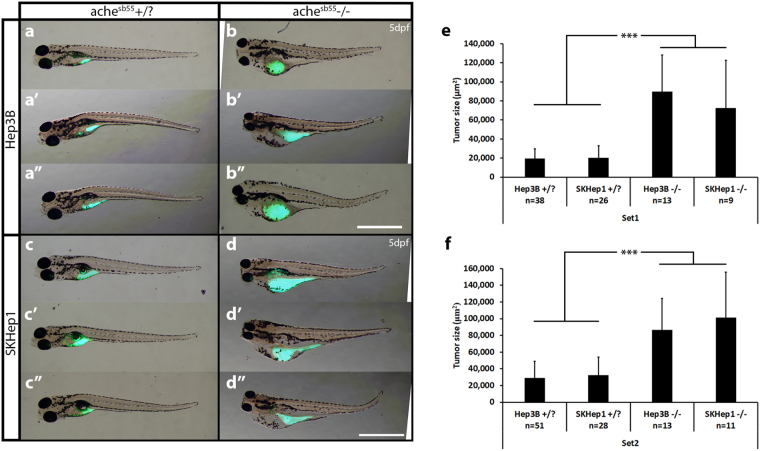
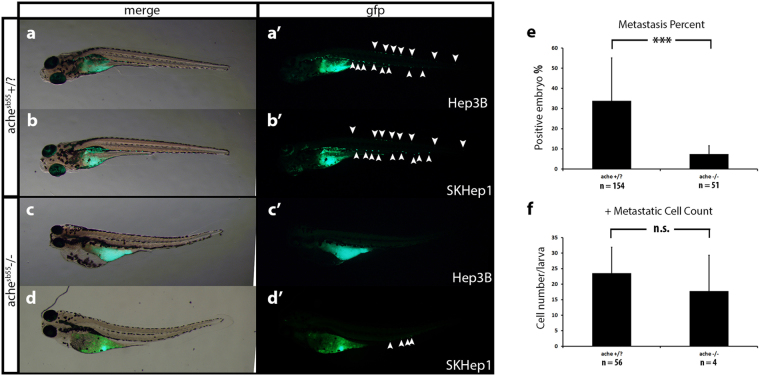
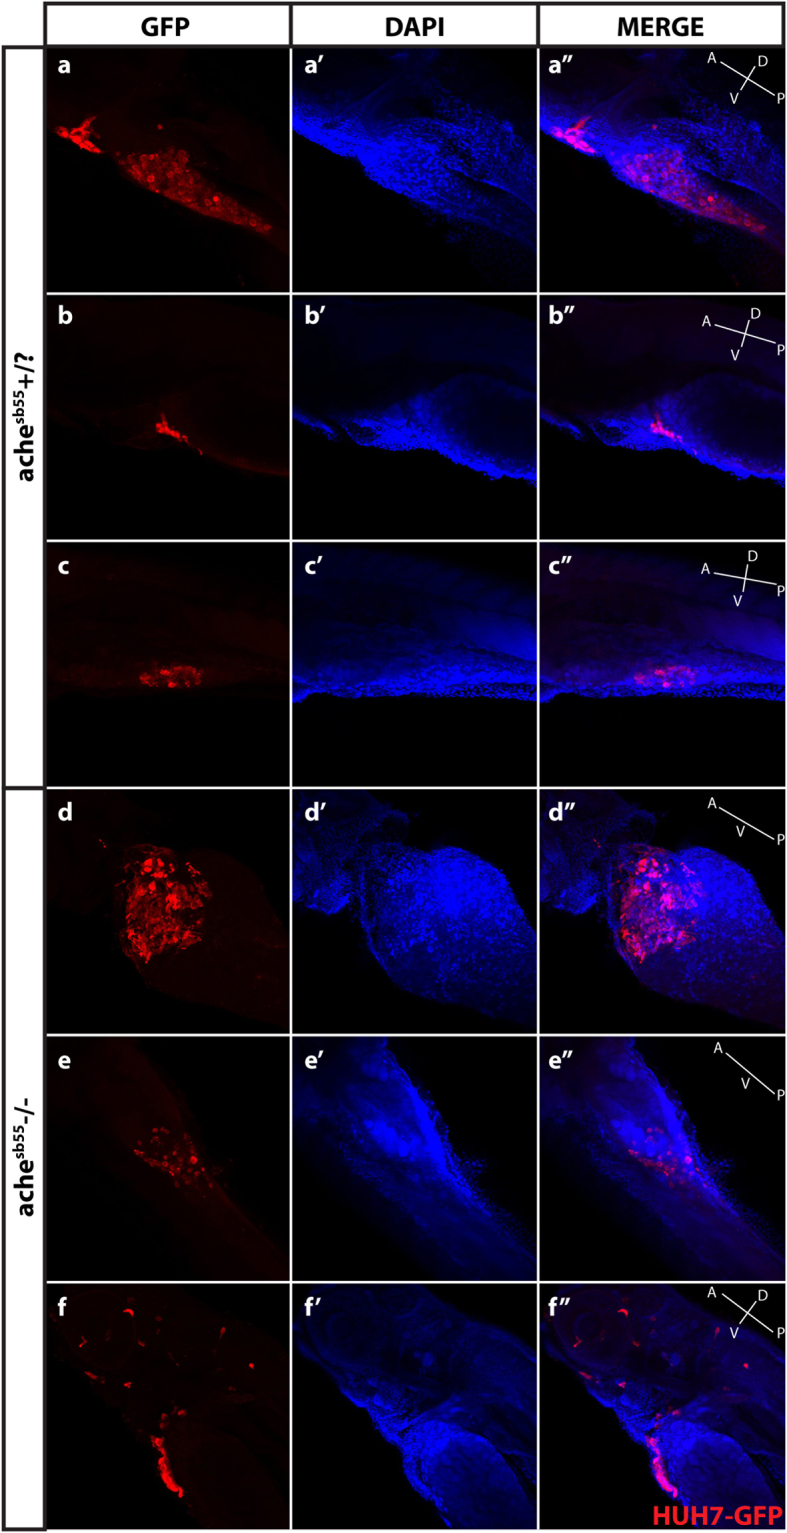
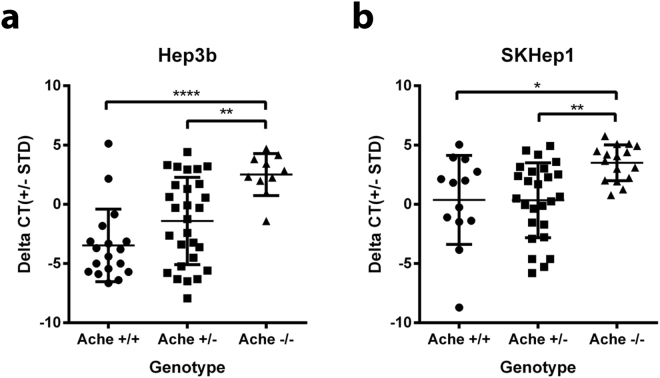
Acetylcholinesterase (AChE), an enzyme responsible for degradation of acetylcholine, has been identified as a prognostic marker in liver cancer. Although in vivo Ache tumorigenicity assays in mouse are present, no established liver cancer xenograft model in zebrafish using an ache mutant background exists. Herein, we developed an embryonic zebrafish xenograft model using epithelial (Hep3B) and mesenchymal (SKHep1) liver cancer cell lines in wild-type and ache sb55 sibling mutant larvae after characterization of cholinesterase expression and activity in cell lines and zebrafish larvae. The comparison of fluorescent signal reflecting tumor size at 3-days post-injection (dpi) revealed an enhanced tumorigenic potential and a reduced migration capacity in cancer cells injected into homozygous ache sb55 mutants when compared with the wild-type. Increased tumor load was confirmed using an ALU based tumor DNA quantification method modified for use in genotyped xenotransplanted zebrafish embryos. Confocal microscopy using the Huh7 cells stably expressing GFP helped identify the distribution of tumor cells in larvae. Our results imply that acetylcholine accumulation in the microenvironment directly or indirectly supports tumor growth in liver cancer. Use of this model system for drug screening studies holds potential in discovering new cholinergic targets for treatment of liver cancers.


Conflict of interest statement

The authors declare that they have no competing interests.

Figures

Figure 1
Figure 1
Schematic representation of the development of the liver cancer xenograft model in zebrafish ache mutants. (a) Liver cancer cells are grown in culture and characterized for ACHE/BCHE expression and activity. (b) Selected cell lines are harvested and stained with live dye DiO (or DiI for ALU quantification). (c) Embryos from ache heterozygous in-cross are injected with 300 cells into their yolk sac at 2 dpf. (d) At 6 hpi, embryos with positive signal are selected and embryos with signal from outside the injection site are not used. (e) After blind injection, mutant larvae are separated from +/? by a touch-evoked tail response test (tail-test). (f) All larvae are fixed and mounted before tumor size is measured and compared between mutant and wild-type larvae. (g) Alternatively, larvae fixed for ALU based xenograft quantification assay.
Figure 2
Figure 2
ACHE, BCHE expression and enzymatic activity profiling in selected liver cancer cell lines. (a) Human ACHE transcript variants ACHE4-6, ACHE4-5 expression and another set of primers targeting ACHE exons no. 3 and 4 (ACHEex3-4) present in both variants were used for measuring relative ACHE expression by qPCR in the cell lines. Additionally, BCHE expression was measured by qPCR. Relative quantification was performed with respect to the cell lines with the lowest expression and log fold change represented. TPT1 gene was taken as reference and ∆∆Ct method formula was used. (b) AChE enzymatic activity in HCC cell lines was measured using an Ellman method based commercial kit. (c) Mean ACHE/BCHE expression values and enzymatic activities were plotted for observation of correlation. Enzymatic activity numerical values were normalized by division to the highest value. All error bars represent the standard deviation.
Figure 3
Figure 3
Temporal gene expression of zebrafish ache during embryonic and larval development. (a) Relative ache expression was quantified by qPCR at selected embryonic stages in AB line (N = 1 experiment, n = 20 embryos per group, standard deviation comes from technical replicates). qPCR reactions were run in duplicates and ∆∆Ct was calculated relative to 48 hpf values and normalized with actb2 expression (b) Relative ache expression was quantified by qPCR at 1–5 dpf (N = 2 experiments, n = 20 embryo/larvae per group). qPCR reactions were run in duplicates and ∆∆Ct was calculated relative to 24 hpf values and normalized with actb2 expression. (c) Normalized O.D. 412 values for groups of embryos. AChE enzymatic activity was almost absent in tail-test selected ache−/− mutant embryos when compared with wild-type ache+/? siblings at 28 °C (P = 0.034) or at 33°C (P = 0.003) (performed in triplicates, n = 8 embryos per group). Error bars show the standard deviation.
Figure 4
Figure 4
ache mutant embryos develop larger tumors with both Hep3B and SKHep1 human liver cancer cell xenotransplantation. At 2 dpf, embryos collected from ache+/− in-cross were injected with either Hep3B (a,b) or SKHep1 (c,d) cells. At 3 dpf, tail test was applied for phenotypically separating wild-type (a,c) and mutant embryos (b,d). At 3 dpi, larvae were fixed and imaged for analyzing tumor development (representative of Hep3B and SKHep1 injected groups, three different larvae are shown in a, a’, a”, b, b’, b” and c, c’, c”, d, d’, d”, respectively). Merged images from brightfield and GFP channels were shown. DiO labeled tumor masses can be clearly seen in green. Tumor sizes were measured in ImageJ using the fluorescent signal alone. In total 89 Hep3B injected ache+/?, 26 Hep3B injected ache−/−, 54 SKHep1 injected +/? and 20 SKHep1 injected −/− larvae were analyzed across two independent experiments. Results from each experimental set are separately graphed (e,f). Error bars represent the standard deviation. Bar = 1 mm.
Figure 5
Figure 5
Comparison of metastasis in ache wild-type and mutant larvae. Representative metastatic larva images from Hep3B (a) and SKHep1 (b) injections into ache+/? (n = 154) larvae are shown. Green fluorescent dye DiO labeled migrated cells can be seen both in Hep3B (a’) and SKHep1 (b’) cell injections. Injection of Hep3B (c) and SKHep1 (d) into yolk sac of ache−/− (n = 51) larvae did not show a metastatic phenotype (c’,d’) (when there were more than 5 cells in tail region that embryo was counted as positive for metastasis, see (d’) which was counted as negative for metastasis). (e) Positive metastasis percent in ache wild-type and mutant groups were compared where there were significantly more metastatic larvae in ache wild-type group (P = 0.0002, chi-square test). (f) To see the effect of metastasis on local tumor size, tumor sizes of metastasis positive and negative groups were compared. Metastasis negative larvae (n = 129) showed a trend for larger tumors although non-significant (P = 0.1112, T-test) when compared to metastasis positive larvae (n = 60). n.s = not significant.
Figure 6
Figure 6
Optical sectioning and examination of Huh7-GFP xenografted larvae. Larvae (ache+/? and ache−/−) injected with Huh7-GFP cells were stained with GFP primary antibody and Cy3 tagged secondary antibody, and counterstained with DAPI and examined histologically by optical sectioning using a Zeiss LSM 880 confocal microscope. (af) At 20× magnification, z-stacks at 10 micron intervals were obtained and consecutive images were Z-projected to obtain these 2D images by maximum intensity projection in ImageJ. Tumor masses can be clearly seen in both images in red. (a’–f’) Same larvae were counterstained with DAPI for marking nuclei. (a”–f”) Merged images were presented. In the fish body schematic, the letters are abbreviations for A: anterior, P: posterior, D: dorsal, V: ventral.
Figure 7
Figure 7
The comparison of the AluYb8 Ct values between genotypes using a qPCR assay. DNA was extracted from 3 dpi larvae injected with liver cancer cell lines (Hep3B and SKHep1) were amplified by qPCRs with using ache N, ache S, and AluYb8 primers (Supplementary Table 1). The Ct value difference (∆Ct) between ache N and ache S primers were used for the genotyping (Supplementary Figure 8). (a) For Hep3B (n = 18, 28 and 10 for ache+/+, ache+/− and ache−/−) normalized Ct values were significantly higher in ache−/− larvae in comparison to both ache+/− and ache+/+ larvae (P = 0.005 and 0.0001, respectively). (b) For SKHep1 (n = 13, 26 and 16 for ache+/+, ache+/− and ache−/−) normalized Ct values were significantly higher in ache−/− larvae in comparison to both ache+/− and ache+/+ (P = 0.004 and 0.017, respectively).

References

    1. Tazi EM, Essadi I, M’rabti H, Touyar A, Errihani H. Systemic treatment and targeted therapy in patients with advanced hepatocellular carcinoma. N. Am. J. Med. Sci. 2011;3:167–175. doi: 10.4297/najms.2011.3167. - DOI - PMC - PubMed
    1. Lu J-W, et al. Zebrafish as a disease model for studying human hepatocellular carcinoma. World J. Gastroenterol. 2015;21:12042–58. doi: 10.3748/wjg.v21.i42.12042. - DOI - PMC - PubMed
    1. El-Serag HB, Marrero JA, Rudolph L, Reddy KR. Diagnosis and Treatment of Hepatocellular Carcinoma. Gastroenterology. 2008;134:1752–1763. doi: 10.1053/j.gastro.2008.02.090. - DOI - PubMed
    1. Schlaeger C, et al. Etiology dependent molecular mechanisms in human hepatocarcinogenesis. Hepatology. 2008;47:511–520. doi: 10.1002/hep.22033. - DOI - PubMed
    1. Zhao Y, et al. Acetylcholinesterase, a key prognostic predictor for hepatocellular carcinoma, suppresses cell growth and induces chemosensitization. Hepatology. 2011;53:493–503. doi: 10.1002/hep.24079. - DOI - PubMed

Publication types

Substances

LinkOut - more resources