. 2018 Jan 25;9(1):378.
doi: 10.1038/s41467-017-02785-6.

A quiescent cell population replenishes mesenchymal stem cells to drive accelerated growth in mouse incisors

Affiliations

A quiescent cell population replenishes mesenchymal stem cells to drive accelerated growth in mouse incisors

Zhengwen An et al. Nat Commun. .

Abstract

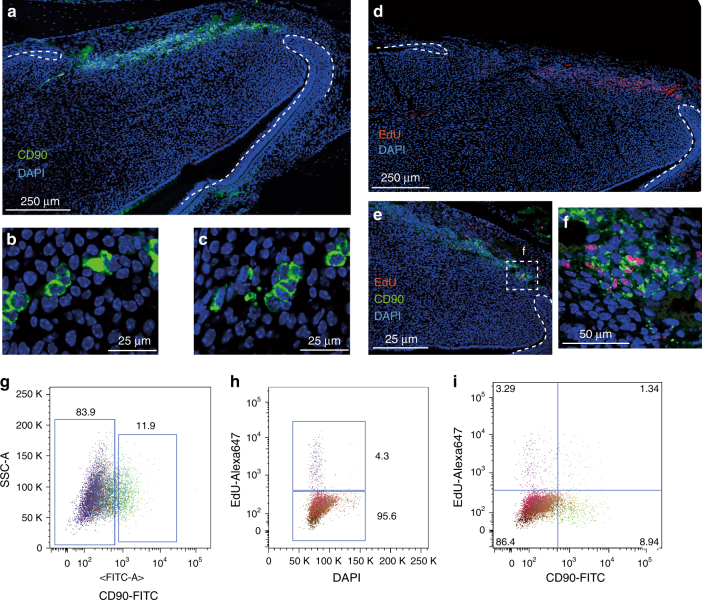
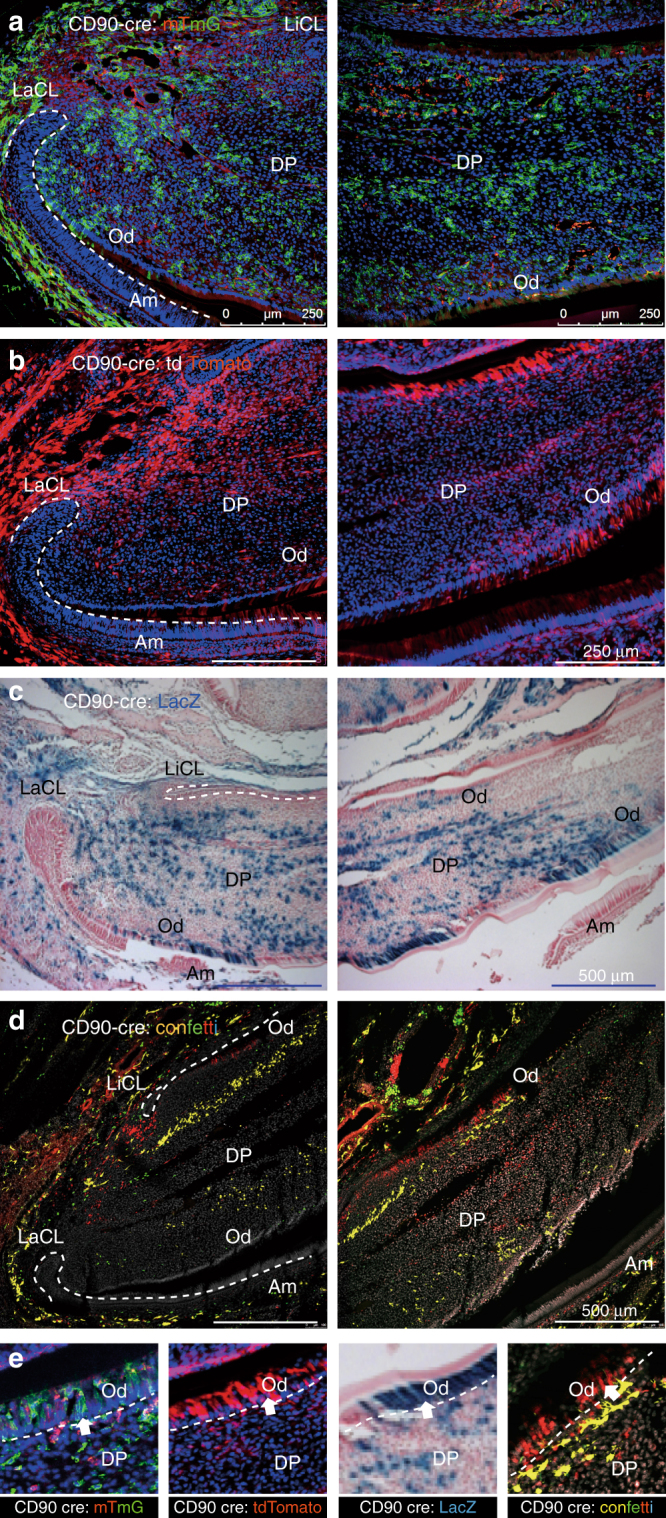
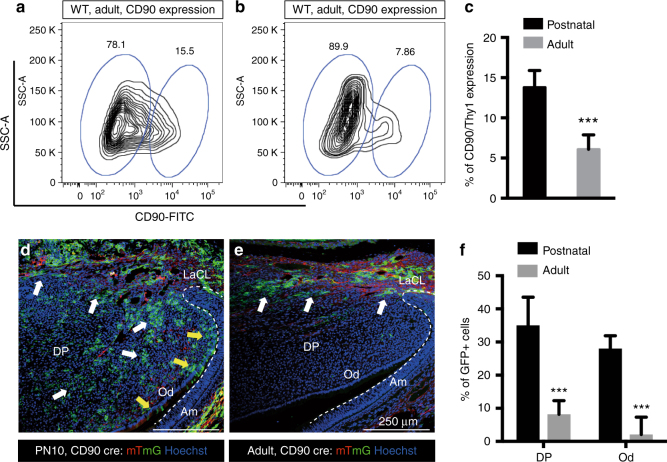
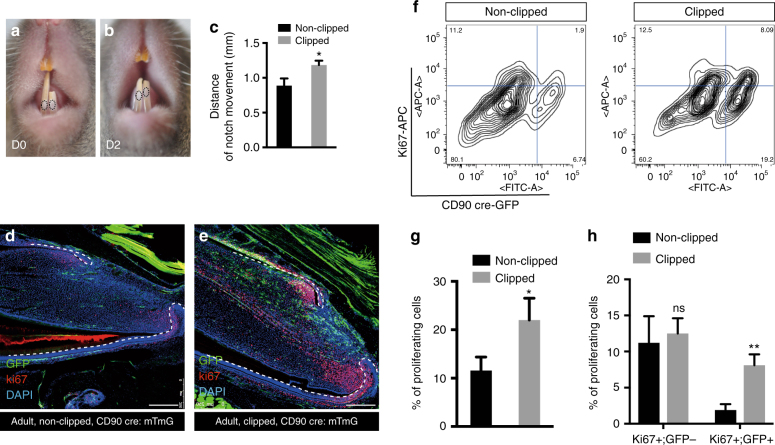
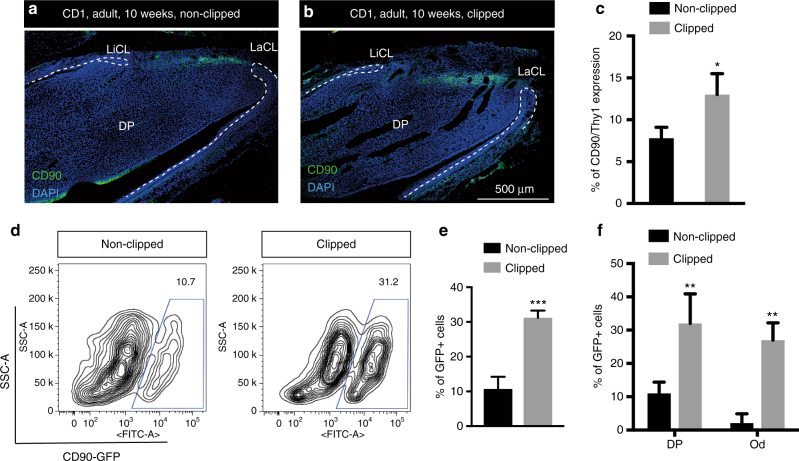
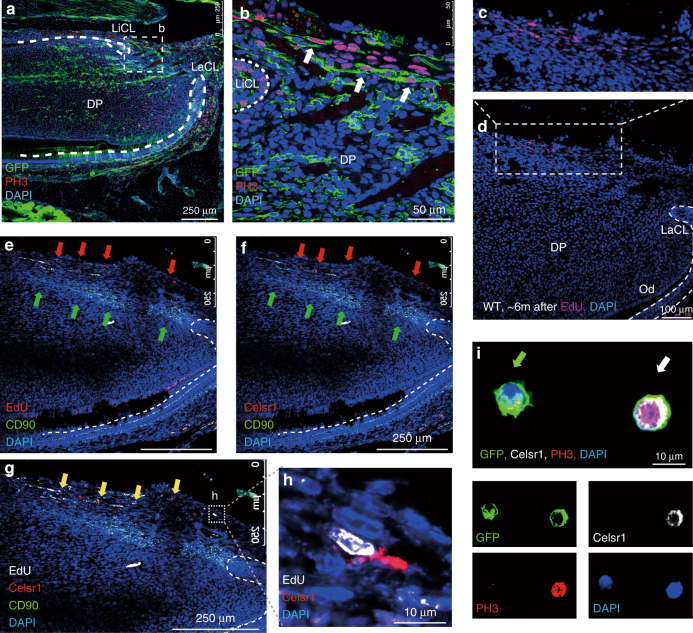
The extent to which heterogeneity within mesenchymal stem cell (MSC) populations is related to function is not understood. Using the archetypal MSC in vitro surface marker, CD90/Thy1, here we show that 30% of the MSCs in the continuously growing mouse incisor express CD90/Thy1 and these cells give rise to 30% of the differentiated cell progeny during postnatal development. In adulthood, when growth rate homeostasis is established, the CD90/Thy1+ MSCs decrease dramatically in number. When adult incisors are cut, the growth rate increases to rapidly re-establish tooth length and homeostasis. This accelerated growth rate correlates with the re-appearance of CD90/Thy+ MSCs and re-establishment of their contribution to cell differentiation. A population of Celsr1+ quiescent cells becomes mitotic following clipping and replenishes the CD90/Thy1 population. A sub-population of MSCs thus exists in the mouse incisor, distinguished by expression of CD90/Thy1 that plays a specific role only during periods of increased growth rate.


Conflict of interest statement

The authors declare no competing financial interests.

Figures

Fig. 1
Fig. 1
CD90/Thy1 expression in small clusters of cells in the dental mesenchyme. a Immuno-fluorescent staining shows CD90/Thy1 expression in the dental mesenchyme between the labial and lingual aspects of the cervical loop at the apical end of the mouse incisor on the sagittal section images. b, c High magnification images show CD90/Thy1 is expressed in small clusters of cells. d Long-chase EdU retaining cells occupy a similar location between the two aspects of epithelial cervical loop. Mice were given EdU for four weeks and chased for another four weeks prior to tissue collection. e, f Co-staining of CD90/Thy1 and EdU demonstrates partially co-localization. g FACS analysis of CD90/Thy1 expression in the postnatal (PN5) mouse dental pulp tissue showing about 12% of pulp cells express CD90/Thy1. h, i Long-chase EdU retention assay shows 4.3% of slow cycling cells are present in the incisor pulp (e), and about 30% of these slow cycling cells express CD90/Thy1
Fig. 2
Fig. 2
Lineage tracing of CD90/Thy1 in the postnatal mouse incisor. CD90/Thy1 cre mouse line crossed with different reporter lines, a Rosa26R;-mTmG, b Rosa26R-tdTomato, c Rosa26R;-LacZ, and d Rosa26R;-Confetti, shows CD90/Thy1 expressing cells and their progeny contribute to pulp cells and odontoblasts. d Confetti predominately labels single cell clones; thus each single color represents the progeny from one stem cell. e Enlarged region from each reporter line showing CD90/Thy1-derived odontoblasts. PN5-10 postnatal incisor samples were used in ac, PN21 mouse incisors were used in d. N > = 5 pups each group
Fig. 3
Fig. 3
CD90/Thy1 reduced expression and contribution to the pulp cells and odontoblasts in adult incisors. a, b Flow cytometry data showing CD90/Thy1 expression is greatly reduced in the adult incisor compared to postnatal mice. c Quantification of CD90/Thy1 expressing cells in the mouse incisor. Data shows a 2 fold decrease in expression in adult incisors compared to postnatal. d, e Lineage tracing of CD90/Thy1 with mTmG reporter identifies the dramatic reduction of contribution to the pulp cells and odontoblasts in the adult compared to the advanced postnatal stages. White arrows show pulp cell contribution and yellow arrows show the odontoblast contribution. f Quantification of CD90/Thy1 contribution to the pulp cells and odontoblasts showing significantly decreased expression in adults compared with young postnatal mice. N > = 3 mice per group. ***P < 0.001 by Student’s t-test. Data presented as mean ± S.E.M
Fig. 4
Fig. 4
Rapid expansion of CD90/Thy1 expressing MSCs contributes to re-establishment and homeostasis after adult incisor clipping. ac 2 days after clipping (D2), notch movement on the unclipped incisor and clipped incisor was measured using a digital caliper, indicating faster growth of clipped incisor compared to the unclipped control (n = 5, 8–10 weeks old adult mice). d, e Immuno-fluorescent staining of the cell proliferation marker, Ki67 on CD90/Thy1 cre; mTmG mice with clipped incisors showing higher proliferation and increased contribution to the pulp cells and odontoblasts from CD90/Thy1-derived cells than in non-clipped incisors. fh FACS analysis and quantification shows significantly increased numbers of proliferating cells in clipped incisors with almost all the increase in proliferating cells being accounted for by CD90/Thy1+ cells (Ki67 + ;GFP+), while the Ki67+;GFP− cell population remains constant. Bar is 250 µm. *P < 0.05 and **P < 0.01 by Student’s t-test. Data presented as mean ± S.E.M
Fig. 5
Fig. 5
Increased CD90/Thy1 expression is localized to the incisor MSC region after clipping. a, b Immunofluorescent staining of CD90/Thy1 identifies expression localized to the region in dental pulp between the epithelial cervical loop and no expression is detected in the TAC region 2 days after clipping. c Quantification of CD90/Thy1 expression in clipped incisors compared to unclipped incisors (N > = 3 per group, 10 week adult mice). d, e FACS analysis of CD90/Thy1 cre; mTmG mice shows a three fold increase in GFP + cells from clipped incisors compared to unclipped. f Quantification of GFP + cells in the pulp cells and odontoblasts on sagittal sections. N > = 5 mice per group. *P < 0.05, **P < 0.01 and ***P < 0.001 by Student’s t-test. Data presented as mean ± S.E.M
Fig. 6
Fig. 6
Quiescent cells act as a reservoir and mobilize to form stem cells. a, b PH3 immuno-staining of sections of CD90/Thy1 cre; mTmG mice shows proliferating cells become detectable in the mesenchyme between the two aspects of the cervical loop after incisor clipping. c, d Detection of EdU incorporating cells that had been labeled during embryonic development from E2.5 to E17.5 and chased for over 6 months, showing a small population of EdU+ cells distributed in a line at then most proximal end of incisor mesenchyme. e Co-staining with CD90/Thy1 and EdU labeled quiescent cells shows CD90/Thy1 cells are located in the mesenchyme adjacent to the EdU labeled cells, red arrows are EdU + and green arrows are CD90/Thy1+ cells. f Co-staining with CD90/Thy1 and Celsr1 shows CD90/Thy1 cells occupy the same location adjacent to the Celsr1 expressing cells. g Triple staining with CD90/Thy1, Celsr1 and EdU shows CD90/Thy1 expressing cells are located adjacent to the EdU and Celsr1+ cells, yellow arrows and h enlarged region showing the co-localization of EdU+ ; Celsr1+ cells. i Immuno-staining of FACS sorted GFP + cells from clipped CD90/Thy1-cre;mTmG mouse incisors with Celsr1 and PH3 on cytospin slides, identifies GFP+ ;Celsr1+;PH3+ triple positive (white arrow,) and GFP+ ;Celsr1;PH3 cells (green arrow). Bar 250 µm in (a), (e), (f), and (g). 50 µm in b, 100 µm in d and 10 µm in (h) and (i)
Fig. 7
Fig. 7
Measurement of growth rates of opposed incisors after clipping. a, b Mice incisors were clipped on the upper right side and a marker notch made on both lower incisors just above the gingiva. The notch movements were measured 2 days after clipping. Asterisk indicates clipped incisor. c Quantification of notch movements shows no significant difference in growth rates of unopposed (U) and opposed (O) incisors. N > = 5 mice per group. NS not significant by Student’s t-test. Data presented as mean ± S.E.M

References

    1. Feng J, Mantesso A, De Bari C, Nishiyama A, Sharpe PT. Dual origin of mesenchymal stem cells contributing to organ growth and repair. Proc. Natl Acad. Sci. USA. 2011;108:6503–6508. doi: 10.1073/pnas.1015449108. - DOI - PMC - PubMed
    1. Kaukua, N. et al. Glial origin of mesenchymal stem cells in a tooth model system. Nature10.1038/nature13536 (2014). - PubMed
    1. Zhou BO, Yue R, Murphy MM, Peyer JG, Morrison SJ. Leptin-receptor-expressing mesenchymal stromal cells represent the main source of bone formed by adult bone marrow. Cell Stem Cell. 2014;15:154–168. doi: 10.1016/j.stem.2014.06.008. - DOI - PMC - PubMed
    1. Chan CKF, et al. Identification and specification of the mouse skeletal stem cell. Cell. 2015;160:285–298. doi: 10.1016/j.cell.2014.12.002. - DOI - PMC - PubMed
    1. Worthley DL, et al. Gremlin 1 identifies a skeletal stem cell with bone, cartilage, and reticular stromal potential. Cell. 2015;160:269–284. doi: 10.1016/j.cell.2014.11.042. - DOI - PMC - PubMed

Publication types

MeSH terms

LinkOut - more resources