. 2018 Jan;33(1):21-30.
doi: 10.1007/s12291-017-0651-8. Epub 2017 Apr 21.

Possible Role of microRNA-122 in Modulating Multidrug Resistance of Hepatocellular Carcinoma

Affiliations

Possible Role of microRNA-122 in Modulating Multidrug Resistance of Hepatocellular Carcinoma

Shaymaa M M Yahya et al. Indian J Clin Biochem. 2018 Jan.

Abstract

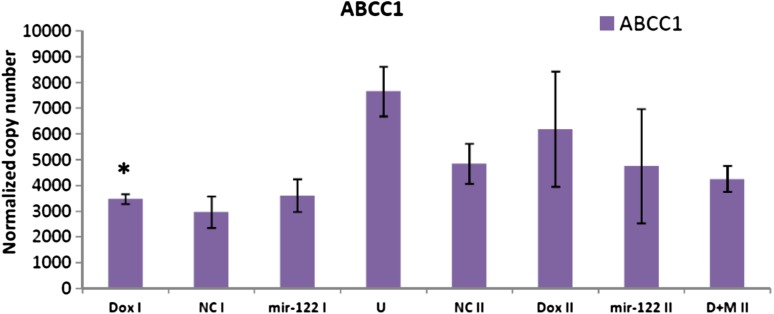
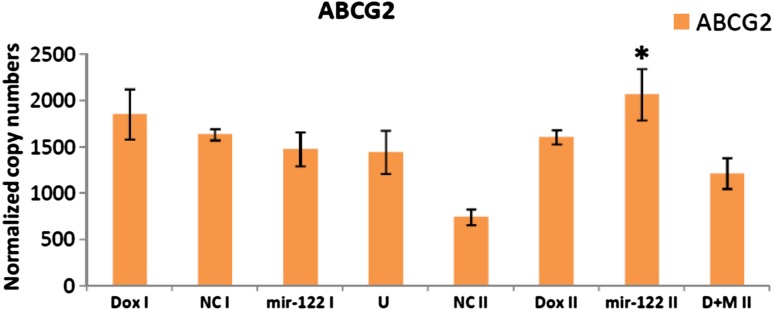
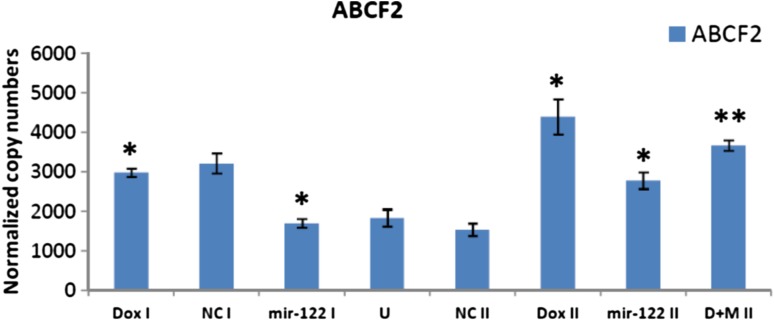
Hepatocellular carcinoma (HCC) is a hypervascular primary liver cancer characterized by rapid progression, besides, resistance to traditional chemotherapeutic agents. It has been shown that microRNAs play critical roles in regulation of tumor cell sensitivity to drugs through modulating the expression of genes involved in drug transport. The present study investigated whether restoration of miR-122 in HCC cells could alter the cell cycle distribution and the expression of multidrug resistance (MDR)-related genes (ABCB1, ABCC1, ABCG2 and ABCF2). After overexpression of miR-122 in HepG2 cells treated or untreated with doxorubicin doses, total RNAs and protein extracts were isolated for application of QRT-PCR and western blotting techniques. Moreover, cell cycle distribution was monitored by flow cytometry. Our results revealed that, the over expression of miR-122 in HepG2 cells treated or untreated with doxorubicin could modulate the sensitivity of cells to chemotherapeutic drug through downregulation of MDR-related genes, ABCB1 and ABCF2. Interpretation of cell cycle distribution revealed that, the anti-proliferative effect of miR-122 is associated with the accumulation of cells in G0/G1 phase. Moreover, treatment with miR-122 and doxorubicin resulted in high percentage of HCC cells in G0/G1 phase. Taken together, our findings revealed that, overexpression of miR-122 inhibited HCC cell growth by inducing cell cycle arrest and this arrest is associated with down-regulation of MDR-related genes.

Keywords: ABCs; Cell cycle; Hepatocellular carcinoma; MDR; miRNA-122.


Conflict of interest statement

Compliance with Ethical StandardsThe authors declare that they have no conflict of interest.This article does not contain any studies with human participants or animals performed by any of the authors.

Figures

Fig. 1
Fig. 1
Morphological appearance of wild HepG2 (a) versus doxorubicin resistant HepG2 (b) monolayers
Fig. 2
Fig. 2
Copy numbers of miR-122 in cells treated with inhibitor negative control (NC) and mir-122 mimic
Fig. 3
Fig. 3
ABCB1 gene expression levels. Dox I; cells treated with chronic doxorubicin dose, NCI; cells treated with chronic doxorubicin dose then transfected with inhibitor negative control, miR-122 I; cells treated with chronic doxorubicin dose then transfected with miR-122 mimics, U; wild HepG2 cells, NCII; Wild HepG2 cells transfected with inhibitor negative control, Dox II; HepG2 cells treated with acute high doxorubicin dose, miR-122 II; HepG2 cells transfected with miR-122 mimics and D + M II; HepG2 cells treated with acute high doxorubicin dose and transfected with miR-122 mimics. Data was presented as mean ± SEM. *P < 0.05
Fig. 4
Fig. 4
ABCC1 gene expression levels. Dox I; cells treated with chronic doxorubicin dose, NCI; cells treated with chronic doxorubicin dose then transfected with inhibitor negative control, miR-122 I; cells treated with chronic doxorubicin dose then transfected with miR-122 mimics, U; wild HepG2 cells, NCII; Wild HepG2 cells transfected with inhibitor negative control, Dox II; HepG2 cells treated with acute high doxorubicin dose, miR-122 II; HepG2 cells transfected with miR-122 mimics and D + M II; HepG2 cells treated with acute high doxorubicin dose and transfected with miR-122 mimics. Data was presented as mean ± SEM. *P < 0.05
Fig. 5
Fig. 5
ABCG2 gene expression levels. Dox I; cells treated with chronic doxorubicin dose, NCI; cells treated with chronic doxorubicin dose then transfected with inhibitor negative control, miR-122 I; cells treated with chronic doxorubicin dose then transfected with miR-122 mimics, U; wild HepG2 cells, NCII; Wild HepG2 cells transfected with inhibitor negative control, Dox II; HepG2 cells treated with acute high doxorubicin dose, miR-122 II; HepG2 cells transfected with miR-122 mimics and D + M II; HepG2 cells treated with acute high doxorubicin dose and transfected with miR-122 mimics. Data was presented as mean ± SEM. *P < 0.05
Fig. 6
Fig. 6
ABCF2 gene expression levels. Dox I; cells treated with chronic doxorubicin dose, NCI; cells treated with chronic doxorubicin dose then transfected with inhibitor negative control, miR-122 I; cells treated with chronic doxorubicin dose then transfected with miR-122 mimics, U; wild HepG2 cells, NCII; Wild HepG2 cells transfected with inhibitor negative control, Dox II; HepG2 cells treated with acute high doxorubicin dose, miR-122 II; HepG2 cells transfected with miR-122 mimics and D + M II; HepG2 cells treated with acute high doxorubicin dose and transfected with miR-122 mimics. Data was presented as mean ± SEM. *P < 0.05 and **P < 0.01
Fig. 7
Fig. 7
ABCB1 protein expression levels by western blotting. Dox I; cells treated with chronic doxorubicin dose, NCI; cells treated with chronic doxorubicin dose then transfected with inhibitor negative control, miR-122 I; cells treated with chronic doxorubicin dose then transfected with miR-122 mimics, U; wild HepG2 cells, NCII; Wild HepG2 cells transfected with inhibitor negative control, Dox II; HepG2 cells treated with acute high doxorubicin dose, miR-122 II; HepG2 cells transfected with miR-122 mimics and D + M II; HepG2 cells treated with acute high doxorubicin dose and transfected with miR-122 mimics
Fig. 8
Fig. 8
Analysis of cell cycle in HepG2 cells after treatment. a Cell cycle analysis of HepG2 cells transfected with miR-122 in the absence or presence of 0.5 µM doxorubicin. Following transfection, the cells were incubated with doxorubicin for 14 h before fixing with ethanol and staining with PI. U; untreated wild HepG2 cells, NC; Wild HepG2 cells transfected with inhibitor negative control, Dox; HepG2 cells treated with 0.5 µM doxorubicin, miR-122/Dox; HepG2 cells transfected with miR-122 mimic then treated with 0.5 µM doxorubicin, and miR-122; HepG2 cells transfected with miR-122 mimics. b Graphical representation of cell cycle distributions showing the percentage of cells in different phases in cell cycle

References

    1. Ferlay J, Shin HR, Bray F, Forman D, Mathers C, Parkin DM. Estimates of worldwide burden of cancer in 2008: GLOBOCAN 2008. Int J Cancer. 2010;127:2893–2917. doi: 10.1002/ijc.25516. - DOI - PubMed
    1. Wong CM, Ng IO. Molecular pathogenesis of hepatocellular carcinoma. Liver Int. 2008;28:160–174. doi: 10.1111/j.1478-3231.2007.01637.x. - DOI - PubMed
    1. Lyra-González I, Flores-Fong LE, González- García I, Medina-Preciado D, Armendariz-Borunda J. Adenoviral gene therapy in hepatocellular carcinoma: a review. Hepatol Int. 2013;7:48–58. doi: 10.1007/s12072-012-9367-2. - DOI - PubMed
    1. Forner A, Llovet JM, Bruix J. Hepatocellular carcinoma. Lancet. 2012;379:1245–1255. doi: 10.1016/S0140-6736(11)61347-0. - DOI - PubMed
    1. Cabibbo G, Maida M, Genco C, Antonucci M, Cammà C. Causes of and prevention strategies for hepatocellular carcinoma. Semin Oncol. 2012;39:374–383. doi: 10.1053/j.seminoncol.2012.05.006. - DOI - PubMed