

Published Erratum
doi: 10.3389/fmicb.2017.02598.
eCollection 2017.
Corrigendum: Phylogenetic Analyses of Shigella and Enteroinvasive Escherichia coli for the Identification of Molecular Epidemiological Markers: Whole-Genome Comparative Analysis Does Not Support Distinct Genera Designation
Affiliations
- PMID: 29371861
- PMCID: PMC5767330
- DOI: 10.3389/fmicb.2017.02598
Item in Clipboard
Published Erratum
Corrigendum: Phylogenetic Analyses of Shigella and Enteroinvasive Escherichia coli for the Identification of Molecular Epidemiological Markers: Whole-Genome Comparative Analysis Does Not Support Distinct Genera Designation
Front Microbiol.
.
Abstract
[This corrects the article on p. 1573 in vol. 6, PMID: 26834722.].
Keywords: Shigella; classification; enteroinvasive E. coli (EIEC); epidemiological markers; phylogeny; whole genome sequencing.
Figures
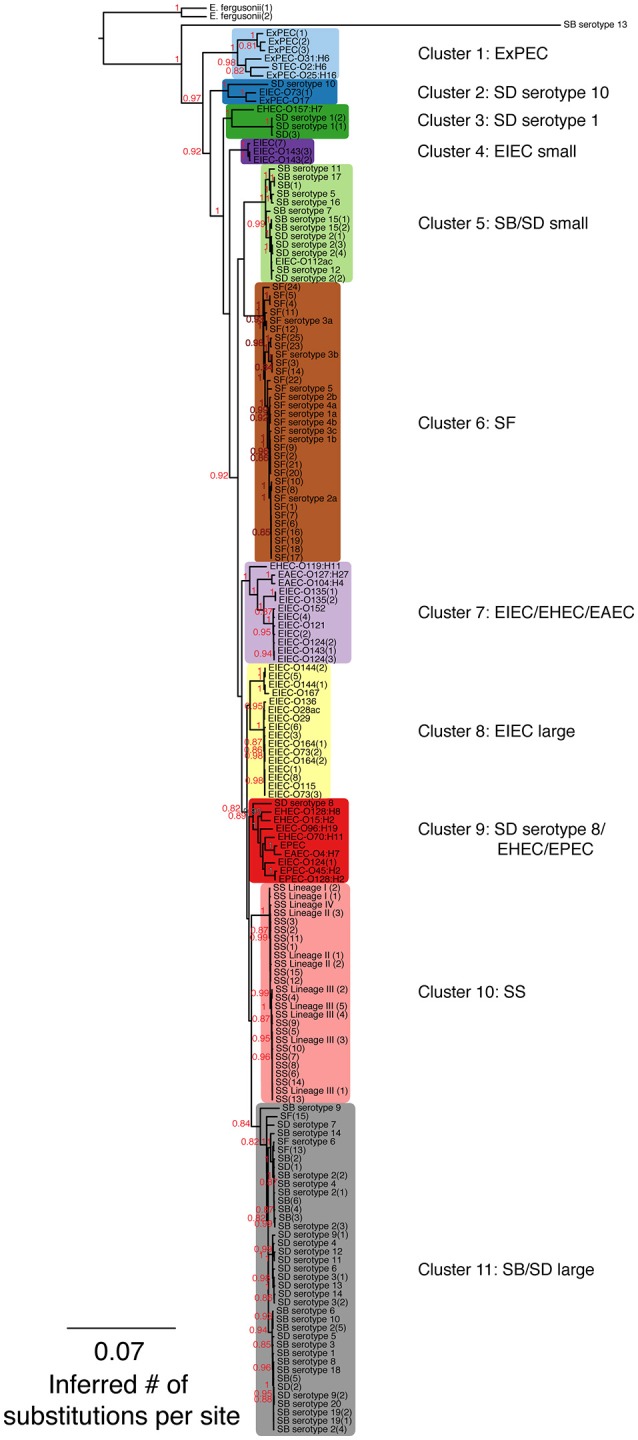
A maximum-likelihood (ML) phylogeny of Shigella, enteroinvasive E. coli (EIEC) and non-invasive E. coli strains based on 7,062 core SNPs using kSNP (Gardner and Hall, 2013). The ML tree was generated using GARLI v. 2.0.1019 under the GTR + I + Γ model and other default settings (Zwickl, 2006). Trees were visualized with Figtree v. 1.3.1 (Rambaut and Drummond, 2009). The best tree was chosen from 1,000 runs of the data set and bootstrap values (1,000 iterations) are reported above each node. Bootstrap values <80% are not shown. A tree that includes the Salmonella outgroup can be found in Supplementary Figure 1.
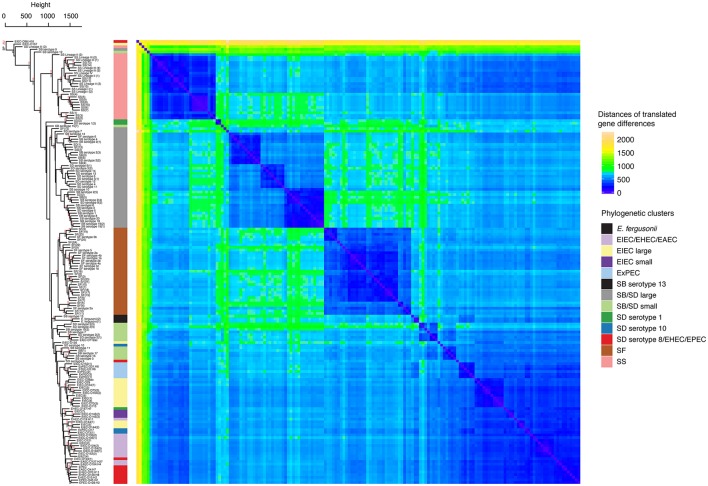
Hierarchical clustering and heat map illustrating the differences in predicted protein homologs between genomes. Manhattan distances were calculated from a pairwise abundance matrix of 3,777 predicted protein homologs that were identified using the default BLASTP bidirectional best hit approach (75% amino acid sequence coverage, 1e-05 E-value and 60% sequence identity) within the program GET_HOMOLOGUES (Contreras-Moreira and Vinuesa, 2013). Only genes shared by at least two samples were included. Blue cells on the heat map indicate that genomes share more similar genes. The dendrogram on y-axis indicates hierarchical clustering of the abundance matrix using the average linkage method and Manhattan distances with bootstrap probabilities (BP, only values of ≥80 shown in black) and approximately unbiased p-values (AU, only values of ≥95 shown in red) from 10,000 replicates. The phylogenetic group of each genome from Figure 1 is represented as a colored bar in between the dendrogram and the heat map.
Erratum for
-
Phylogenetic Analyses of Shigella and Enteroinvasive Escherichia coli for the Identification of Molecular Epidemiological Markers: Whole-Genome Comparative Analysis Does Not Support Distinct Genera Designation.Front Microbiol. 2016 Jan 19;6:1573. doi: 10.3389/fmicb.2015.01573. eCollection 2015. Front Microbiol. 2016. PMID: 26834722 Free PMC article.
Publication types
LinkOut - more resources
Full Text Sources
Other Literature Sources