. 2017 Dec 7;8(69):113373-113402.
doi: 10.18632/oncotarget.23009. eCollection 2017 Dec 26.

Cell-surface marker discovery for lung cancer

Affiliations

Cell-surface marker discovery for lung cancer

Allison S Cohen et al. Oncotarget. .

Abstract

Lung cancer is the leading cause of cancer deaths in the United States. Novel lung cancer targeted therapeutic and molecular imaging agents are needed to improve outcomes and enable personalized care. Since these agents typically cannot cross the plasma membrane while carrying cytotoxic payload or imaging contrast, discovery of cell-surface targets is a necessary initial step. Herein, we report the discovery and characterization of lung cancer cell-surface markers for use in development of targeted agents. To identify putative cell-surface markers, existing microarray gene expression data from patient specimens were analyzed to select markers with differential expression in lung cancer compared to normal lung. Greater than 200 putative cell-surface markers were identified as being overexpressed in lung cancers. Ten cell-surface markers (CA9, CA12, CXorf61, DSG3, FAT2, GPR87, KISS1R, LYPD3, SLC7A11 and TMPRSS4) were selected based on differential mRNA expression in lung tumors vs. non-neoplastic lung samples and other normal tissues, and other considerations involving known biology and targeting moieties. Protein expression was confirmed by immunohistochemistry (IHC) staining and scoring of patient tumor and normal tissue samples. As further validation, marker expression was determined in lung cancer cell lines using microarray data and Kaplan-Meier survival analyses were performed for each of the markers using patient clinical data. High expression for six of the markers (CA9, CA12, CXorf61, GPR87, LYPD3, and SLC7A11) was significantly associated with worse survival. These markers should be useful for the development of novel targeted imaging probes or therapeutics for use in personalized care of lung cancer patients.

Keywords: cell-surface; lung cancer; molecular imaging; target biomarker; targeted therapeutics.


Conflict of interest statement

CONFLICTS OF INTEREST AC and DM are listed as inventors on patent number US20160051704 A1 “Molecular Imaging Probes for Lung Cancer Intraoperative Guidance” that covers the described markers. The other authors declare that they have no conflicts of interest.

Figures

Figure 1
Figure 1
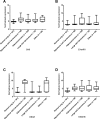
Representative microarray mRNA expression profiles for four of the selected lung cancer cell-surface markers in patient specimens of normal lung, lung tumors and other normal tissues: CA12 (A), GPR87 (B), LYPD3 (C), and SLC7A11 (D). Values are presented as whisker/box plots with whiskers representing the full range of values, the bottom and top of the boxes represent the 25th and 75th percentile, and middle lines represent the median.
Figure 2
Figure 2
Representative microarray mRNA expression profiles for four of the selected markers in patient specimens of normal lung and lung tumors of various lung cancer histologies: CA9 (A), CXorf61 (B), DSG3 (C), and KISS1R (D). Values are presented as whisker/box plots with whiskers representing the full range of values, the bottom and top of the boxes represent the 25th and 75th percentile, and the middle lines represent the median.
Figure 3
Figure 3. Representative images of IHC stained patient lung tumor and normal lung tissue specimens from the tissue microarray (TMA) for half of the selected markers
A representative normal lung sample and representative lung tumor samples with scores of 0, 1+, 2+, and 3+ are shown for each marker. The images are taken at 10x magnification. *Protein expression is stained but gene names are used to conserve space.
Figure 4
Figure 4. Representative images of IHC stained patient lung tumor and normal lung tissue specimens from the tissue microarray (TMA) for the remaining selected markers
A representative normal lung sample and representative lung tumor samples with scores of 0, 1+, 2+, and 3+ are shown for each marker. The images are taken at 10x magnification. *Protein expression is stained but gene names are used to conserve space.
Figure 5
Figure 5. Marker expression in human lung cancer cell lines
mRNA microarray data was analyzed for non-small cell lung cancer cell lines with high and low/no endogenous expression of each of the markers. The graph shows three cell lines with high and three cell lines with low/no expression for each marker.
Figure 6
Figure 6. Representative Kaplan–Meier survival curves for lung cancer markers using mRNA expression data dichotomized based on the median-cut point
The five-year survival for patients with high mRNA expression (dashed line) vs. low mRNA expression (solid line) was plotted for each of the markers. Shown are data for CA9 (A), CA12 (B), CXorf61 (C), LYPD3 (D), and SLC7A11 (E). Each of these markers shows a statistically significant difference in survival for patients with high vs. low mRNA expression.
Figure 7
Figure 7. Representative Kaplan–Meier survival curves for lung cancer markers using mRNA expression data analyzed as tertiles
The five-year survival for the third of patients with the highest mRNA expression (short dashed line); the middle third (dashed line); and the third with lowest expression (solid line) was plotted for each of the markers. Shown are data for CA9 (A), CA12 (B), GPR87 (C), LYPD3 (D), and SLC7A11 (E). Each of these markers shows a statistically significant difference in survival for patients with high vs. low mRNA expression.
Figure 8
Figure 8
Kaplan–Meier survival curves for (A) metagene and (B) both LYPD3 and CA12 groupings. (A) For the metagene analysis, data were dichotomized based on the median cut-point. The five-year survival for patients with high metagene expression (dashed line) vs. low metagene expression (solid line) was plotted. There is a statistically significant difference in survival (P < 0.01). (B) For the LYPD3 and CA12 combined analysis, mRNA expression data were divided into four subgroups. The five-year survival for patients with low LYPD3/low CA12 (solid line), low LYPD3/high CA12 (dashed line), high LYPD3/low CA12 (short dashed line) and high LYPD3/high CA12 (long dashed line) was plotted. There is a statistically significant difference in survival (P < 0.0001).
Figure 9
Figure 9
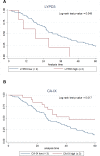
Kaplan–Meier survival curves for (A) LYPD3 and (B) CA-IX using IHC scoring data. The data were normalized by multiplying the staining intensity by the tumor cell staining percent. The five-year survival for patients with high protein expression (red line) vs. low protein expression (blue line) was plotted.

References

    1. Siegel R, Miller KD, Jemal A. Cancer Statistics, 2017. CA Cancer J Clin. 2017;67:7–30. https://doi.org/10.3322/caac.21387. - DOI - PubMed
    1. American Cancer Society . Cancer Facts & Figures 2017. Atlanta: American Cancer Society; 2017.
    1. Islam S, Walker RC. Advanced imaging (positron emission tomography and magnetic resonance imaging) and image-guided biopsy in initial staging and monitoring of therapy of lung cancer. Cancer J. 2013;19:208–16. https://doi.org/10.1097/PPO.0b013e318295185f. - DOI - PMC - PubMed
    1. Lee WK, Lau EW, Chin K, Sedlaczek O, Steinke K. Modern diagnostic and therapeutic interventional radiology in lung cancer. J Thorac Dis. 2013;5:S511–23. - PMC - PubMed
    1. Koyama H, Ohno Y, Seki S, Nishio M, Yoshikawa T, Matsumoto S, Sugimura K. Magnetic resonance imaging for lung cancer. J Thorac Imaging. 2013;28:138–50. https://doi.org/10.1097/RTI.0b013e31828d4234. - DOI - PubMed