. 2017 Dec 8;8(69):113938-113956.
doi: 10.18632/oncotarget.23044. eCollection 2017 Dec 26.

Modulating the metabolism by trimetazidine enhances myoblast differentiation and promotes myogenesis in cachectic tumor-bearing c26 mice

Affiliations

Modulating the metabolism by trimetazidine enhances myoblast differentiation and promotes myogenesis in cachectic tumor-bearing c26 mice

Lucia Gatta et al. Oncotarget. .

Abstract

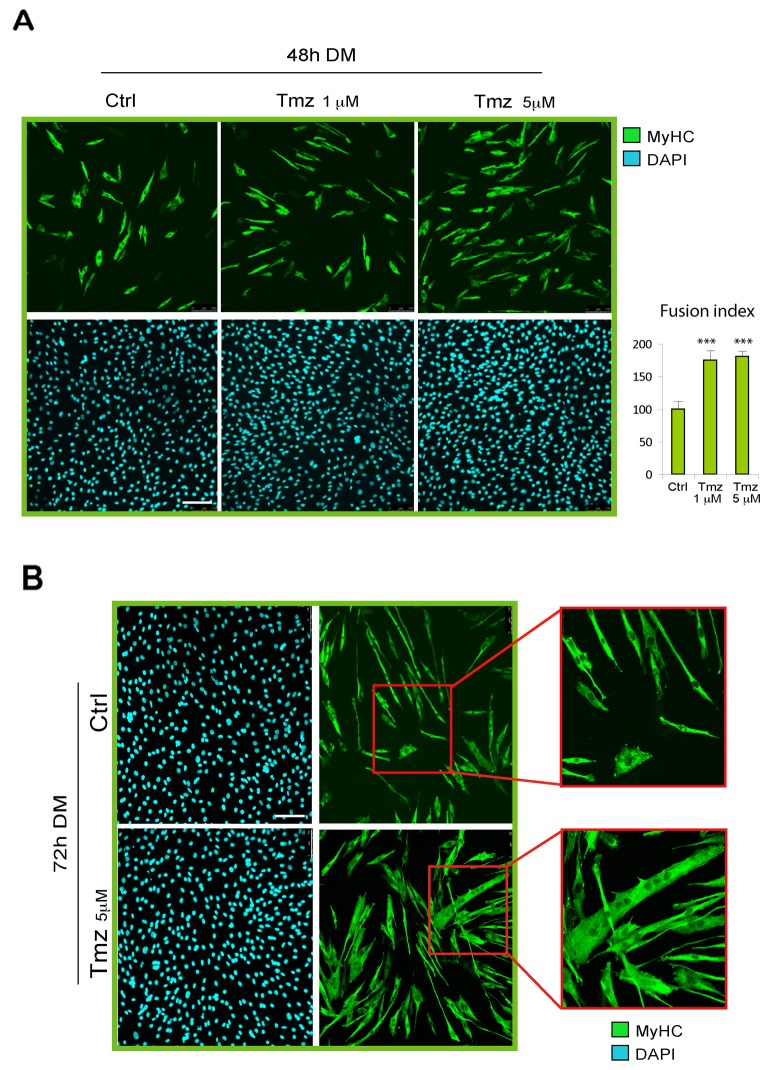
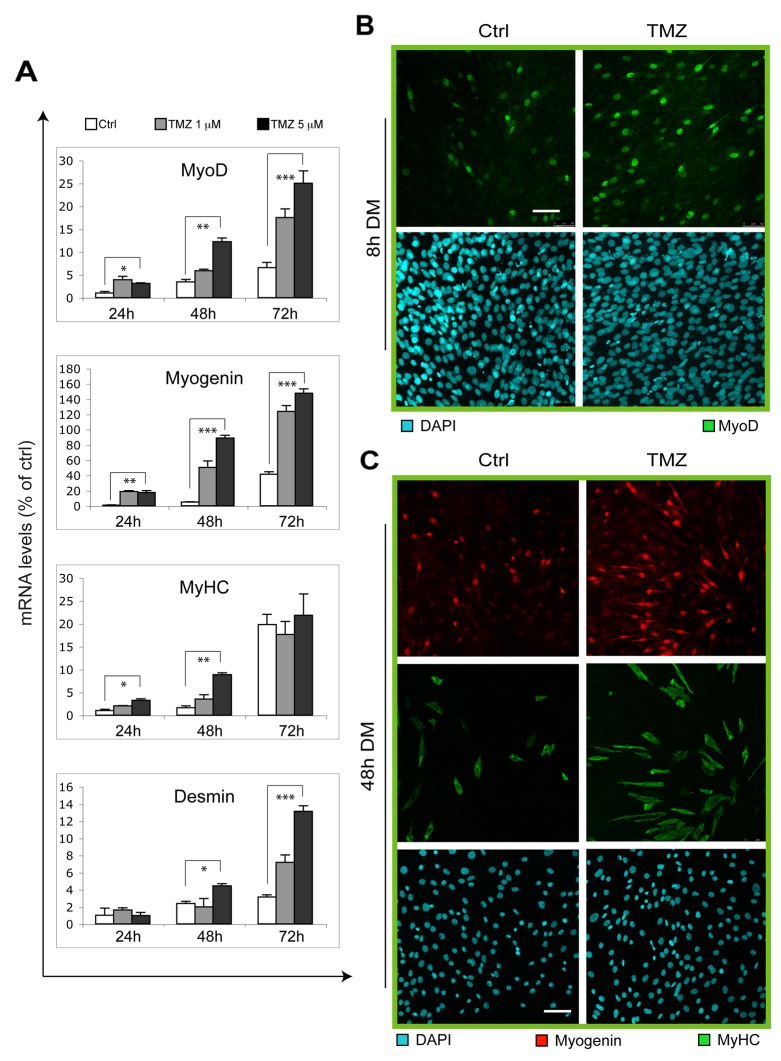
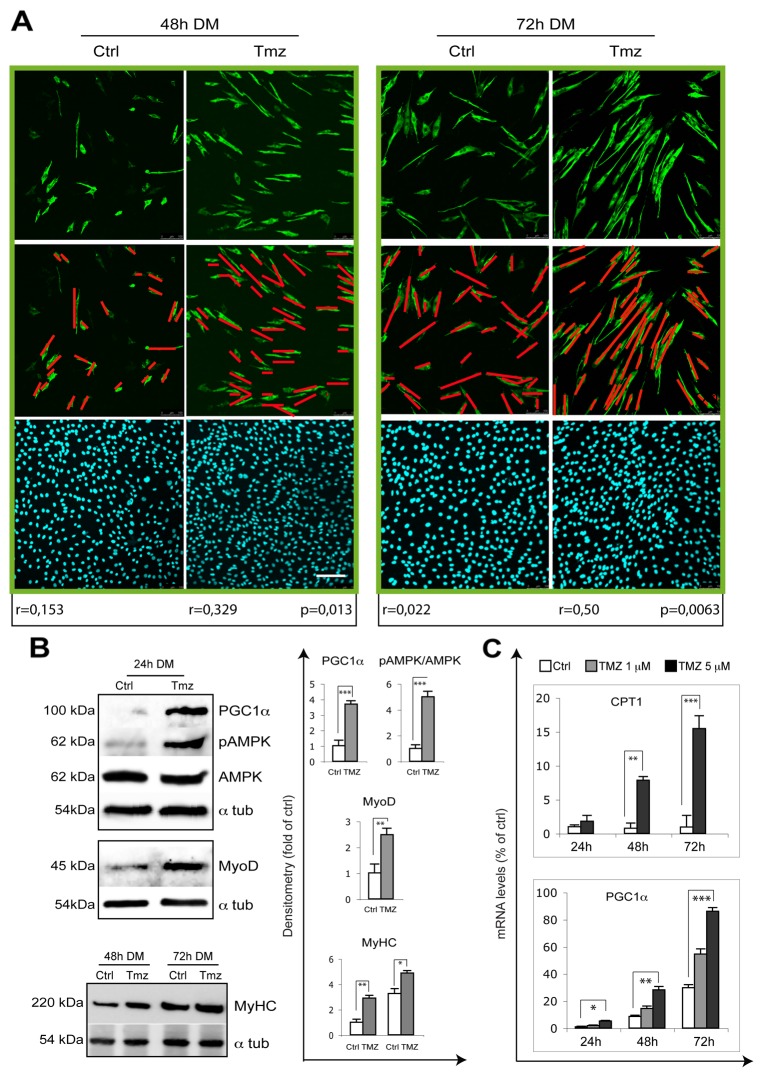
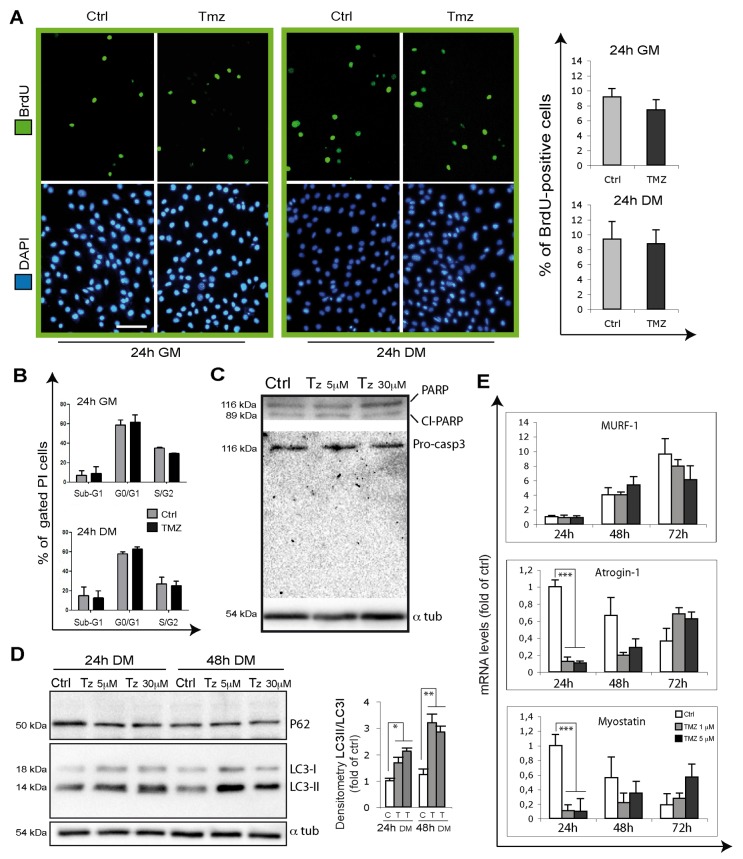
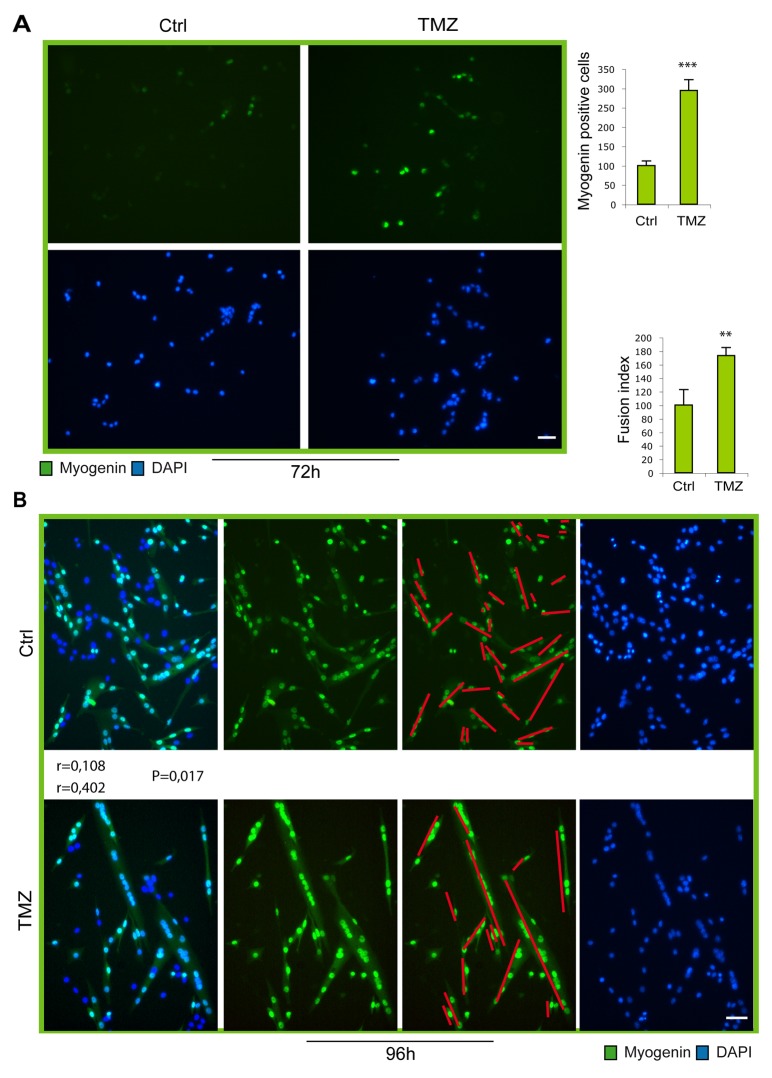
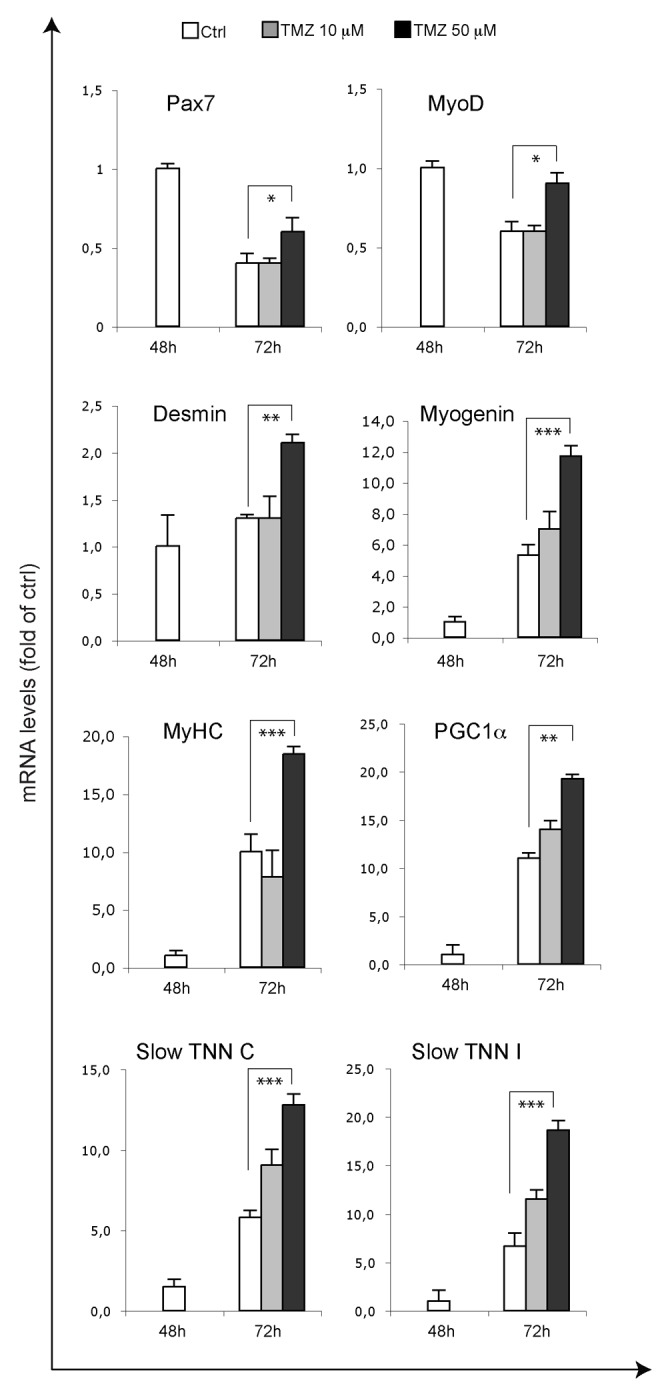
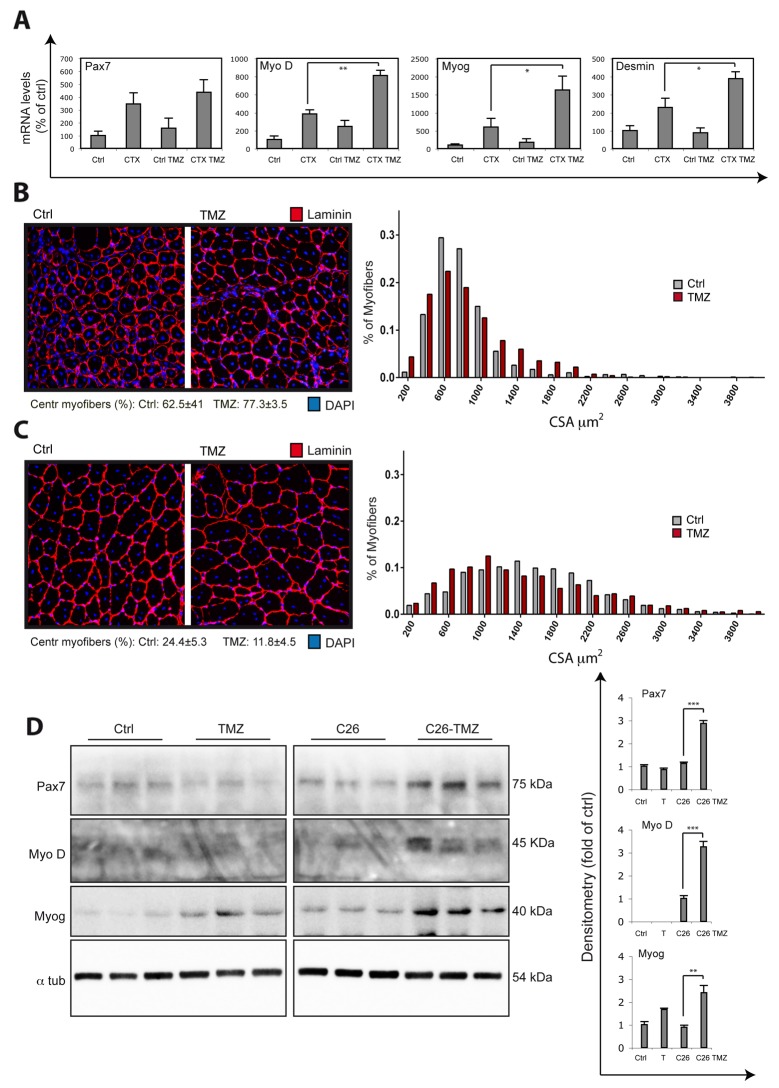
Trimetazidine (TMZ) is a metabolic reprogramming agent able to partially inhibit mitochondrial free fatty acid β-oxidation while enhancing glucose oxidation. Here we have found that the metabolic shift driven by TMZ enhances the myogenic potential of skeletal muscle progenitor cells leading to MyoD, Myogenin, Desmin and the slow isoforms of troponin C and I over-expression. Moreover, similarly to exercise, TMZ stimulates the phosphorylation of the AMP-activated protein kinase (AMPK) and up-regulates the peroxisome proliferator-activated receptor gamma coactivator 1-α (PGC1α), both of which are known to enhance the mitochondrial biogenesis necessary for myoblast differentiation. TMZ also induces autophagy which is required during myoblast differentiation and promotes myoblast alignment which allows cell fusion and myofiber formation. Finally, we found that intraperitoneally administered TMZ (5mg/kg) is able to stimulate myogenesis in vivo both in a mice model of cancer cachexia (C26 mice) and upon cardiotoxin damage. Collectively, our work demonstrates that TMZ enhances myoblast differentiation and promotes myogenesis, which might contribute recovering stem cell blunted regenerative capacity and counteracting muscle wasting, thanks to the formation of new myofibers; TMZ is already in use in humans as an anti-anginal drug and its repositioning might impact significantly on aging and regeneration-impaired disorders, including cancer cachexia, as well as have implications in regenerative medicine.

Keywords: C26 mice; cachexia; metabolism; myogenesis; trimetazidine.


Conflict of interest statement

CONFLICTS OF INTEREST The authors declare that they have no conflicts of interest.

Figures

Figure 1
Figure 1. TMZ enhances C2C12 skeletal myoblast differentiation
(A) Representative pictures of C2C12 myoblasts differentiating for 48 hours in differentiating medium (DM) in the absence (Ctrl) or presence (TMZ) of different concentrations of TMZ and then stained with anti-MyHC antibody (green) and DAPI (blue) for nuclei detection. Quantification of fusion index after these treatments is shown in the histogram on the right. At least 30 fields were analyzed for each condition in four independentexperiments. Data are mean ± s.e.m. ***p ≤ 0.005 by two-tailed Student’s t-test. Scale bar: 150 μm. (B) Representative pictures of C2C12 myoblasts differentiating for 72 hours in DM in the absence (Ctrl) or presence (TMZ) of TMZ. The higher level of fusion with TMZ is highlighted by the enlargement of the red labeled area. Scale bar: 100 μm.
Figure 2
Figure 2. Myogenic genes are overexpressed upon TMZ treatment
(A) The mRNA levels of MyoD, Myogenin, Desmin and MyHC, were evaluated by quantitative real time PCR in C2C12 differentiating (for 24, 48 and 72 hours in DM) myoblasts treated (TMZ) or not (Ctrl) with 1 μM or 5 μM TMZ. Data were normalized to 18S used as internal control. Data display the percentage of mRNAs relative to untreated cells (24h in DM), which was arbitrarily set as 1. Data shown are the mean ± s.e.m. from three experiments each performed in triplicate. *p ≤ 0.05, **p ≤ 0.01 and ***p≤ 0.005 by two-tailed Student’s t-test. (B) Representative pictures of C2C12 myoblasts differentiating for 8 hours in DM in the absence (Ctrl) or presence of 5μM TMZ (TMZ) and then stained to detect MyoD (green) and nuclei (DAPI, blue). Five experiments were performed. Scale bar: 75 μm. (C) Representative pictures of C2C12 myoblasts differentiating for 48 hours in DM in the absence (Ctrl) or presence of 5μM TMZ and then stained to detect Myogenin (red), MyHC (green) and nuclei (DAPI, blue). Five experiments were performed. Scale bar: 75 μm.
Figure 3
Figure 3. TMZ enhances the alignment of differentiating myoblasts
(A) Representative pictures of C2C12 myoblasts differentiating for 48 hours and 72 hours in DM in the absence (Ctrl) or presence of 5 μM TMZ (TMZ) and then stained to detect MyHC (green) and nuclei (DAPI, blue). Scale bar: 150 μm. n = number of analyzed cells; r = mean vector length (statistic of Rayleigh test); p = observed significance. The mean vector length r can range from 0 (perfect isotropy; of multiple cell directions) to 1 (perfect anisotropy; existence of a preferred-aligned-cell direction). Three independent experiments for each condition were performed, with a total of not less than 300 cells analyzed for each condition. (B) Extracts from untreated control C2C12 (Ctrl) and 10μM TMZ-treated C2C12 cells (TMZ) were assayed for MyoD, pAMPK, AMPK, PGC-1α and MyHC protein levels. Protein levels of a representative experiment out of three are shown. α-tubulin was used as loading control. Density of immunoreactive bands was calculated using the ImageQuant TL software from GE Healthcare Life and normalized for α-tubulin. Each value indicates the mean± s.e.m. (reported as percentage of Ctrl) of the densitometric analysis on three independent immunoblots. *p ≤ 0.05, **p ≤ 0.01 and ***p≤ 0.005 by student t-test. (C) The mRNA levels of PGC-1α and CPT1, were evaluated by quantitative real time PCR in C2C12 differentiating (for 24, 48 and 72 hours in DM) myoblasts treated (TMZ) or not (Ctrl) with 1 μM or 5 μM TMZ. Data were normalized to 18S used as internal control. Data display the percentage of mRNAs relative to untreated cells (24h in DM), which was arbitrarily set as 1. Data shown are the mean ± s.e.m. from three experiments each performed in triplicate. *p ≤ 0.05, **p ≤ 0.01 and ***p≤ 0.005 by two-tailed Student’s t-test.
Figure 4
Figure 4. TMZ influence on proliferation, apoptosis, autophagy and atrophy markers
(A) Representative images of BrdU incorporating C2C12 cells (green) treated for 24 hours with or without 5 μM TMZ in GM and in DM. During the last 4h of incubation, cells were labeled with BrdU. Nuclei were stained with DAPI (blue). Four experiments were performed. Scale bar: 75 μm. (B) Cell cycle analysis of C2C12 in GM or DM for 24 hours with or without 5 μM TMZ. Cells were then stained with propidium iodide. Histograms show the mean ± SE of four independent experiments. No difference were observed in resting (G0/G1) and proliferating cells (S/G2) nor in the percentage of hypodiploid apoptotic (sub-G1) cells. (C) Total extracts of differentiating myoblasts kept for 24 hours in DM untreated (Ctrl) or TMZ-treated (5 μM and 30 μM) were assayed for PARP and Caspase-3 cleavage and (D), also kept for 48 hours in DM, for LC3 and p62. The cleaved form of Caspase-3 is undetectable in each condition. Protein levels of a representative experiment out of three are shown. ɑ-tubulin was assayed as a control for equal protein loading. (E) The mRNA levels of Atrogin-1, Murf1 and Myostatin were evaluated by quantitative real time PCR in differentiating (for 24, 48 and 72 hours in DM) C2C12 treated or not (Ctrl) with 1 μM or 5 μM TMZ. Data were normalized to 18S. Data display the percentage of mRNAs relative to untreated cells for 24 hours in DM, which was arbitrarily set as 1. Data shown are the mean ± s.e.m. from three experiments each performed in triplicate. ***p≤ 0.005 by two-tailed Student’s t-test.
Figure 5
Figure 5. Myogenic gene expression and fusion increase in TMZ-treated SCs
(A) Representative images of satellite cells in culture for 72 hours, the last 48 hours of which treated (TMZ) or not (Ctrl) with 50 μM TMZ for the last 48 hours. Our previous esperiments showed that a higher concentration of TMZ is needed for the treatment of SCs compared to C2C12 cells. Cells were incubated with an anti-myogenin antibody (green) and with DAPI (blue). Scale bar: 75 μm. (B) Representative images of satellite cells in culture for 96h the last 48h of which treated (TMZ) or not (Ctrl) with 50 μM TMZ for the last 48 hours. Cells were incubated with an anti-myogenin antibody (green) and with DAPI (blue). Quantification of fusion index is shown in the histograms on the right. At least 20 fields were analyzed for each condition in four independentexperiments. Scale bar: 75 μm. Data are means ± SEM. **P < 0.01 and ***P < 0.005. For myotube orientation measurement, three independent experiments for each condition were performed, with a total of not less than 300 cells analyzed for each condition. n = number of analyzed cells; r = mean vector length (statistic of Rayleigh test); p = observed significance. The mean vector length r can range from 0 (perfect isotropy; of multiple cell directions) to 1 (perfect anisotropy; existence of a preferred-aligned-cell direction).
Figure 6
Figure 6. Myogenic genes are overexpressed upon TMZ treatment in SCs
The mRNA levels of MyoD, Pax7, MyoD, Desmin, Myogenin, MyHC, PGC1ɑ, slow Troponin C (TNN C) and slow Troponin I (TNN I) were evaluated by quantitative real time PCR in primary SCs differentiating for 48 hours and 72 hours and, in the case of SCs differentiating for 72 hours, treated for the last 24 hours with 10 μM or 50 μM TMZ. Data were normalised to 18S used as internal control. Data display the percentage of mRNAs relative to control 24 hours DM, which was arbitrarily set as 1. Data shown are the mean ± s.e.m. from four experiments each performed in triplicate. *p < 0.05, **p ≤ 0.01 and ***p≤ 0.005 by two-tailed Student’s t-test.
Figure 7
Figure 7. TMZ stimulates new myofiber formation in vivo
(A) The mRNA levels of Pax7, MyoD, Myogenin (Myog), Desmin and MCP1 were evaluated by quantitative real time PCR and were normalised to 18S used as internal control in TA muscles of untreated mice (Ctrl), cardiotoxin (CTX)-injured mice (CTX), TMZ-treated mice (Ctrl TMZ), and TMZ-treated CTX-injured mice (CTX TMZ) 5 days post-injury. At least six mice for each group were used. TMZ was administered 5mg/kg for 5 days by daily intraperitoneal (i.p.) injections from -1 to +4 days with respect to CTX muscle injury date T0. Data display the percentage of mRNAs relative to control, which was arbitrarily set as 100. Data shown are the mean ± s.e.m. from three experiments each performed in triplicate. *p ≤ 0.05 and **p ≤ 0.01 by two-tailed Student’s t-test. (B) To quantify regeneration due to CTX-induced injury, muscle sections of the injected muscles were analyzed 5 days post-injury. Representative images only of the area with centronucleated myofibers of Laminin/DAPI stained cross-sections from at least three separate transverse planes of TA muscles damaged with CTX untreated (Ctrl) or treated (TMZ) with TMZ are shown. The percentage of centronucleated myofibers (Centr myofibers) on the whole section is indicated. Five untreated mice and and five TMZ-treated mice and at least 5000 myofibers from 5 untreated mice and at least 5000 myofibers from 5 TMZ-treated mice have been evaluated for the determination of cross-sectional area (CSA). Frequency histograms show the distribution of CSA measured only for centronucleated myofibers. Scale bar: 100 μm. (D) Same as (C) but at 15 days post-injury. The percentage of centronucleated myofibers (Centr myofibers) on the whole section is indicated (**p ≤ 0.01). (D) GSN extracts from untreated control mice (Ctrl), TMZ-treated control mice (TMZ), C26 mice (C26) and TMZ-treated C26 mice (C26-TMZ) were assayed for Pax7, MyoD and Myogenin (Myog) protein levels. Protein levels of representative 3 out of 6 mice are shown. A lane between lane 6 and lane 7 was removed from the blot because of technical problems. ɑ-tubulin was used as loading control. Density of immunoreactive bands was calculated using the ImageQuant TL software from GE Healthcare Life normalized for α-tubulin. Each value indicates the mean± s.e.m. (reported as percentage of Ctrl) of the densitometric analysis on three independent immunoblots. **p ≤ 0.01 and ***p ≤ 0.001 by Student t-test.

References

    1. Mauro A. Satellite cell of skeletal muscle fibers. J Biophys Biochem Cytol. 1961;9:493–5. - PMC - PubMed
    1. Wang YX, Rudnicki MA. Satellite cells, the engines of muscle repair. Nat Rev Mol Cell Biol. 2012;13:127–33. https://doi.org/10.1038/nrm3265. - DOI - PubMed
    1. Charge SB, Rudnicki MA. Cellular and molecular regulation of muscle regeneration. Physiol Rev. 2004;84:209–38. https://doi.org/10.1152/physrev.00019.2003. - DOI - PubMed
    1. Creuzet S, Lescaudron L, Li Z, Fontaine-Perus J. MyoD, myogenin, and desmin-nls-lacZ transgene emphasize the distinct patterns of satellite cell activation in growth and regeneration. Exp Cell Res. 1998;243:241–53. https://doi.org/10.1006/excr.1998.4100. - DOI - PubMed
    1. Yablonka-Reuveni Z, Rivera AJ. Temporal expression of regulatory and structural muscle proteins during myogenesis of satellite cells on isolated adult rat fibers. Dev Biol. 1994;164:588–603. https://doi.org/10.1006/dbio.1994.1226. - DOI - PMC - PubMed