. 2018 Jan;34(1):65-73.
doi: 10.5487/TR.2018.34.1.065. Epub 2018 Jan 15.

Pretreatment of Low-Dose and Super-Low-Dose LPS on the Production of In Vitro LPS-Induced Inflammatory Mediators

Affiliations

Pretreatment of Low-Dose and Super-Low-Dose LPS on the Production of In Vitro LPS-Induced Inflammatory Mediators

Byeong Suk Chae. Toxicol Res. 2018 Jan.

Abstract

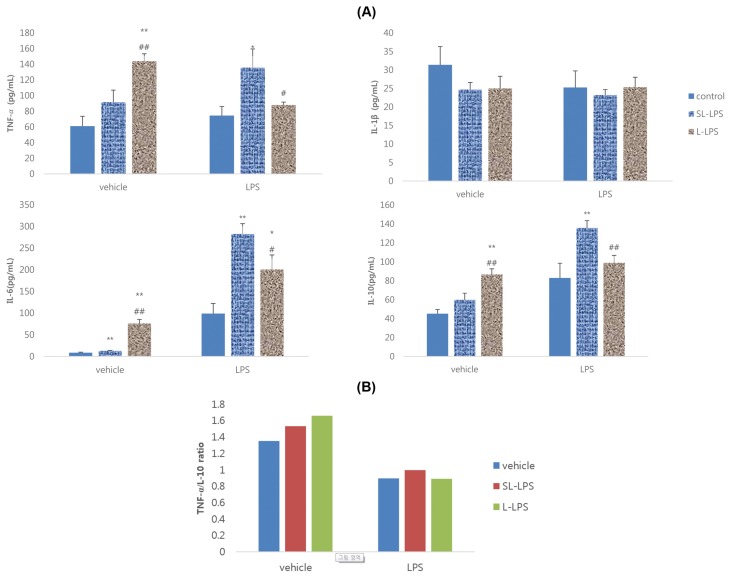
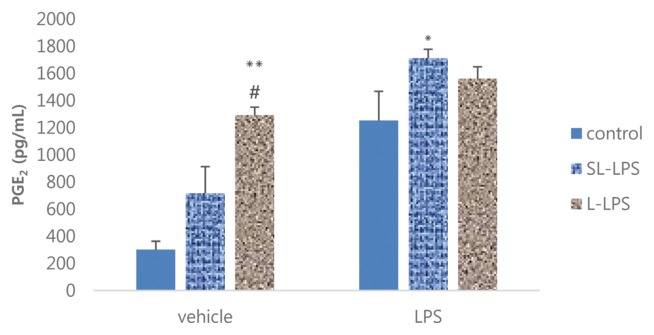
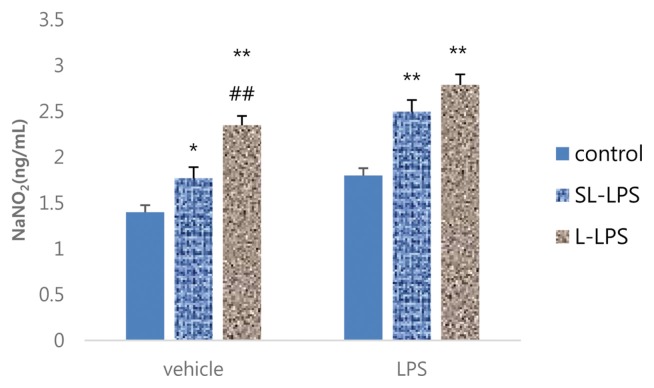
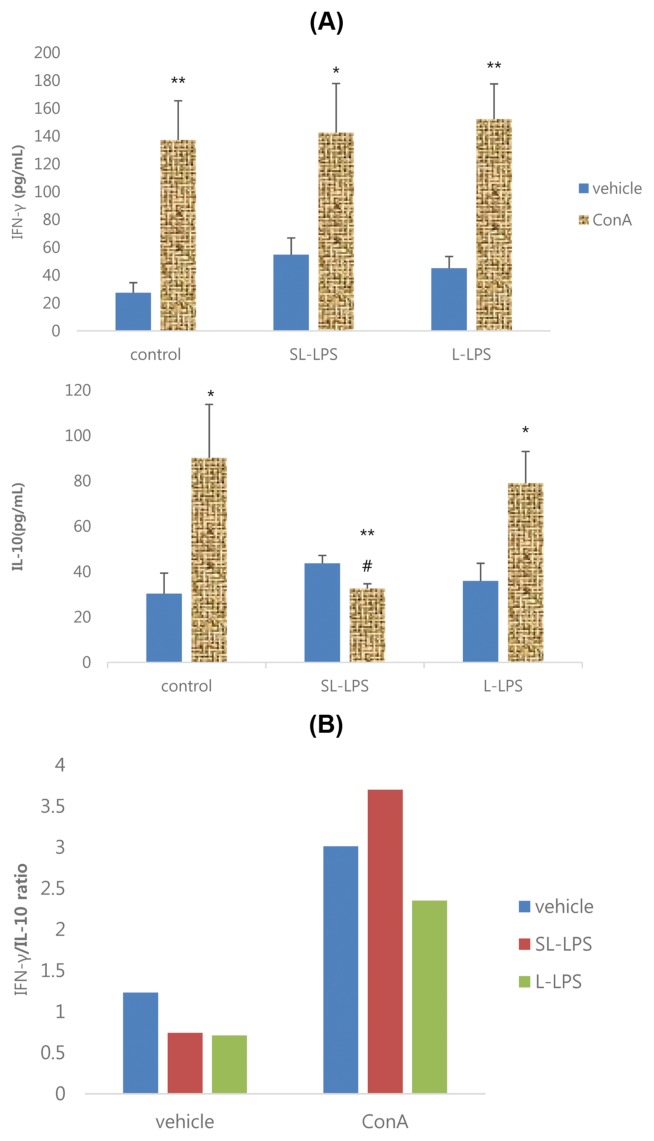
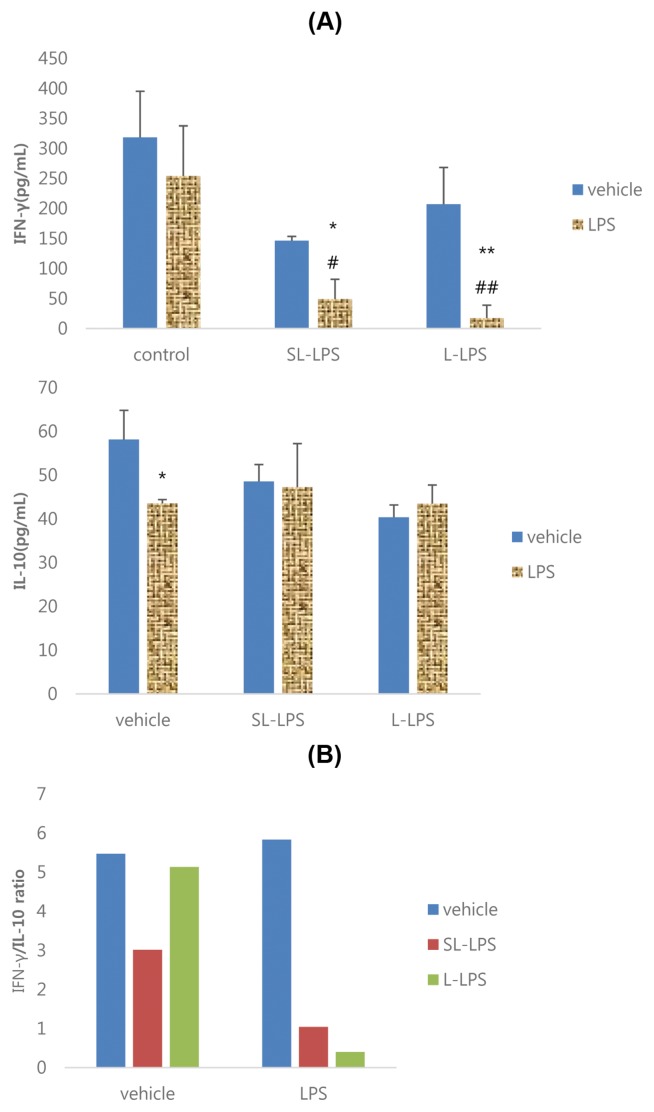
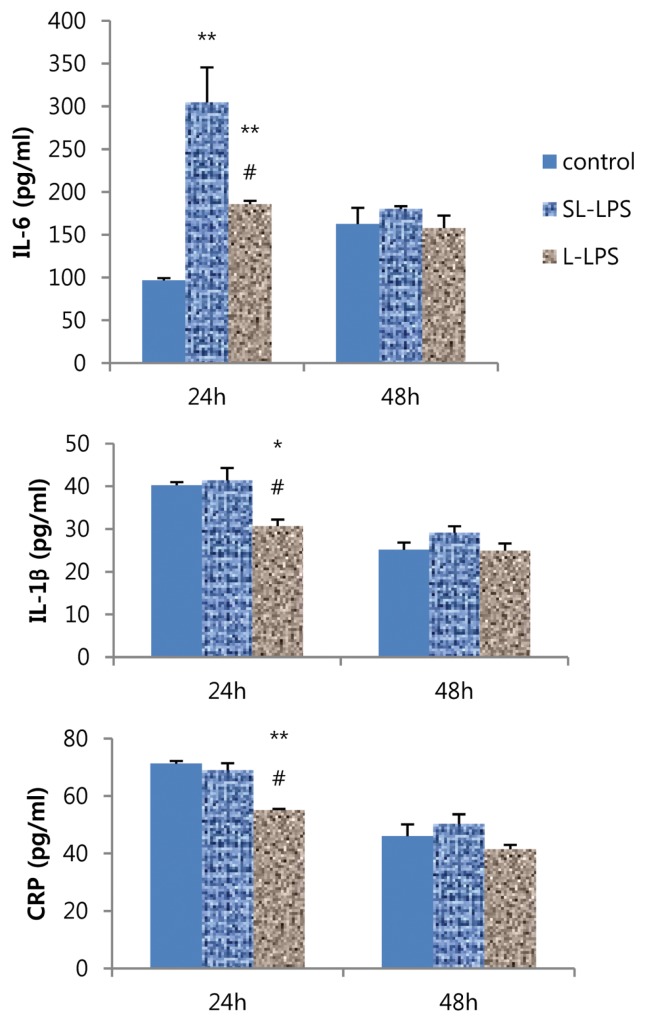
Pretreatment of low-dose lipopolysaccharide (LPS) induces a hyporesponsive state to subsequent secondary challenge with high-dose LPS in innate immune cells, whereas super-low-dose LPS results in augmented expression of pro-inflammatory cytokines. However, little is known about the difference between super-low-dose and low-dose LPS pretreatments on immune cell-mediated inflammatory and hepatic acute-phase responses to secondary LPS. In the present study, RAW 264.7 cells, EL4 cells, and Hepa-1c1c7 cells were pretreated with super-low-dose LPS (SL-LPS: 50 pg/mL) or low-dose LPS (L-LPS: 50 ng/mL) in fresh complete medium once a day for 2~3 days and then cultured in fresh complete medium for 24 hr or 48 hr in the presence or absence of LPS (1~10 μg/mL) or concanavalin A (Con A). SL-LPS pretreatment strongly enhanced the LPS-induced production of tumor necrosis factor (TNF)-α, interleukin (IL)-6, TNF-α/IL-10, prostaglandin E2 (PGE2), and nitric oxide (NO) by RAW 264.7 cells compared to the control, whereas L-LPS increased IL-6 and NO production only. SL-LPS strongly augmented the Con A-induced ratios of interferon (IFN)-γ/IL-10 in EL4 cells but decreased the LPS-induced ratios of IFN-γ/IL-10 compared to the control, while L-LPS decreased the Con A- and LPS-induced ratios of IFN-γ/IL-10. SL-LPS enhanced the LPS-induced production of IL-6 by Hepa1c1c-7 cells compared to the control, while L-LPS increased IL-6 but decreased IL-1β and C reactive protein (CRP) levels. SL-LPS pretreatment strongly enhanced the LPS-induced production of TNF-α, IL-6, IL-10, PGE2, and NO in RAW 264.7 cells, and the IL-6, IL-1β, and CRP levels in Hepa1c1c-7 cells, as well as the ratios of IFN-γ/IL-10 in LPS- and Con A-stimulated EL4 cells compared to L-LPS. These findings suggest that pre-conditioning of SL-LPS may contribute to the mortality to secondary infection in sepsis rather than pre-conditioning of L-LPS.

Keywords: Acute-phase protein; Endotoxin pretreatment; Nitric oxide; Proinflammatory cytokines; Prostaglandin E2.


Figures

Fig. 1
Fig. 1
Effects of LPS pretreatment on the LPS-induced production of cytokines in RAW 264.7 cells. (A) Cytokines; (B) TNF-α/IL-10 ratio. RAW 264.7 cells were pretreated with concentrations of LPS 50 pg/mL (SL-LPS) or LPS 50 ng/mL (L-LPS) with refresh complete media once a day for 3ds consequently and the cells were then cultured for 24 hr with refresh complete media in the presence or absence of LPS (1 μg/mL). Concentration of cytokines was measured using ELISA. These experiments were run in tetraplicate and repeated at least twice. Each value represents the mean ± SE. *p < 0.05 and **p < 0.01. Significantly different from the value in each control. #p<0.05 and ##p < 0.01. Significantly different from the value in each SL-LPS.
Fig. 2
Fig. 2
Effects of LPS pretreatment on the LPS-induced production of PGE2 in RAW 264.7 cells. RAW 264.7 cells were pretreated with concentrations of LPS 50 pg/mL (SL-LPS) or LPS 50 ng/mL (L-LPS) with refresh complete media once a day for 3ds consequently and the cells were then cultured for 24 hr with refresh complete media in the presence or absence of LPS (1 μg/mL). These experiments were run in tetraplicate and repeated at least twice. Each value represents the mean ± SE. *p < 0.05 and **p < 0.01. Significantly different from the value in each control. #p < 0.05. Significantly different from the value in each SL-LPS.
Fig. 3
Fig. 3
Effects of LPS pretreatment on the LPS-induced production of NO in RAW 264.7 cells. RAW 264.7 cells were pretreated with concentrations of LPS 50 pg/mL (SL-LPS) or LPS 50 ng/mL (L-LPS) with refresh complete media once a day for 3ds consequently and the cells were then cultured for 24 hr with refresh complete media in the presence or absence of LPS (1 μg/mL). These experiments were run in tetraplicate and repeated at least twice. Each value represents the mean ± SE. *p < 0.05 and **p < 0.01. Significantly different from the value in each control. ##p < 0.01. Significantly different from the value in each SL-LPS.
Fig. 4
Fig. 4
Effects of LPS pretreatment on the Con A-induced production of cytokines in EL4 cells. (A) Cytokine; (B) IFN-γ/IL-10 ratio. EL4 cells were pretreated with concentrations of LPS 50 pg/mL or LPS 50 ng/mL in refresh complete media once a day for 3ds consequently and the cells were then cultured for 24 hr with refresh complete media in the presence or absence of Con A 10 μg/mL. These experiments were run in tetraplicate and repeated at least twice. Each value represents the mean ± SE. *p < 0.05 and **p < 0.01. Significantly different from the value in each vehicle. #p < 0.05. Significantly different from the value in positive control.
Fig. 5
Fig. 5
Effects of LPS pretreatment on the LPS-induced production of cytokines in EL4 cells. (A) Cytokine; (B) IFN-γ/IL-10 ratio. EL4 cells were pretreated with concentrations of LPS 50 pg/mL or LPS 50 ng/mL in refresh complete media per each day for 3ds consequently and the cells were then cultured for 24 hr with refresh complete media in the presence or absence of LPS (10 μg/mL). These experiments were run in tetraplicate and repeated at least twice. Each value represents the mean ± SE. *p < 0.05 and **p < 0.01. Significantly different from the value in each vehicle. #p < 0.05 and ##p < 0.01. Significantly different from the value in positive control.
Fig. 6
Fig. 6
Effects of LPS pretreatment on the LPS-induced production of cytokines and CRP in Hepa-1c1c7 cells. Hepa-1c1c7 cells were pretreated with LPS 50 pg/mL in fresh complete media once a day for 2 days and new Hepa-1c1c7 cells were pretreated with LPS 50 ng/mL once on only 2nd day. And then both of LPS-pretreated Hepa-1c1c7 cells were cultured in fresh complete media for 24 hr or 48 hr in the presence of LPS 10 μg/mL. These experiments were run in tetraplicate and repeated at least twice. Each value represents the mean ± SE. *p < 0.05 and **p < 0.01. Significantly different from the value in each positive control. #p < 0.05. Significantly different from the value in each SL-LPS.

References

    1. Alexander C, Rietschel ET. Bacterial lipopolysaccharides and innate immunity. J Endotoxin Res. 2001;7:167–202. - PubMed
    1. Patel PN, Shah RY, Ferguson JF, Reilly MP. Human experimental endotoxemia in modeling the pathophysiology, genomics, and therapeutics of innate immunity in complex cardiometabolic diseases. Arterioscler Thromb Vasc Biol. 2015;35:525–534. doi: 10.1161/ATVBAHA.114.304455. - DOI - PMC - PubMed
    1. Offenbacher S, Salvi GE. Induction of prostaglandin release from macrophages by bacterial endotoxin. Clin Infect Dis. 1999;28:505–513. doi: 10.1086/515177. - DOI - PubMed
    1. Kawai T, Akira S. Signaling to NF-kappaB by Toll-like receptors. Trends Mol Med. 2007;13:460–469. doi: 10.1016/j.molmed.2007.09.002. - DOI - PubMed
    1. Biswas SK, Lopez-Collazo E. Endotoxin tolerance: new mechanisms, molecules and clinical significance. Trends Immunol. 2009;30:475–487. doi: 10.1016/j.it.2009.07.009. - DOI - PubMed

LinkOut - more resources