. 2018 Apr 15;83(8):657-669.
doi: 10.1016/j.biopsych.2017.11.033. Epub 2017 Dec 7.

Thalamic Control of Cognition and Social Behavior Via Regulation of Gamma-Aminobutyric Acidergic Signaling and Excitation/Inhibition Balance in the Medial Prefrontal Cortex

Affiliations

Thalamic Control of Cognition and Social Behavior Via Regulation of Gamma-Aminobutyric Acidergic Signaling and Excitation/Inhibition Balance in the Medial Prefrontal Cortex

Brielle R Ferguson et al. Biol Psychiatry. .

Abstract

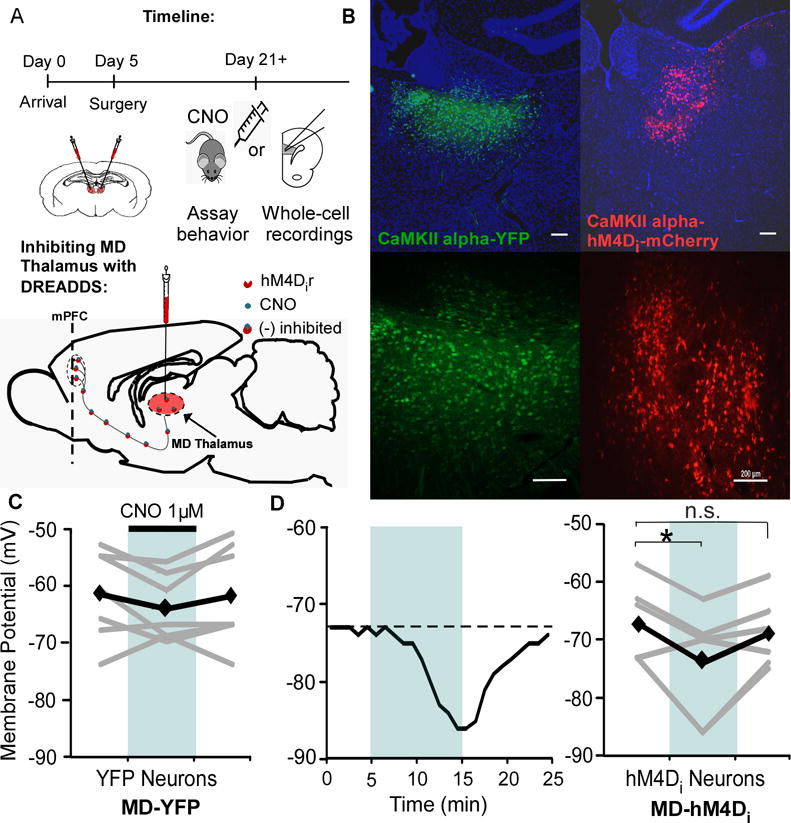
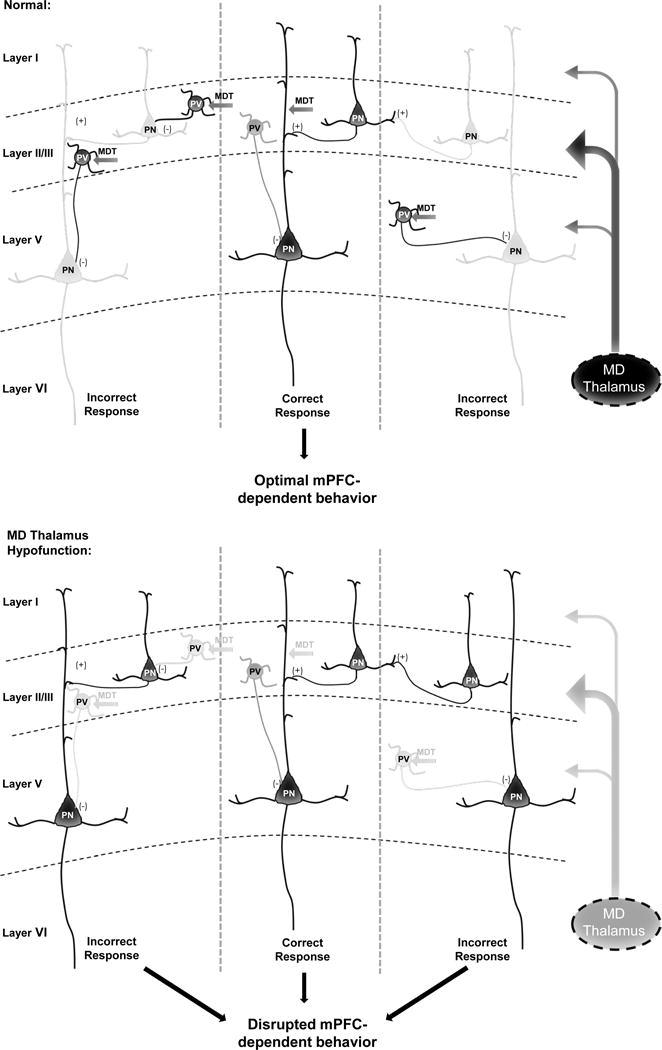
Background: The mediodorsal thalamus plays a critical role in cognition through its extensive innervation of the medial prefrontal cortex (mPFC), but how the two structures cooperate at the single-cell level to generate associated cognitive functions and other mPFC-dependent behaviors remains elusive. Maintaining the proper balance between excitation and inhibition (E/I balance) is of principal importance for organizing cortical activity. Furthermore, the PFC E/I balance has been implicated in successful execution of multiple PFC-dependent behaviors in both animal research and the context of human psychiatric disorders.

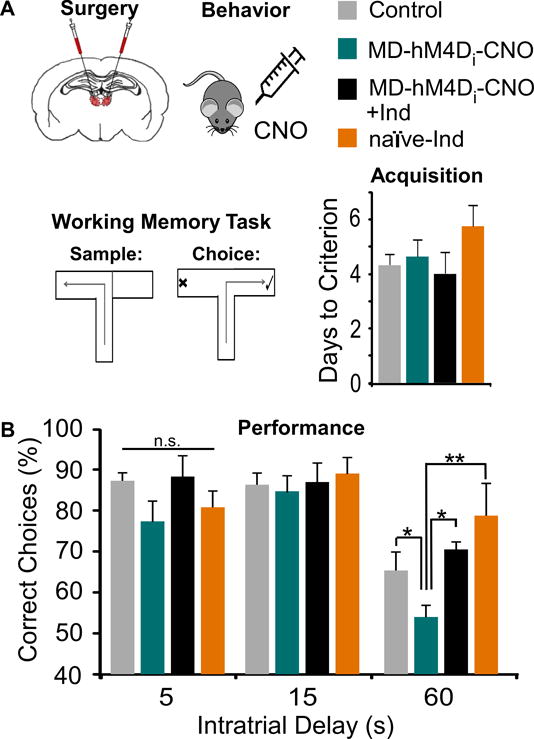
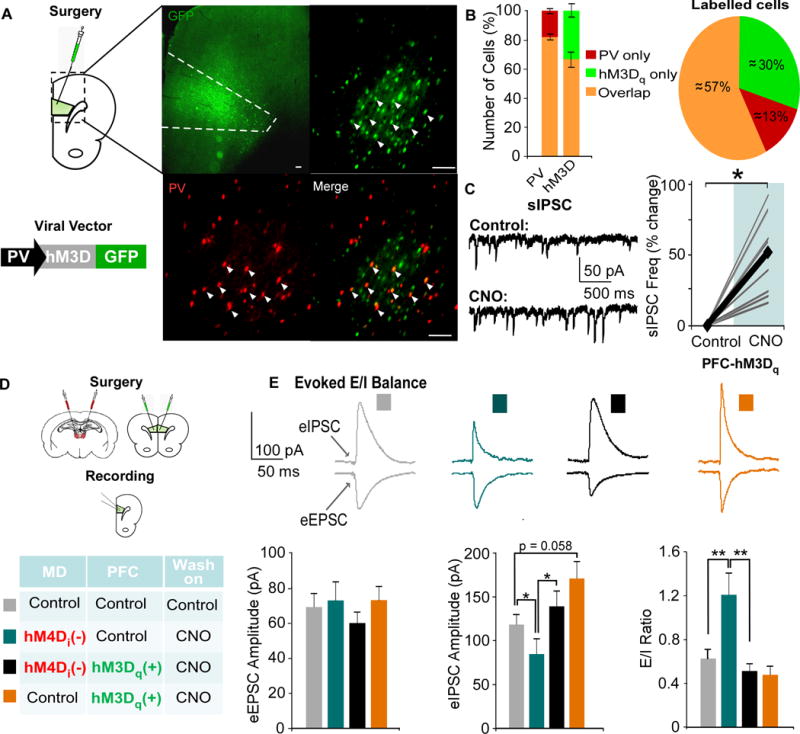
Methods: Here, we used a pharmacogenetic strategy to decrease mediodorsal thalamic activity in adult male rats and evaluated the consequences for E/I balance in PFC pyramidal neurons as well as cognition, social interaction, and anxiety.

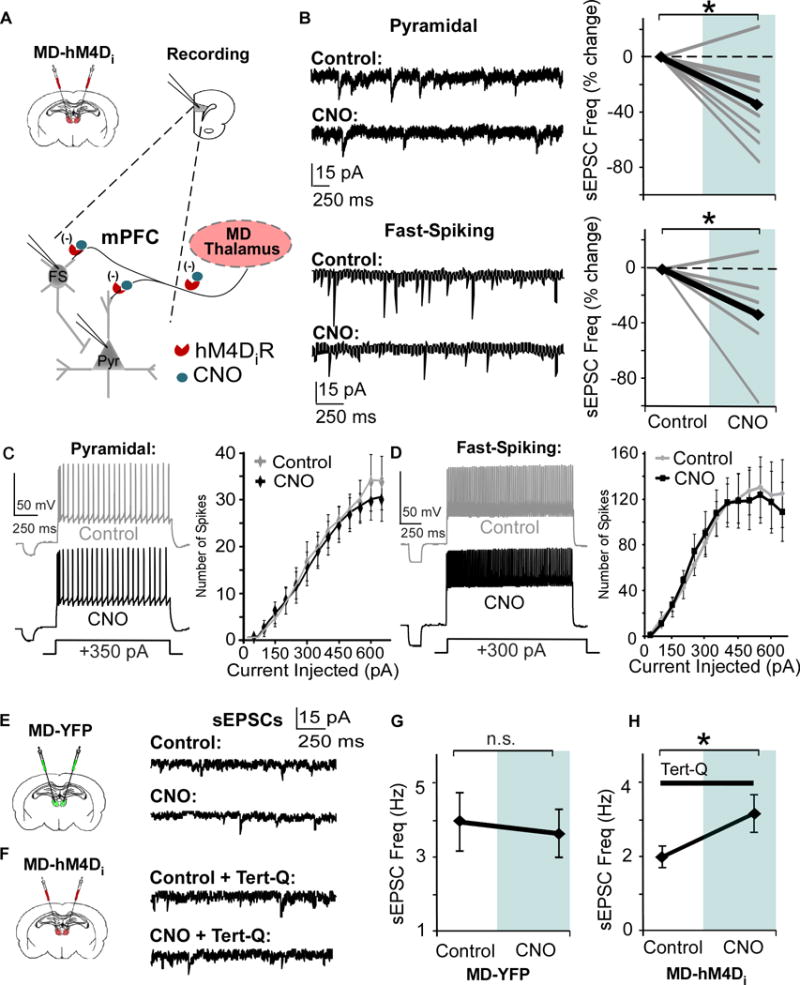
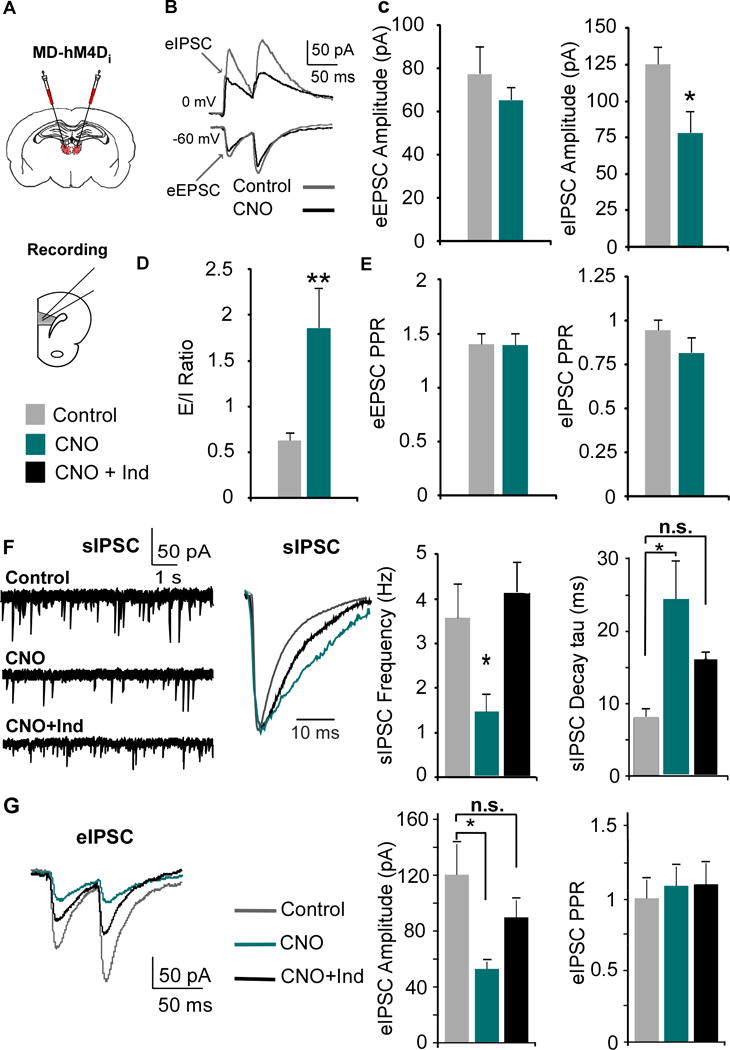
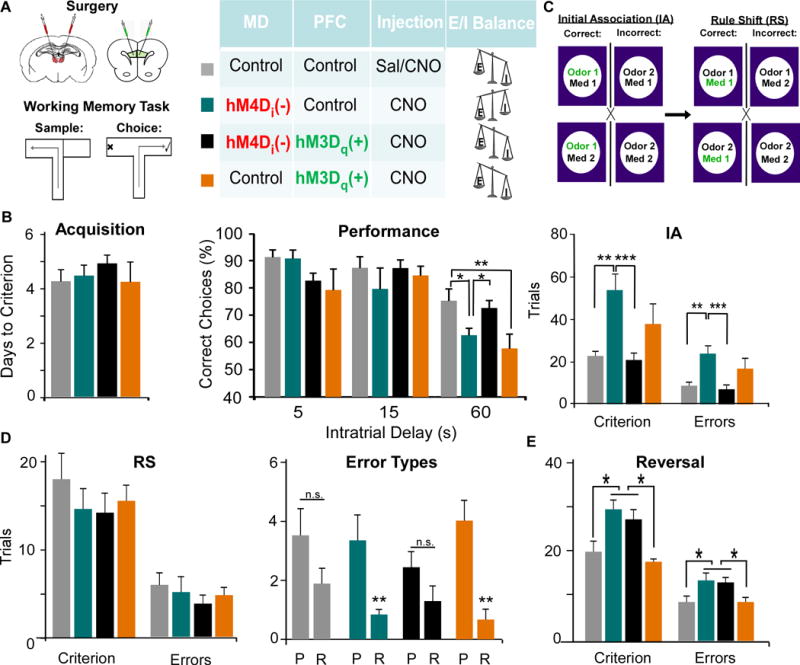
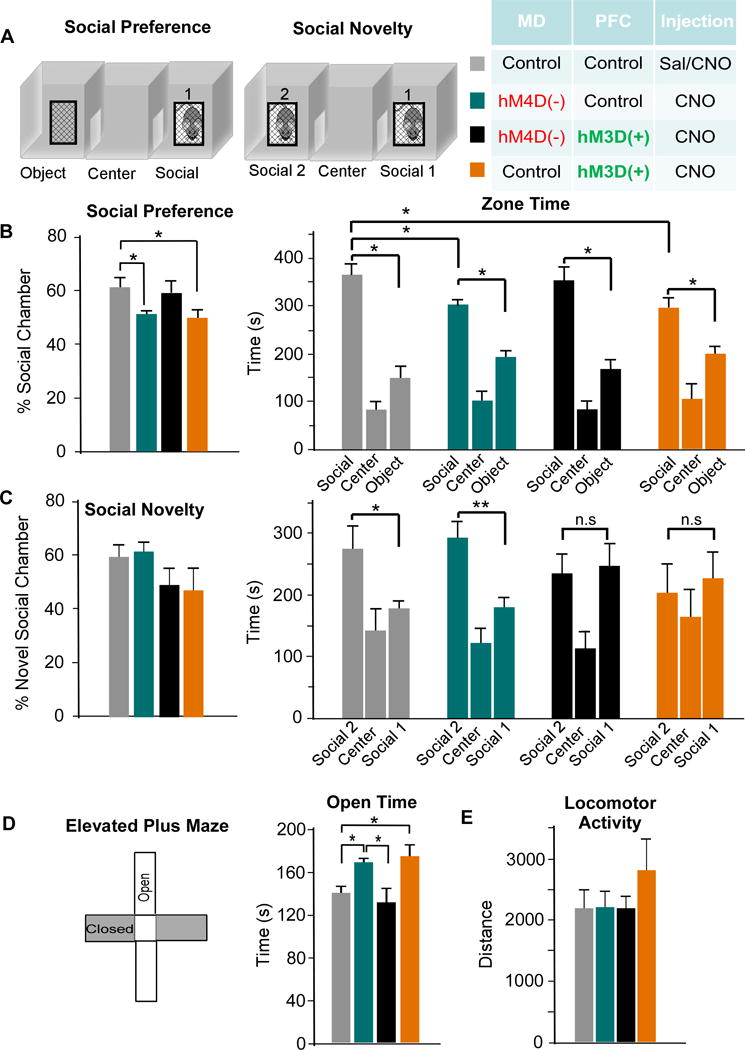
Results: We found that dampening mediodorsal thalamic activity caused significant reductions in gamma-aminobutyric acidergic signaling and increased E/I balance in the mPFC and was concomitant with abnormalities in these behaviors. Furthermore, by selectively activating parvalbumin interneurons in the mPFC with a novel pharmacogenetic approach, we restored gamma-aminobutyric acidergic signaling and E/I balance as well as ameliorated all behavioral impairments.

Conclusions: These findings underscore the importance of thalamocortical activation of mPFC gamma-aminobutyric acidergic interneurons in a broad range of mPFC-dependent behaviors. Furthermore, they highlight this circuitry as a platform for therapeutic investigation in psychiatric diseases that involve impairments in PFC-dependent behaviors.

Keywords: Cognition; GABAergic inhibition; PVIs; Pharmacogenetics; Prefrontal cortex; Synaptic function; Thalamus.


Conflict of interest statement

Conflict of Interests:

The authors declare no competing financial interests.

Figures

Figure 1
Figure 1. DREADD expression and function in the MD Thalamus
(A) Experimental timeline and schematic of viral injection and DREADD approach. (B) Expression of the control virus (AAV8-CaMKIIα-eYFP, left) and inhibitory DREADD virus (AAV8-CAMKIIα-hM4D(Gi)-mCherry, right) with DAPI staining in blue. Scale bar = 200 μm. (C) The membrane potential of YFP control cells in the MD did not change in response to 1 μM CNO bath application (1 μM, Rest = -61.7 ± 3.0 mV; CNO = -64.3 ± 2.2 mV; Washout = -62.0 ± 3.3 mV; paired t test, both p > 0.05; n = 7). Black represents average, while grey is individual cells. (D) Left, representative response of an hM4Di neuron to bath application of CNO. Right, CNO decreased the membrane potential of hM4Di neurons (Rest = -67.2 ± 2.8 mV; CNO = -74.0 ± 3.9 mV; paired t test, * p < 0.05; n = 7) that recovered following washout (Washout = -68.8 ± 2.5 mV; paired t test, p > 0.05).
Figure 2
Figure 2. Bath application of CNO in the mPFC reduces glutamate release from MD pre-synaptic terminals
(A) Strategy for decreasing thalamic activity by inhibiting MD terminals in the mPFC. Graphs show a bilateral injection of the CaMKIIα-hM4D-mCherry or CaMKIIα-eYFP virus and patch-clamp recording in mPFC slices. (B) Bath application of 1 μM CNO signficantly decreases sEPSC frequency in PNs and Fast-Spiking (FS) interneurons (Pyramidal, CNO = -34.8% ± 9.9; FS, CNO = -33.3% ± 12.7; paired t test, both * p < 0.05; pyramidal n = 9, FS n = 7, data shown as percent change from baseline). (C) and (D) Spike number in response to depolarizing current injections is not altered by CNO in both PNs and FS interneurons (Repeated Measures ANOVA for final three current injections, Pyramidal, Control = 8.3 ± 0.76 pA; CNO = 8.3 ± 0.91 pA; paired t test, p > 0.05; FS, Control = 18.3 ± 1.64 pA; CNO = 16.6 ± 1.64 pA; paired t test, p > 0.05; pyramidal cells n = 9, FS interneurons n = 9). (E) Left, animals received an injection of the control virus in the MD. Right, representative sEPSCs in mPFC pyramidal cells before and after bath application of CNO. (F) Left, animals received an injection of the hM4D virus in the MD. Right, representative sEPSCs in mPFC pyramidal cells before and after CNO, with Tert-Q (100 nM) included in the bath. (G) There was no difference in sEPSCs frequency before and after CNO in mPFC PNs in animals injected with the control virus in the MD (Control = 3.96 ± 0.79 Hz; CNO = 3.64 ± 0.66 Hz; paired t-test, p > 0.05). (H) Including tert-Q in the bath solution occludes the decrease in sEPSC frequency (B), and sEPSC frequency increases with CNO in mPFC PNs in animals injected with the hM4D virus in the MD (Control = 2.00 ± 0.29 Hz; CNO = 3.17 ± 0.51 Hz; paired t-test, p > 0.05).
Figure 3
Figure 3. MD inhibition alters mPFC E/I ratio by decreasing GABAergic signaling, which is rescued by indiplon
(A) The MD was transfected with the inhibitory CaMKIIα-hM4D-mCherry virus, and mPFC slices were collected for recordings three weeks post-injection. (B) EPSCS and IPSCS were evoked by stimulating layer II/III with paired pulses. (C) The eIPSC, but not eEPSC, amplitude was significantly decreased by CNO (EPSC: Control = 77.58 ± 12.82 pA; CNO = 65.18 ± 5.87 pA; Student’s t test, * p < 0.05; Control n = 11, CNO n = 10; IPSC: Control = 125.3 ± 12.23 pA; CNO = 77.9 ± 15.05 pA; Student’s t test, p < 0.05). (D) Decreasing MD activity increases the E/I ratio (eEPSC/eIPSC amplitude, Control = 0.63 ± 0.08; CNO = 1.86 ± 0.43; Mann-Whitney test, ** p < 0.01). (E) There were no changes in the PPR (amplitude of the second over the first pulse) in either the eEPSC or eIPSC (Student’s t-test, both p > 0.05). (F) The sIPSC frequency was decreased by CNO and rescued by co-application with Indiplon (1 μM, Control = 3.61 ± 0.73 Hz; CNO = 1.49 ± 0.36 Hz; CNO + Ind = 4.13 ± 0.63 Hz; ANOVA followed by Tukey’s post hoc, F(2,25) = 6.004, * p < 0.05; n = 10 and 8 for Control and CNO resprectively). CNO also increased the average decay of the sIPSCs which was partially rescued by Indiplon (tau; sIPSCs: Control = 7.912 ± 1.26 ms; CNO = 24.50 ± 5.04 ms; CNO + Ind = 15.97 ± 1.90 ms; ANOVA followed by Tukey’s post hoc, F(2,24) = 8.91, ** p < 0.01). (G) Indiplon rescued the decreased evoked IPSC amplitude following CNO administration (Control = 120.3 ± 22.0 pA; CNO = 53.0 ± 5.08 pA; CNO + Ind = 89.8 ± 12.1 pA; ANOVA followed by Tukey’s post hoc, F(2,27) = 5.18, group effect p = 0.012, * p < 0.05; Control n = 10, CNO n = 10, CNO + Ind = 10).
Figure 4
Figure 4. WM impairment induced by MD inhibition is rescued by the GABAergic PAM, indiplon
(A) Animals received a bilateral transfection of the MD were treated systemically with Saline, CNO, indiplon, or CNO+indiplon, and were tested on a T-maze task. There were no differences in days required to acquire the task (ANOVA, F(3,29) = 1.134, p > 0.05; Control n = 11, MD-hM4Di-CNO n = 5, MD-hM4Di-CNO+Ind n = 6, naïve-Ind n = 4). (B) MD inhibition (MD-hM4Di-CNO) impaired WM at the 60, but not 5 and 15, second delay interval. This deficit was ameliorated by treating rats with indiplon (MD-hM4Di-CNO+Ind), whereas indiplon alone (naïve-Ind) did not disrupt performance (Repeated Measures ANOVA followed by Tukey’s post hoc, F(3,20) = 3.55, * p < 0.05, ** p < 0.01).
Figure 5
Figure 5. Pharmacogenetic activation of PVIs rescues E/I ratio
(A) Animals received an injection of the excitatory PV-hM3Dq-GFP vector in the mPFC. Co-staining with a PV-antibody (red) revealed colocalization (orange, arrowhead) with the PV-hM3Dq -GFP vector (primary: rabbit anti-PV, 1:2,000, Abcam; secondary: DyLight 594-conjugated goat Anti-Rabbit, 1:500, JacksonImmuno Laboratories). (B) Cells were counted, and the amount of PV, hM3Dq, and overlapping cells were quantified. (C) PNs exhibited a signficant increase in sIPSC frequency following bath application of CNO (Control = 4.99 ± 1.70Hz, CNO = 6.73 ± 1.99 Hz; an average of over 50% increase, paired t-test, * p < 0.05; n = 10; data shown as percent change from baseline). (D) Animals received a bilateral transfection of the MD and mPFC with the combinations designated in the table. (E) Single pulses were delivered to layer II/III to evoke EPSCs and IPSCs in each group. The eIPSC amplitude was significantly decreased by inhibiting MD activity (teal), and this was restored by activating PVIs (black, Kruskal Wallis Test followed by post hoc analyses, x2(3) = 11.332, * p < 0.05, ** p < 0.01; MD-Con-PFC-Con n = 15, MD-hM4D-PFC-Con n = 15, MD-hM4D-PFC-hM3D n = 19, MD-Con-PFC-hM3D n = 13). MD inhibition alone (orange, MD-Con-PFC-hM3D also increased the E/I ratio, which was rescued by activating mPFC PVIs (MD-hM4D-PFC-hM3D, Kruskal Wallis Test, x2(3) = 10.438, *p < 0.05, ** p < 0.01, *** p < 0.001).
Figure 6
Figure 6. The MD regulates WM and select components of cognitive flexibility through modulation of PVIs in the mPFC
(A) Rats received a bilateral injection of viruses in the MD and mPFC with the viral combinations designated in the diagram. (B) MD inhibition (teal) impaired WM at the 60 second delay interval, and this was rescued by activation of PVIs (black), while activation of PVIs alone (orange) impaired performance (ANOVA followed by Dunnet’s post hoc test, F(3,24) = 4.493, * p < 0.05, ** p < 0.01, MD-Con-PFC-Con n = 9, MD-hM4D-PFC-Con n = 7, MD-hM4D-PFC-hM3D n = 8, MD-Con-PFC-hM3D n = 5). (C) Animals were trained to discriminate between scents and digging mediums to obtain a food reward. MD-hM4D-PFC-Con rats were impaired at learning the initial association (IA), and made more errors, but this was rescued by mPFC PVI activation MD-hM4D-PFC-hM3D. Activating PVIs alone MD-Con-PFC-hM3D increased Trials to Criterion and Errors. (Trials to Criterion: ANOVA followed by Tukey’s post hoc, F(3,24) = 6.861; Errors: ANOVA followed by Tukey’s post hoc, F(3,24) = 6.542, ** p < 0.01, *** p < 0.001, MD-Con-PFC-Con n = 8, MD-hM4D-PFC-Con, n = 7, MD-hM4D-PFC-hM3D, n = 7, MD-Con-PFC-hM3D, n = 6). (D) There was no difference in trials to criterion, when all errors were pooled (ANOVA, Criterion F(3,24) = 0.632, Errors F(3,24) = 0.462). Only MD-hM4D-PFC-Con and MD-Con-PFC-hM3D groups exhibited an increase in perseverative compared to random errors (Mann Whitney Test, ** p < 0.01). (E) There was an increase in trials to criterion and errors during the reversal following MD inhibition, that was not rescued by mPFC PVI activation (Trials to Criterion: ANOVA, F(3,17) = 4.720; Errors: ANOVA, F(3,17) = 4.947 *p < 0.05, MD-Con-PFC-Con n = 4, MD-hM4D-PFC-Con n = 7, MD-hM4D-PFC-hM3D n = 10, MD-Con-PFC-hM3D n = 5).
Figure 7
Figure 7. The MD thalamus regulates social interaction and anxiety behavior through modulation of PVIs in the mPFC
(A) Rats were tested on the three-chamber sociability task. During the social preference portion, zone time was measured in the object, center, and social chamber. For social novelty. Rats were exposed to a novel rat, and time in each zone was measured. (B) MD inhibition (teal) reduced the social preference due to decreased time spent in the social zone. This was rescued by activation of PVIs (black), while activation of PVIs alone (orange) also disrupted social preference (ANOVA, F(3,24) = 2.132 * p < 0.05, MD-Con-PFC-Con n = 6, MD-hM4D-PFC-Con n = 7, MD-hM4D-PFC-hM3D n = 9, MD-Con-PFC-hM3D n = 5). (C) There was no difference in the percent time spent in the novel social chamber (ANOVA, F(3,24) = 1.502, p > 0.05). In comparison to the control group, MD-Con-PFC-Con, MD inhibition group, MD-hM4D-PFC-Con, showed a similar preference in zone time for the novel rat chamber (* p < 0.05). However, this zone time preference was absent in MD-hM4D-PFC-hM3D and MD-Con-PFC-hM3D- rats. (D) Left, rats were tested on elevated plus maze and time spent in open arms was quantified. Right, MD inhibition, MD-hM4D-PFC-Con, and activation of PVIs, MD-Con-PFC-hM3D, showed a similar increase in open time compared to controls, MD-Con-PFC-Con (ANOVA, F(3,25) = 3.079 * p < 0.05), while combined MD inhibition and PVI activation, MD-hM4D-PFC-hM3D, normalized this phenotype. (E) There were no differences in locomotor activity across all groups (ANOVA, F(3,26) = 0.892 p > 0.05).
Figure 8
Figure 8. MD thalamus regulates mPFC E/I balance to impact cognition
Under normal conditions, the MD thalamus provides a stronger drive to Layer II/III PVIs vs. PNs in the mPFC to maintain a high level of inhibition relative to excitation in Layer V PNs. Potentially, this allows for lateral inhibition of functional microcolumnar units representing distracting information, such that only relevant information is fed forward to optimize behaviors such as WM, cognitive flexibility, and social interaction. However, based on our findings, when MD activity is decreased, activation of PVIs by MD afferents is removed, leading to disinhibition of neurons in microcolumns representing distracting or irrelevant information, and disrupting behavior. Dark grey and black represent high levels of activity, versus the light grey that indicates reduced or low activity. This working model is based on our data and known projections of the MD and connectivity in the mPFC (10, 11, 21, 22).

Comment in

References

    1. Guillery RW, Sherman SM. Thalamic relay functions and their role in corticocortical communication: generalizations from the visual system. Neuron. 2002;33:163–175. - PubMed
    1. Bolkan SS, Stujenske JM, Parnaudeau S, Spellman TJ, Rauffenbart C, Abbas AI, et al. Thalamic projections sustain prefrontal activity during working memory maintenance. Nat Neurosci 2017 - PMC - PubMed
    1. Wimmer RD, Schmitt LI, Davidson TJ, Nakajima M, Deisseroth K, Halassa MM. Thalamic control of sensory selection in divided attention. Nature. 2015;526:705–709. - PMC - PubMed
    1. Schmitt LI, Wimmer RD, Nakajima M, Happ M, Mofakham S, Halassa MM. Thalamic amplification of cortical connectivity sustains attentional control. Nature. 2017;545:219–223. - PMC - PubMed
    1. Opris I, Santos L, Gerhardt GA, Song D, Berger TW, Hampson RE, et al. Prefrontal cortical microcircuits bind perception to executive control. Scientific reports. 2013;3:2285. - PMC - PubMed

Publication types

MeSH terms