

IgA and IgG against Mycobacterium tuberculosis Rv2031 discriminate between pulmonary tuberculosis patients, Mycobacterium tuberculosis-infected and non-infected individuals
- PMID: 29373577
- PMCID: PMC5786301
- DOI: 10.1371/journal.pone.0190989
IgA and IgG against Mycobacterium tuberculosis Rv2031 discriminate between pulmonary tuberculosis patients, Mycobacterium tuberculosis-infected and non-infected individuals
Abstract
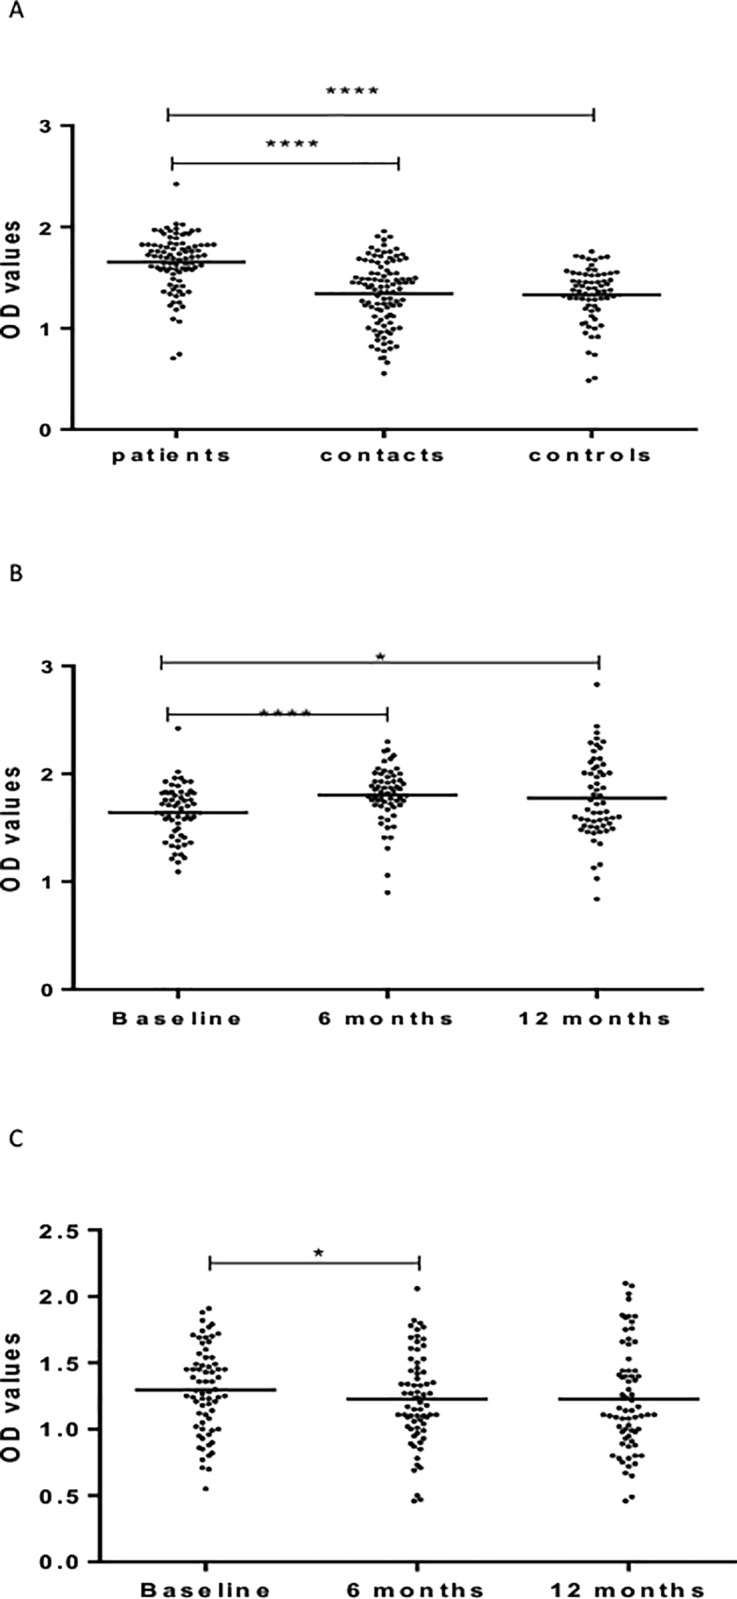
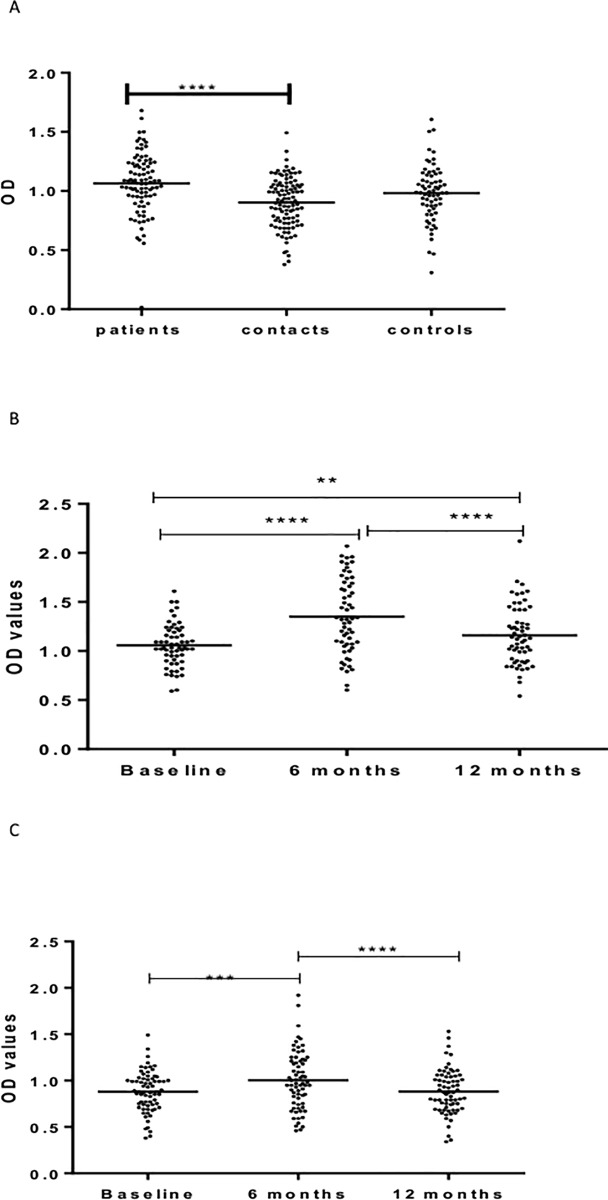
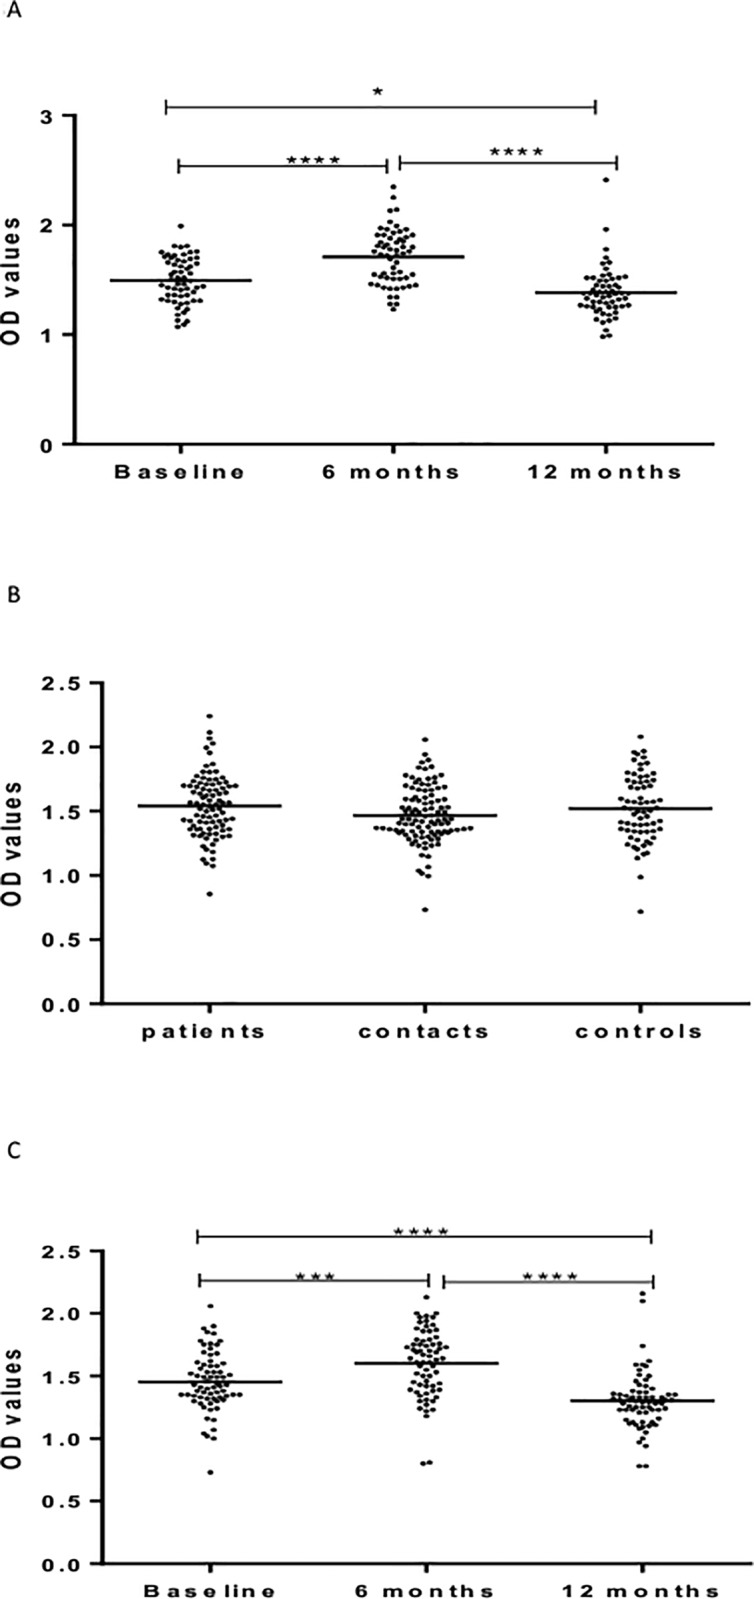
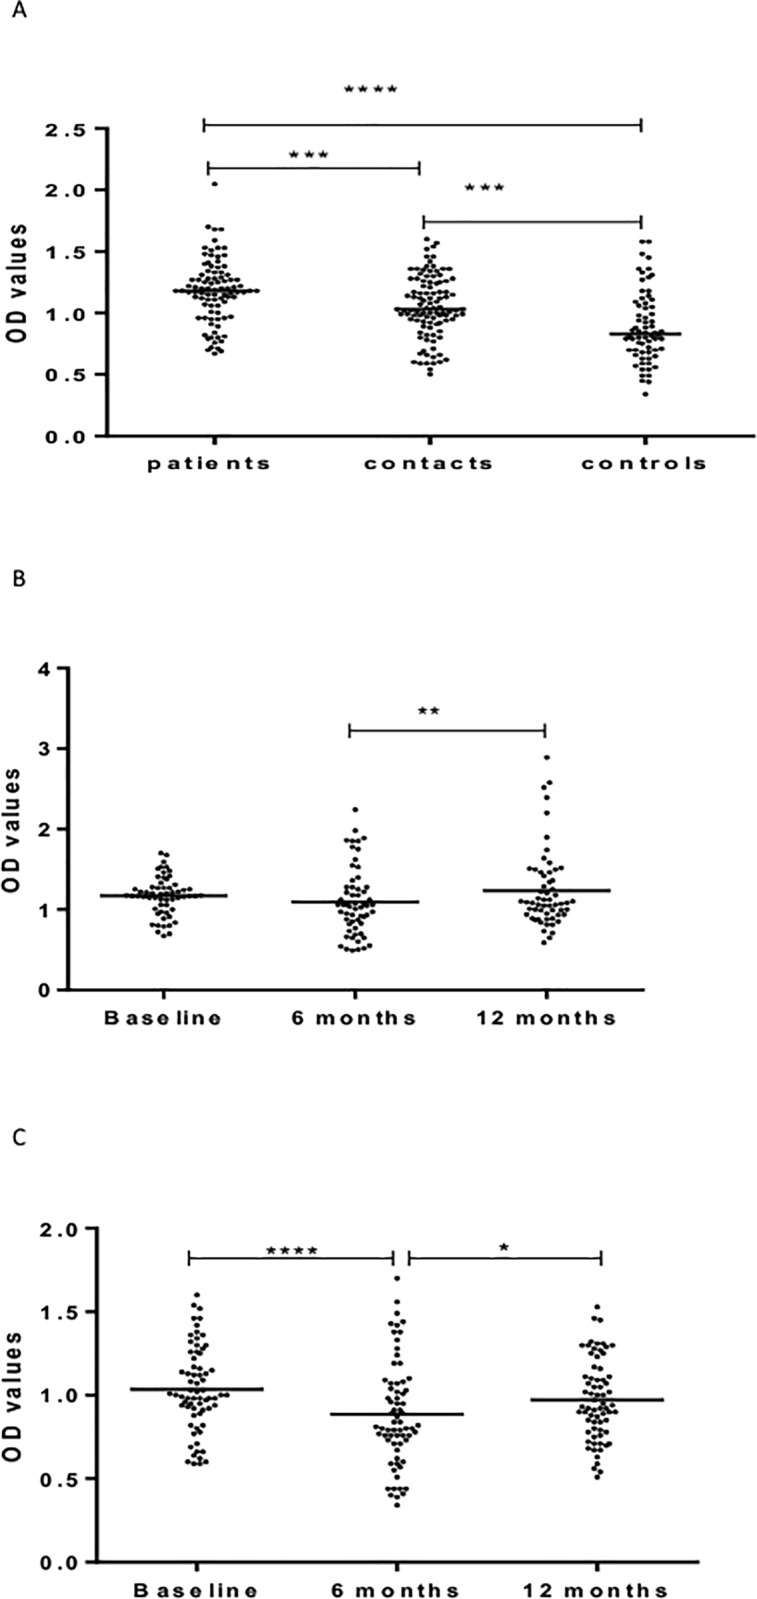
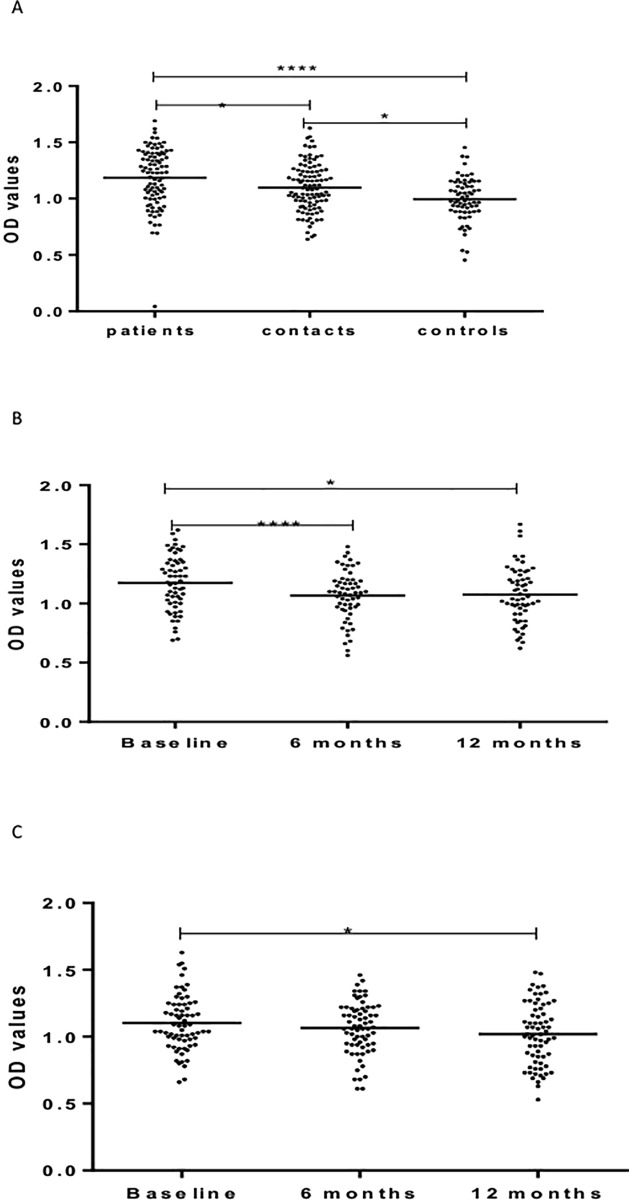
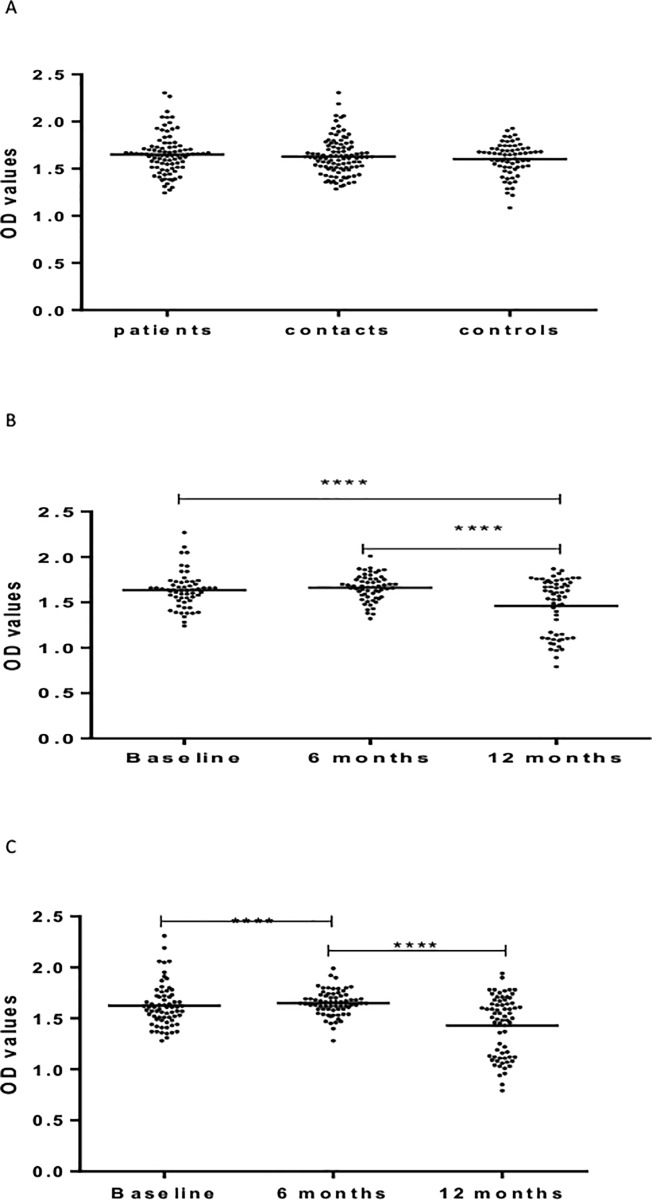
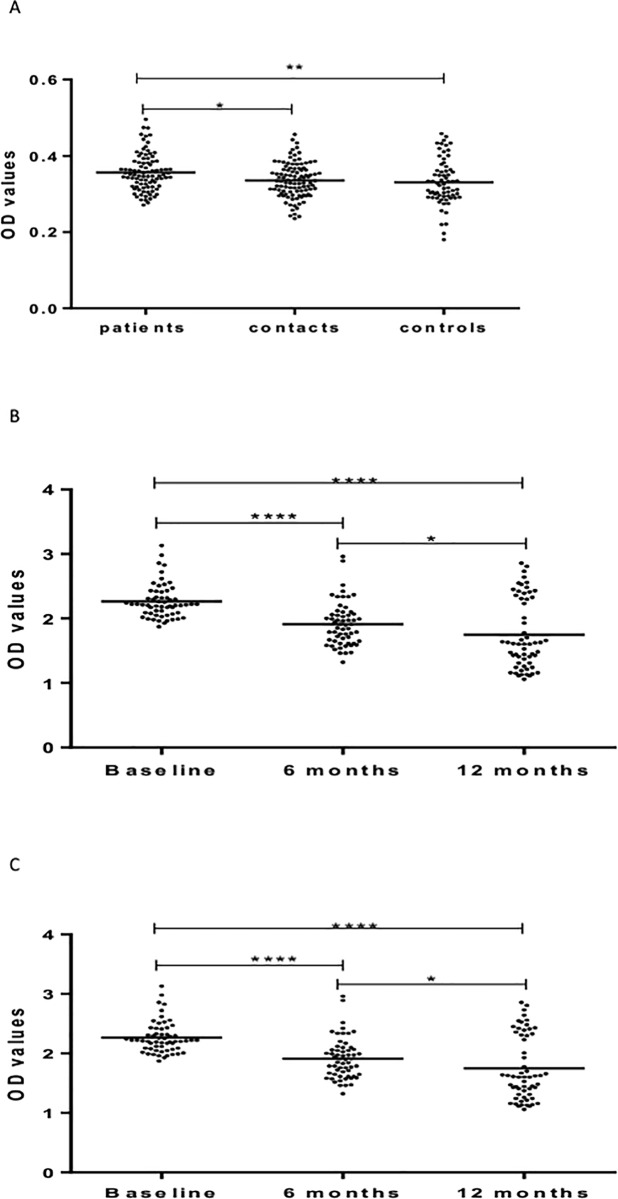
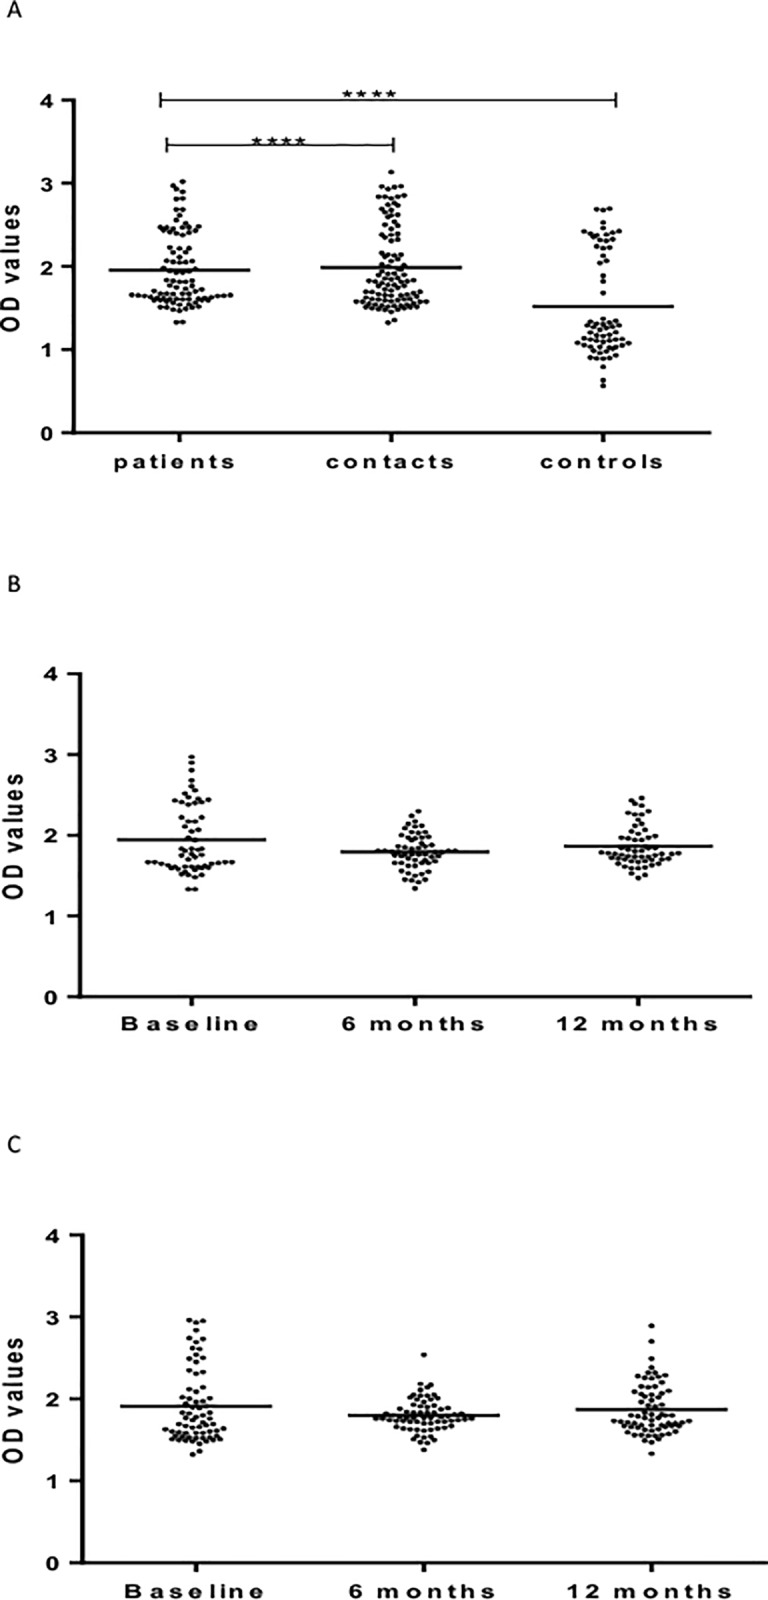
As part of a major project to investigate protective and diagnostic immune markers against tuberculosis (TB), we measured antibody isotype responses to Mycobacterium tuberculosis (Mtb) antigens (LAM, Rv2031, and HBHA) in cohorts of 149 pulmonary tuberculosis patients (PTBP), 148 household contacts (HHCs), and 68 community controls (CCs) in an endemic setting. ELISA was used to measure levels of IgA, IgG, and IgM from sera of cohorts at baseline, and at 6 and 12 months from entry. The results show that there were significant differences in IgA, IgG, and IgM responses to the different antigens and in the three cohorts. At baseline, the level of IgM against RV2031 and LAM did not vary between cohorts, but the levels of IgA and IgG against Rv2031 were significantly higher in PTB patients than HHCs and CCs, followed by HHCs, and the lowest in CCs. In patients, there was a significant variation in antibody responses before and after chemotherapy. The levels of IgA and IgG against HBHA, and IgA against Rv2031 decreased significantly and remained low, while IgA and IgG against LAM increased significantly and remained high following chemotherapy. However, the levels of IgM against Rv2031 and LAM increased at 6 months but decreased again at 12 months. IgM against HBHA did not show any significant variation before and after chemotherapy. Similarly, there were also significant variations in antibody responses in HHCs over time. Our results show that there are significant variations in IgA, IgG and IgM responses to the different antigens and in the three cohorts, implying that not all antibody isotype responses are markers of clinical TB. In addition, the current and previous studies consistently show that IgA and IgG against Rv2031 discriminate between clinical disease, Mtb-infected and non-infected individuals.
Conflict of interest statement
Figures
References
-
- WHO. Global Tuberculosis Report 2016. WHO, Geneva; 2016
-
- Kaufmann SHE, Weiner J, von Reyn CF. Novel approaches to tuberculosis vaccine development. Int J Infect dis 2017; 56: 263–267. doi: 10.1016/j.ijid.2016.10.018 - DOI - PubMed
-
- Kaufmann SHE, Fortune S, Pepponi H, Ruwald M, Schrager LK, Ottenhoff TMH. TB biomarkers, TB correlates and human challenge models: New tools for improving assessment of new TB vaccines. Tuberculosis 2016; 99: S8–S11. doi: 10.1016/j.tube.2016.05.010 - DOI - PubMed
-
- Chegou NN, Essone PN, Loxton AG, Stanley K, Black GF, van der Spuy GD et al. potential of host markers produced by infection phase-dependent antigen-stimulated cells for diagnosis of tuberculosis in a highly endemic area. Plos One 2012;7(8). doi: 10.1371/journal.pone.0038501 - DOI - PMC - PubMed
-
- Abebe F. Is interferon-gamma the right marker for bacilli-Calmette-Guerin-induced immune protection? The missing link in our understanding of tuberculosis immunology. Clin Exp Immunol 2012; 169 (3):213–219. doi: 10.1111/j.1365-2249.2012.04614.x - DOI - PMC - PubMed
Publication types
MeSH terms
Substances
LinkOut - more resources
Full Text Sources
Other Literature Sources
Research Materials
Miscellaneous
