

Risk preferences impose a hidden distortion on measures of choice impulsivity
- PMID: 29373590
- PMCID: PMC5786295
- DOI: 10.1371/journal.pone.0191357
Risk preferences impose a hidden distortion on measures of choice impulsivity
Abstract
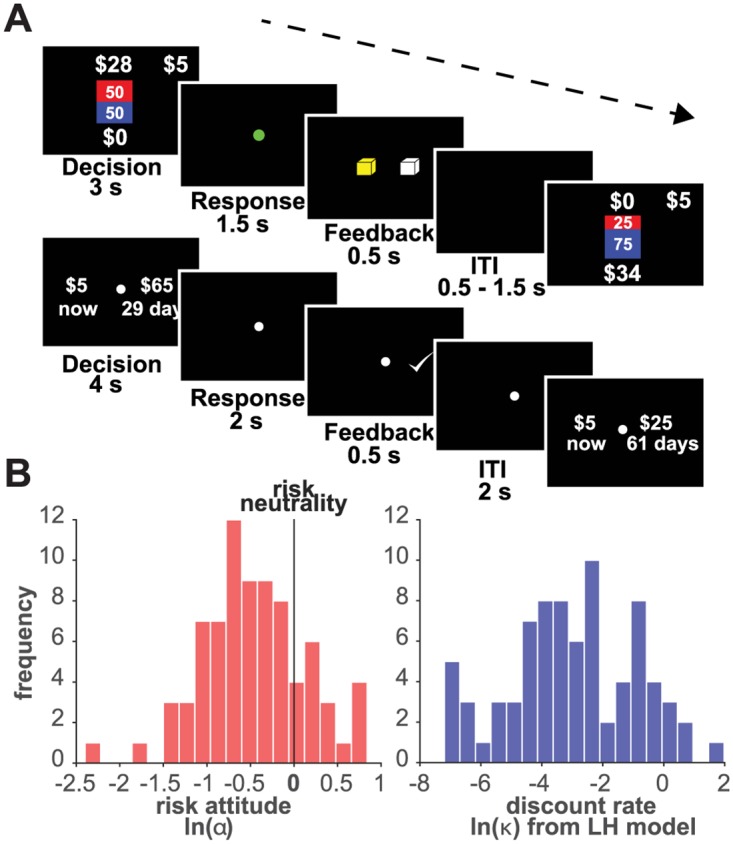
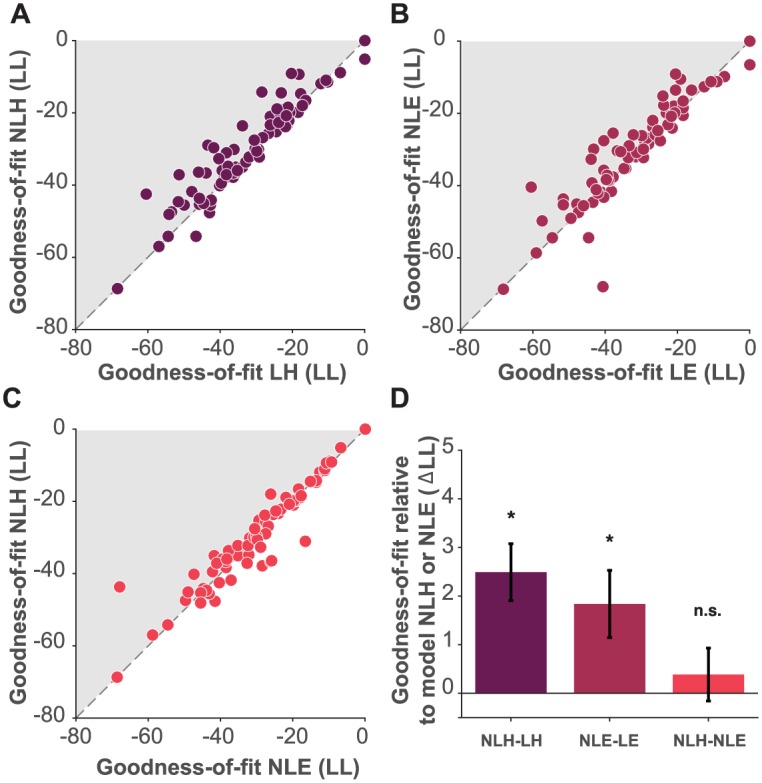
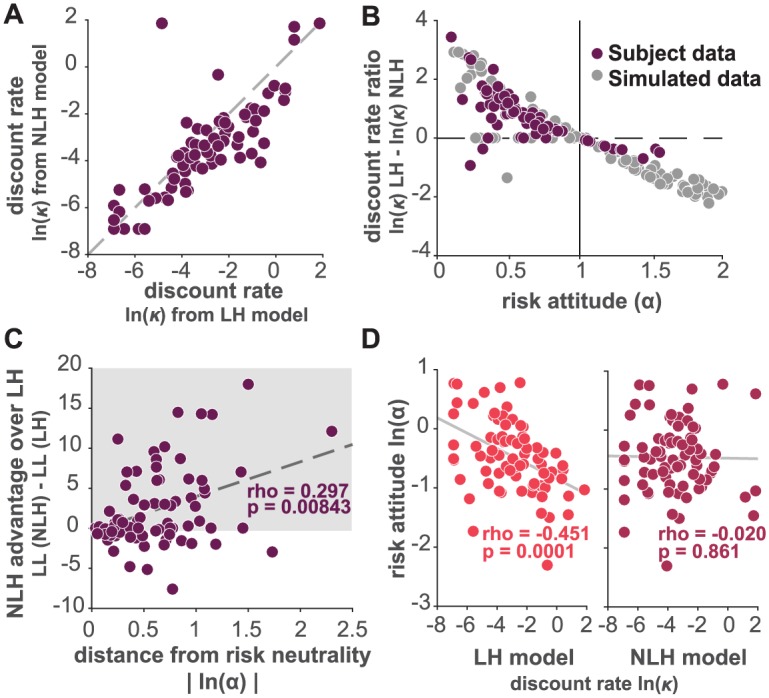
Measuring temporal discounting through the use of intertemporal choice tasks is now the gold standard method for quantifying human choice impulsivity (impatience) in neuroscience, psychology, behavioral economics, public health and computational psychiatry. A recent area of growing interest is individual differences in discounting levels, as these may predispose to (or protect from) mental health disorders, addictive behaviors, and other diseases. At the same time, more and more studies have been dedicated to the quantification of individual attitudes towards risk, which have been measured in many clinical and non-clinical populations using closely related techniques. Economists have pointed to interactions between measurements of time preferences and risk preferences that may distort estimations of the discount rate. However, although becoming standard practice in economics, discount rates and risk preferences are rarely measured simultaneously in the same subjects in other fields, and the magnitude of the imposed distortion is unknown in the assessment of individual differences. Here, we show that standard models of temporal discounting -such as a hyperbolic discounting model widely present in the literature which fails to account for risk attitudes in the estimation of discount rates- result in a large and systematic pattern of bias in estimated discounting parameters. This can lead to the spurious attribution of differences in impulsivity between individuals when in fact differences in risk attitudes account for observed behavioral differences. We advance a model which, when applied to standard choice tasks typically used in psychology and neuroscience, provides both a better fit to the data and successfully de-correlates risk and impulsivity parameters. This results in measures that are more accurate and thus of greater utility to the many fields interested in individual differences in impulsivity.
Conflict of interest statement
Figures
References
-
- Myerson J, Green L. Discounting of delayed rewards: Models of individual choice. Journal of the Experimental Analysis of Behavior. 1995;64(3):263–276. doi: 10.1901/jeab.1995.64-263 - DOI - PMC - PubMed
-
- Benhabib J, Bisin A, Schotter A. Present-bias, quasi-hyperbolic discounting, and fixed costs. Games and Economic Behavior. 2010;69(2):205–223. doi: 10.1016/j.geb.2009.11.003 - DOI
-
- Green L, Fristoe N, Myerson J. Temporal discounting and preference reversals in choice between delayed outcomes. Psychonomic Bulletin & Review. 1994;1(3):383–389. doi: 10.3758/BF03213979 - DOI - PubMed
-
- Baumann AA, Odum AL. Impulsivity, risk taking, and timing. Behav Processes. 2012;90(3):408–14. doi: 10.1016/j.beproc.2012.04.005 - DOI - PMC - PubMed
-
- Stevens JR. The Many Faces of Impulsivity In: Impulsivity. Nebraska Symposium on Motivation. Springer, Cham; 2017. p. 1–6. Available from: https://link.springer.com/chapter/10.1007/978-3-319-51721-6_1 - DOI - PubMed
Publication types
MeSH terms
Associated data
Grants and funding
LinkOut - more resources
Full Text Sources
Other Literature Sources
