. 2019 Feb 1;29(2):732-750.
doi: 10.1093/cercor/bhx355.

On the Neural and Mechanistic Bases of Self-Control

Affiliations

On the Neural and Mechanistic Bases of Self-Control

Brandon M Turner et al. Cereb Cortex. .

Abstract

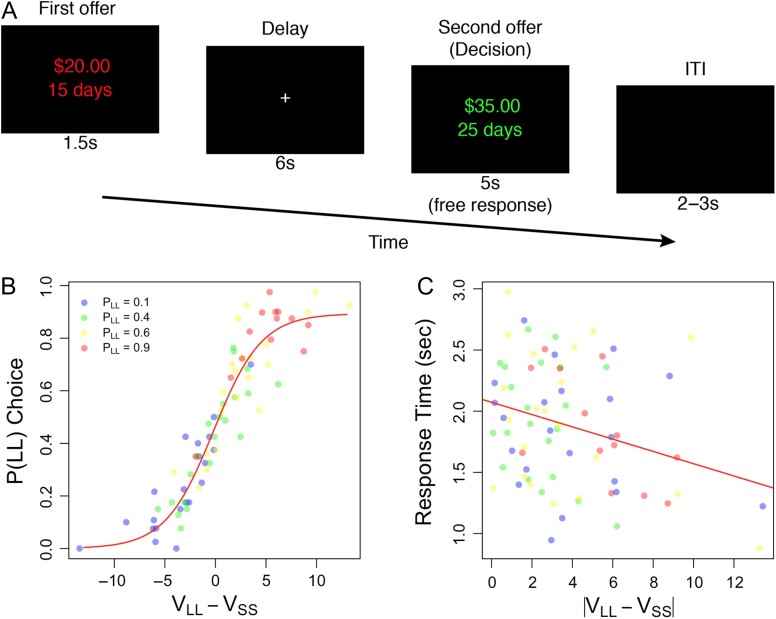
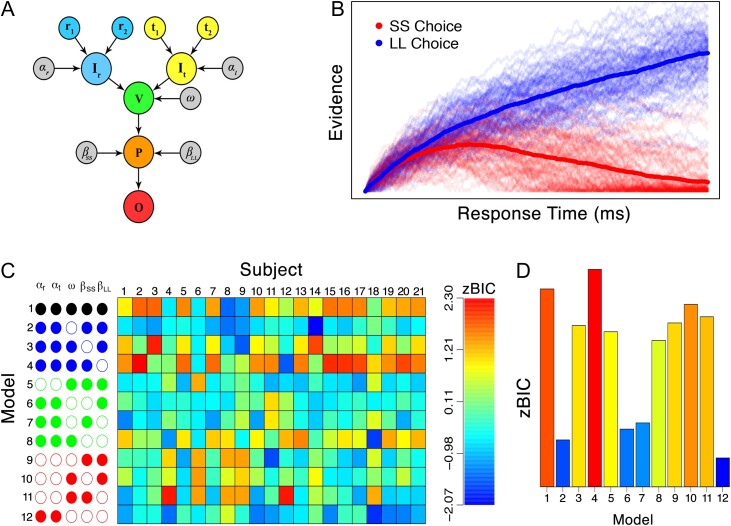
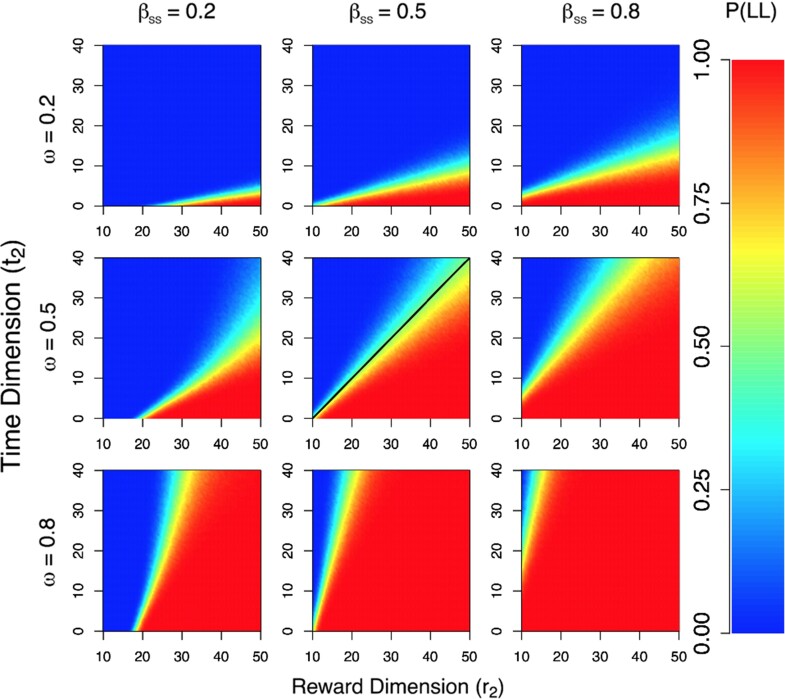
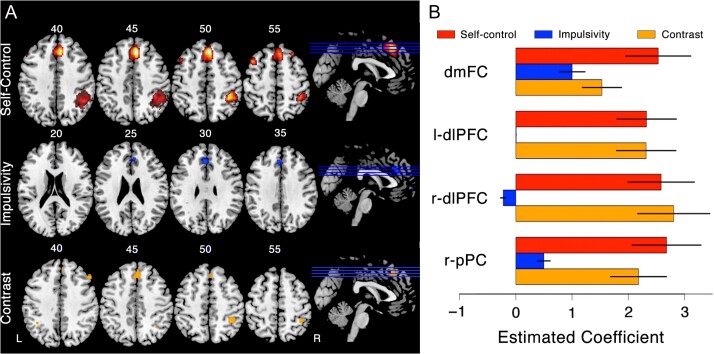
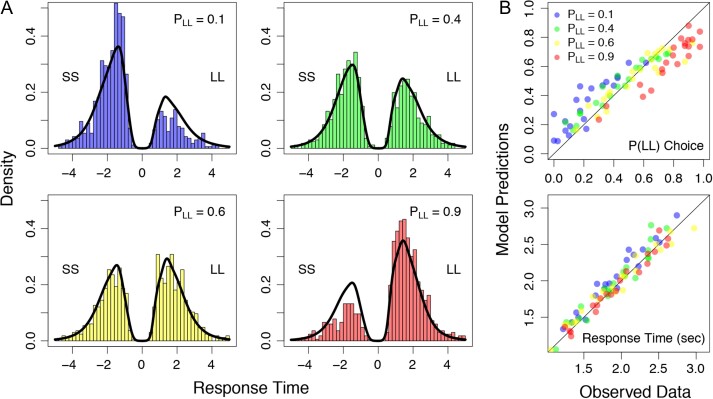
Intertemporal choice requires a dynamic interaction between valuation and deliberation processes. While evidence identifying candidate brain areas for each of these processes is well established, the precise mechanistic role carried out by each brain region is still debated. In this article, we present a computational model that clarifies the unique contribution of frontoparietal cortex regions to intertemporal decision making. The model we develop samples reward and delay information stochastically on a moment-by-moment basis. As preference for the choice alternatives evolves, dynamic inhibitory processes are executed by way of asymmetric lateral inhibition. We find that it is these lateral inhibition processes that best explain the contribution of frontoparietal regions to intertemporal decision making exhibited in our data.


Figures

Figure 1.
Figure 1.
Experimental design and results. (A) Offer pairs were presented sequentially. The first offer was presented in red and remained on screen for 1.5 s. After a 6 s delay, a second reward was presented in green. In half of trials the first offer presented a smaller and more immediate reward. The other half presented a larger but more delayed reward. The probability of choosing the larger reward was estimated to be 0.1, 0,4, 0.6, or 0.9, using decision parameters obtained from a staircase procedure completed outside the fMRI scanner. (B) Choice probabilities during the fMRI experiment were symmetrically distributed around indifference (i.e., VLLVSS), and varied systematically with valuation. (C) Response times decrease with increases in valuation differences demonstrating that response times become faster as choice difficulty is reduced.
Figure 2.
Figure 2.
Details of the model and fitting results. (A) The model takes as inputs information about the rewards (i.e., r1 and r2; blue nodes) and time delays (i.e., t1 and t2; yellow nodes), and converts these inputs to a subjective representation (i.e., Ir and It, respectively) through with parameters αr and αt. Features are selected with the parameter ω (i.e., the green node). Deliberation among the SS and LL alternatives is modulated by lateral inhibition parameters βSS and βLL (i.e., the orange node). Once an accumulator reaches a threshold amount of preference, a decision is made corresponding to the winning accumulator (i.e., the red node). (B) Example of how the model implements self-control-like behavior through lateral inhibition (βSS=0.2 and βLL=0.1) and not valuation (Ir=It=0.5). (C) Model fitting results in terms of a z-transformed BIC statistic separated by model constraint (rows) and subjects (columns), color coded according to the legend on the right. Empty circles indicate that a parameter was free to vary, whereas filled nodes indicate that a parameter was fixed. The model structures are grouped by the number of free parameters: black, blue, green and red indicate that a total of 3, 4, 5, and 6 free parameters were used, respectively. (D) Model fits from each model in (C), aggregated across subjects. For the zBIC, lower values (blue) indicate better model performance.
Figure 3.
Figure 3.
Temporal discounting behavior in a mechanistic model. Results of a simulation study showing response probability as a function of different reward amounts (r2; x-axis) and time delays (t2; y-axis) for different values of the attention parameter ω (i.e., rows) and the lateral inhibition term for the SS alternative βSS (i.e., columns). In each plot, the probability of choosing the LL choice is color coded according to the key in the right panel. In all simulations, the value of the SS choice was assumed to be fixed, where r1=10 dollars and t1=0 days. Lateral inhibition for the LL alternative was fixed to βLL=0.5 for comparison. The black line in the middle panel represents the line of indifference from a hyperbolic discounting model (see Equations (1 and 2)) with k=0.1 and m=1.
Figure 4.
Figure 4.
Self-control and impulsivity in the brain. (A) The top row shows the results of the self-control GLM analysis, where 4 prominent regions of interest emerge: dmFC (superior frontal gyrus/supplementary motor area; [4, 28, 46]), the right pPC (inferior parietal lobule; [39, −41, 51]) and the bilateral dlPFC (middle frontal gyrus; left: [−52, 28, 24], right: [22, 38, 41]). The middle row shows the results of the impulsivity GLM analysis, and the bottom row shows the results of a contrast analysis. (B) Estimated coefficients of the GLM analysis performed in (A). For each of the 4 frontoparietal regions of interest, the red bars correspond to the self-control analysis, the blue bars correspond to the impulsivity analysis, and the orange bars correspond to the contrast between self-control and impulsivity.
Figure 5.
Figure 5.
Predictions from the downstream model against the observed data. (A) Choice response time distributions as shown as histograms for each value condition: PLL=0.1 (blue; top left panel), PLL=0.4 (green; top right panel), PLL=0.6 (yellow; bottom left panel), and PLL=0.9 (red; bottom right panel). In each panel, response time distributions are separated by their choice, where shorter sooner choices appear on the negative axis, and larger later choices appear on the positive axis. Predictions from the best-fitting model (i.e., the last row of Fig. 2C) are shown as black densities overlaying the observed data. (B) Mean choice probabilities (top panel) and mean response times (bottom panel) are shown for the observed data (x-axis) against the model predictions (y-axis). The summary statistics are shown for each individual subject in each of the 4 PLL conditions, color coded according to the legend in the top panel.
Figure 6.
Figure 6.
Neural correlates of the model’s inhibition process. (A) The scatter plot shows joint distribution of single-trial estimates βSS (x-axis) and βLL (y-axis) under different choices and conditions, according to the legend on the right side. (B) Barplots of the estimated coefficient of BOLD response signal for inhibition of SS alternative (βSS; red), inhibition of larger later (LL) alternative (βLL; blue), and their difference (i.e., βSSβLL; green) across 5 regions of interest: dmFC, right and left dlPFC, rpPC, and the ventromedial prefrontal cortex (vmPFC; frontal lobe/bottom of the cerebral hemispheres; [–3, 3, 62]). The red star indicates estimated coefficients that are significantly different from zero (i.e., P<0.05). (C, D, E) Whole-brain GLM correlation results using (C) lateral inhibition of SS alternative (i.e., βSS), (D) lateral inhibition of LL alternative (i.e., βLL), and (E) the difference between the 2 terms (i.e., βSSβLL) as trial-level regressors. Red areas represent voxels found in our self-control analysis above (Fig. 4), green voxels are associated with positive correlations, blue areas are associated with negative correlations, and yellow and magenta voxels are associated with the overlap between 2 corresponding GLM analyses.

References

    1. Ballard I, Kim B, Liatsis A, Cohen J, McClure S. 2017. More is meaningful: the magnitude effect in intertemporal choice depends on self-control. Psychol Sci. 28:1443–1454. - PMC - PubMed
    1. Ballard K, Knutson B. 2009. Dissociable neural representations of future reward magnitude and delay during temporal discounting. NeuroImage. 45:143–150. - PMC - PubMed
    1. Bartra O, McGuire JT, Kable JW. 2013. The valuation system: a coordinate-based meta-analysis of bold fmri experiments examining neural correlates of subjective value. NeuroImage. 76:412–427. - PMC - PubMed
    1. Baumeister RF, Heatherton TF. 1996. Self-regulation failure: an overview. Psychol Inq. 7:1–15.
    1. Baumeister RF, Heatherton TF, Tice DM. 1994. Losing control: how and why people fail at self-regulation. San Diego: Academic Press.

Publication types