. 2019 Feb 1;29(2):777-787.
doi: 10.1093/cercor/bhx361.

Cortical Responses to Input From Distant Areas are Modulated by Local Spontaneous Alpha/Beta Oscillations

Affiliations

Cortical Responses to Input From Distant Areas are Modulated by Local Spontaneous Alpha/Beta Oscillations

Kiyohide Usami et al. Cereb Cortex. .

Abstract

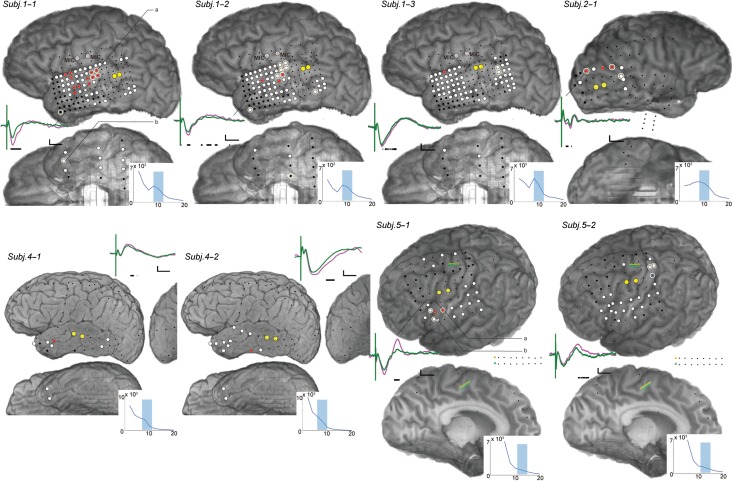
Any given area in human cortex may receive input from multiple, functionally heterogeneous areas, potentially representing different processing threads. Alpha (8-13 Hz) and beta oscillations (13-20 Hz) have been hypothesized by other investigators to gate local cortical processing, but their influence on cortical responses to input from other cortical areas is unknown. To study this, we measured the effect of local oscillatory power and phase on cortical responses elicited by single-pulse electrical stimulation (SPES) at distant cortical sites, in awake human subjects implanted with intracranial electrodes for epilepsy surgery. In 4 out of 5 subjects, the amplitudes of corticocortical evoked potentials (CCEPs) elicited by distant SPES were reproducibly modulated by the power, but not the phase, of local oscillations in alpha and beta frequencies. Specifically, CCEP amplitudes were higher when average oscillatory power just before distant SPES (-110 to -10 ms) was high. This effect was observed in only a subset (0-33%) of sites with CCEPs and, like the CCEPs themselves, varied with stimulation at different distant sites. Our results suggest that although alpha and beta oscillations may gate local processing, they may also enhance the responsiveness of cortex to input from distant cortical sites.


Figures

Figure 1.
Figure 1.
Outline of experiment. Subdural grids and microelectrode arrays (MIC) implanted on the left hemisphere in one subject (subject 1, stimulation site 1) is shown as an example. (A) Single-pulse electrical stimulation (SPES) was applied with a biphasic wave of 0.3 ms and randomly jittered interstimulus interval (ISI) of 3.0–3.6 s across the 2 yellow electrodes (bipolar). A few trials at 1 electrode (asterisk in the brain) are shown. We used a stimulation intensity of 5 or 10 mA, to avoid evoking symptoms that would redirect attention to the stimulus. 70–200 trials were recorded and ECoGs were averaged in the time domain relative to onset of SPES (analysis window: −500 to +1500 ms). We excluded electrodes within 1.5 cm from stimulated electrodes, over lesions, ictal onset zones, or contaminated with artifacts (small black dots). Electrodes (shown in white disks) were considered to have effective connectivity with the stimulated site if their averaged waveform (CCEP) exceeded z-scores of 6 relative to baseline (−500 to −10 ms) at least 10 ms after stimulation for 30 ms succession. These electrodes were selected for further analysis. The spectrograms of the window from −500 to −5 ms of stimulation were averaged across all trials without artifacts in selected electrodes and individual alpha/beta-bands with 4 Hz width were selected (8–12 Hz in this case). (B) At each electrode with a CCEP, trials were separately sorted by the average of alpha/beta power from −110 to −10 ms (gray-shaded area; upper 1/3 vs. lower 1/3) or a phase value at the timing of stimulation inferred from −10 ms of stimulation (<|π/3| vs. >|2π/3|). (C) Comparison of CCEPs at the electrode with asterisk (in A) of trials with high versus low power and of trials with up versus down phase in alpha/beta frequencies (high power/up phase: magenta, low power/down phase: green). Shaded areas show one standard deviation from the mean at each time point. Black bars along the x-axis (time) indicate periods of significant differences (Welch’s t-test, corrected by false discovery rate [FDR] = 0.05 through the analysis period). To investigate power effects on CCEPs irrespective of phase, we picked only electrodes that showed no phase difference between 2 groups, which were calculated the same way as in C or vice versa. Finally, we investigated whether the electrodes that had significant differences between 2 groups at each electrode had real significance after multiple comparisons were corrected by a nonparametric permutation test.
Figure 2.
Figure 2.
Alpha/beta power effects on CCEP. Red circles show all the electrodes that had significant alpha/beta power effect (only the stimulation sets that had any numbers of significant channels were shown). Spectrogram of the baseline in each stimulation set is shown in its inset. All microelectrodes (4 × 4 electrodes in subject 1 [MIC: microelectrodes]) and depth electrodes (colored electrodes in subject 5) were shown but excluded by the aforementioned selection criteria. Representative averaged waveforms from 2 groups (high power/up phase: magenta, low power/down phase: green) at one electrode are shown in each stimulation sets. Scales and black bars are the same as for Figure 1. The electrodes that showed significant CCSRHG are accentuated with a bright ring. a, b of Subj.1-1 and 5-1: See Figure 4 about these 4 electrodes.
Figure 3.
Figure 3.
Scatter plot shows the relationship between baseline alpha or beta powers of high/low power trials and the corresponding CCEP amplitudes of the peak or trough closest to the timing with minimum P-value in all red electrodes. Note that the ratio of the CCEP amplitude between high and low power trials (y-axis) is always more than 1.0, regardless of the ratio of baseline alpha/beta power between high and low power trials (x-axis), which means high alpha/beta power makes CCEP large (logarithmic transformation was applied for the latter ratios). H, high power trials; L, low power trials.
Figure 4.
Figure 4.
Alpha/beta power/phase effect on CCSRHG. We observed the significant power effect in 2 channels (a, b of Subj. 5-1 in Fig. 2), both of which showed high gamma increase in high power trials around the transition of CCEP deflection, after ~200 ms. We observed a significant phase effect in 2 channels (a, b of Subj. 1-1 in Fig. 2). In the process of calculating CCSRHG, both ends of each analysis window were contaminated with artifacts. So data <250 ms from each end of the data were removed from CCSRHG (also <250 ms from the start in CCEP data removed to align time window with CCSRHG) for presentation. The other conventions are the same as for Figure 1.

References

    1. Alarcon G, Martinez J, Kerai SV, Lacruz ME, Quiroga RQ, Selway RP, Richardson MP, Garcia Seoane JJ, Valentin A. 2012. In vivo neuronal firing patterns during human epileptiform discharges replicated by electrical stimulation. Clin Neurophysiol. 123:1736–1744. - PMC - PubMed
    1. Anderson WS, Kudela P, Weinberg S, Bergey GK, Franaszczuk PJ. 2009. Phase-dependent stimulation effects on bursting activity in a neural network cortical simulation. Epilepsy Res. 84:42–55. - PMC - PubMed
    1. Aru J, Aru J, Priesemann V, Wibral M, Lana L, Pipa G, Singer W, Vicente R. 2015. Untangling cross-frequency coupling in neuroscience. Curr Opin Neurobiol. 31:51–61. - PubMed
    1. Bahramisharif A, van Gerven MA, Aarnoutse EJ, Mercier MR, Schwartz TH, Foxe JJ, Ramsey NF, Jensen O. 2013. Propagating neocortical gamma bursts are coordinated by traveling alpha waves. J Neurosci. 33:18849–18854. - PMC - PubMed
    1. Barardi A, Garcia-Ojalvo J, Mazzoni A. 2016. Transition between functional regimes in an integrate-and-fire network model of the thalamus. PLoS One. 11:e0161934. - PMC - PubMed

Publication types