

Pervasive Correlated Evolution in Gene Expression Shapes Cell and Tissue Type Transcriptomes
- PMID: 29373668
- PMCID: PMC5800078
- DOI: 10.1093/gbe/evy016
Pervasive Correlated Evolution in Gene Expression Shapes Cell and Tissue Type Transcriptomes
Abstract
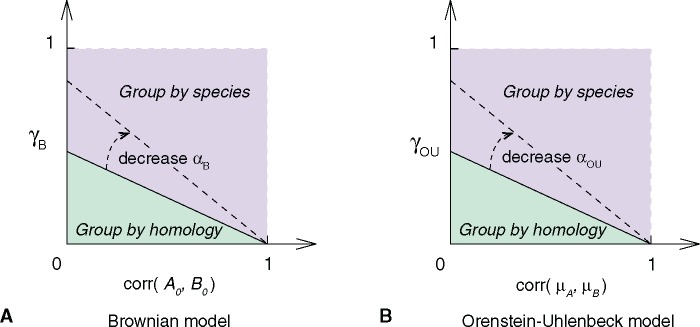
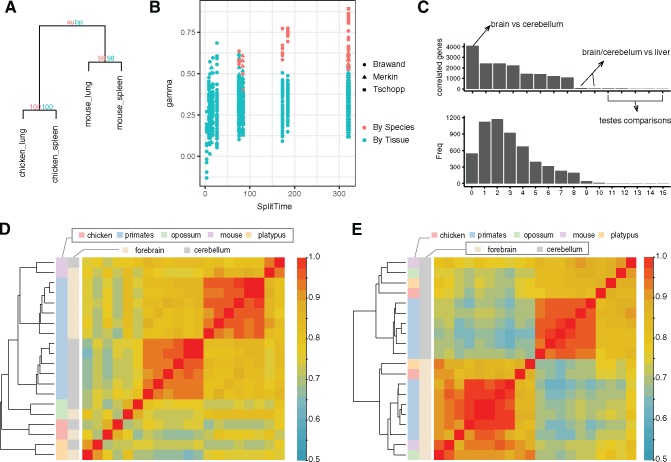
The evolution and diversification of cell types is a key means by which animal complexity evolves. Recently, hierarchical clustering and phylogenetic methods have been applied to RNA-seq data to infer cell type evolutionary history and homology. A major challenge for interpreting this data is that cell type transcriptomes may not evolve independently due to correlated changes in gene expression. This nonindependence can arise for several reasons, such as common regulatory sequences for genes expressed in multiple tissues, that is, pleiotropic effects of mutations. We develop a model to estimate the level of correlated transcriptome evolution (LCE) and apply it to different data sets. The results reveal pervasive correlated transcriptome evolution among different cell and tissue types. In general, tissues related by morphology or developmental lineage exhibit higher LCE than more distantly related tissues. Analyzing new data collected from bird skin appendages suggests that LCE decreases with the phylogenetic age of tissues compared, with recently evolved tissues exhibiting the highest LCE. Furthermore, we show correlated evolution can alter patterns of hierarchical clustering, causing different tissue types from the same species to cluster together. To identify genes that most strongly contribute to the correlated evolution signal, we performed a gene-wise estimation of LCE on a data set with ten species. Removing genes with high LCE allows for accurate reconstruction of evolutionary relationships among tissue types. Our study provides a statistical method to measure and account for correlated gene expression evolution when interpreting comparative transcriptome data.
Keywords: cell type evolution; comparative transcriptomincs; correlated evolution; gene expression evolution.
© The Author(s) 2018. Published by Oxford University Press on behalf of the Society for Molecular Biology and Evolution.
Figures
Similar articles
-
Brownian model of transcriptome evolution and phylogenetic network visualization between tissues.Mol Phylogenet Evol. 2017 Sep;114:34-39. doi: 10.1016/j.ympev.2017.03.027. Epub 2017 Apr 22. Mol Phylogenet Evol. 2017. PMID: 28442318
-
Evolutionary hallmarks of the human proteome: chasing the age and coregulation of protein-coding genes.BMC Genomics. 2016 Oct 25;17(Suppl 8):725. doi: 10.1186/s12864-016-3062-y. BMC Genomics. 2016. PMID: 27801289 Free PMC article.
-
Understanding tissue expression evolution: from expression phylogeny to phylogenetic network.Brief Bioinform. 2016 Mar;17(2):249-54. doi: 10.1093/bib/bbv041. Epub 2015 Jul 3. Brief Bioinform. 2016. PMID: 26141828 Review.
-
Large-scale mapping of mammalian transcriptomes identifies conserved genes associated with different cell states.Nucleic Acids Res. 2017 Feb 28;45(4):1657-1672. doi: 10.1093/nar/gkw1256. Nucleic Acids Res. 2017. PMID: 27980097 Free PMC article.
-
Character trees from transcriptome data: Origin and individuation of morphological characters and the so-called "species signal".J Exp Zool B Mol Dev Evol. 2015 Nov;324(7):588-604. doi: 10.1002/jez.b.22636. Epub 2015 Jul 14. J Exp Zool B Mol Dev Evol. 2015. PMID: 26175303 Review.
Cited by
-
Evolution of placental invasion and cancer metastasis are causally linked.Nat Ecol Evol. 2019 Dec;3(12):1743-1753. doi: 10.1038/s41559-019-1046-4. Epub 2019 Nov 25. Nat Ecol Evol. 2019. PMID: 31768023 Free PMC article.
-
A Qualitative Modeling Approach for Whole Genome Prediction Using High-Throughput Toxicogenomics Data and Pathway-Based Validation.Front Pharmacol. 2018 Oct 2;9:1072. doi: 10.3389/fphar.2018.01072. eCollection 2018. Front Pharmacol. 2018. PMID: 30333746 Free PMC article.
-
An ancient, conserved gene regulatory network led to the rise of oral venom systems.Proc Natl Acad Sci U S A. 2021 Apr 6;118(14):e2021311118. doi: 10.1073/pnas.2021311118. Proc Natl Acad Sci U S A. 2021. PMID: 33782124 Free PMC article.
-
Cell type evolution reconstruction across species through cell phylogenies of single-cell RNA sequencing data.Nat Ecol Evol. 2024 Feb;8(2):325-338. doi: 10.1038/s41559-023-02281-9. Epub 2024 Jan 5. Nat Ecol Evol. 2024. PMID: 38182680
-
Cross-Species Analysis of Single-Cell Transcriptomic Data.Front Cell Dev Biol. 2019 Sep 2;7:175. doi: 10.3389/fcell.2019.00175. eCollection 2019. Front Cell Dev Biol. 2019. PMID: 31552245 Free PMC article.
References
-
- Achim K, et al.2015. High-throughput spatial mapping of single-cell RNA-seq data to tissue of origin. Nat Biotechnol. 33(5):503–509.http://dx.doi.org/10.1038/nbt.3209 - DOI - PubMed
-
- Ackerly DD. 2000. Taxon sampling, correlated evolution, and independent contrasts. Evolution 54(5):1480–1492.http://dx.doi.org/10.1111/j.0014-3820.2000.tb00694.x - DOI - PubMed
-
- Arendt D. 2008. The evolution of cell types in animals: emerging principles from molecular studies. Nat Rev Genet. 9(11):868–882.http://dx.doi.org/10.1038/nrg2416 - DOI - PubMed
-
- Arendt D, et al.2016. The origin and evolution of cell types. Nat Rev Genet. 17:744–757. - PubMed
Publication types
MeSH terms
LinkOut - more resources
Full Text Sources
Other Literature Sources
