

Frail-VIG index: a concise frailty evaluation tool for rapid geriatric assessment
- PMID: 29373968
- PMCID: PMC5787254
- DOI: 10.1186/s12877-018-0718-2
Frail-VIG index: a concise frailty evaluation tool for rapid geriatric assessment
Abstract
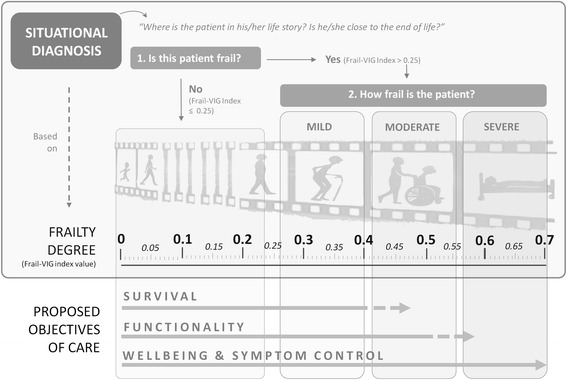
Background: Demographic changes have led to an increase in the number of elderly frail persons and, consequently, systematic geriatric assessment is more important than ever. Frailty Indexes (FI) may be particularly useful to discriminate between various degrees of frailty but are not routinely assessed due, at least in part, to the large number of deficits assessed (from 30 to 70). Therefore, we have developed a new, more concise FI for rapid geriatric assessment (RGA)-the Frail-VIG index ("VIG" is the Spanish/Catalan abbreviation for Comprehensive Geriatric Assessment), which contains 22 simple questions that assess 25 different deficits. Here we describe this FI and report its ability to predict mortality at 24 months.
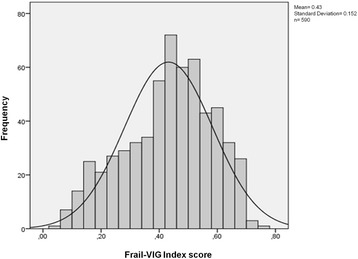
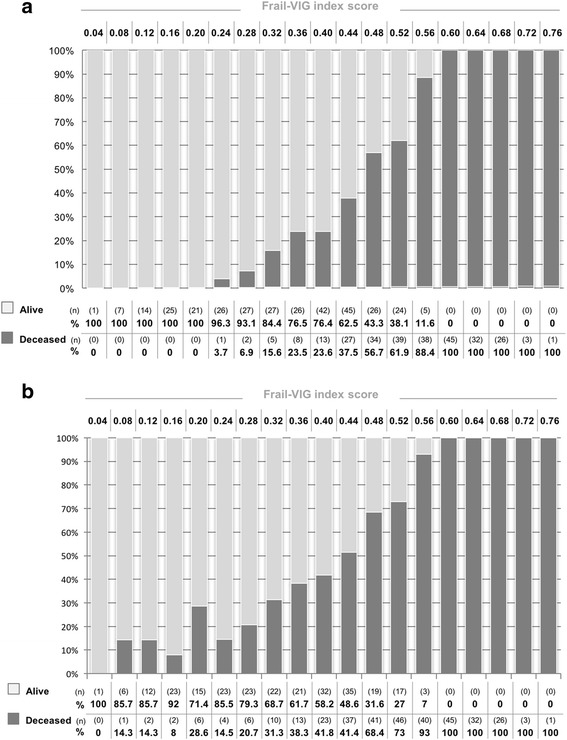
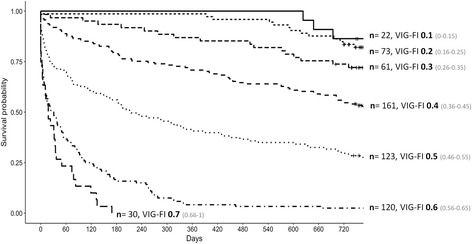
Methods: Prospective, observational, longitudinal study of geriatric patients followed for 24 months or until death. The study participants were patients (n = 590) admitted to the Acute Geriatric Unit at the at the University Hospital of Vic (Barcelona) during the year 2014. Participants were classified into one of seven groups based on their Frail-VIG score (0-0.15; 0.16-0.25; 0.26-0.35; 0.36-0.45; 0.46-0.55; 0.56-0.65; and 0.66-1). Survival curves for these groups were compared using the log-rank test. ROC curves were used to assess the index's capacity to predict mortality at 24 months.
Results: Mean (standard deviation) patient age was 86.4 (5.6) years. The 24-month mortality rate was 57.3% for the whole sample. Significant between-group (deceased vs. living) differences (p < 0.05) were observed for most index variables. Survival curves for the seven Frail-VIG groups differed significantly (X2 = 433.4, p < 0.001), with an area under the ROC curve (confidence interval) of 0.90 (0.88-0.92) at 12 months and 0.85 (0.82-0.88) at 24 months. Administration time for the Frail-VIG index ranged from 5 to 10 min.
Conclusions: The Frail-VIG index, which requires less time to administer than previously validated FIs, presents a good discriminative capacity for the degree of frailty and a high predictive capacity for mortality in the present cohort. Although more research is needed to confirm the validity of this instrument in other populations and settings, the Frail-VIG may provide clinicians with a RGA method and also a reliable tool to assess frailty in routine practice.
Keywords: Frail elderly; Frailty index; Geriatric assessment; Mortality; Multimorbidity.
Conflict of interest statement
Ethics approval and consent to participate
The study protocol was approved by the Ethics Committee of the University Hospital of Vic (2,014,850 PR80). All patients enrolled in the study provided written informed consent for participation or, if this was not possible due to advanced dementia situation (GDS ≥ 6), by close family relatives. This study was conducted according to the guidelines of the Declaration of Helsinki.
Consent for publication
Not applicable. The manuscript contains no individual person’s identifiable data.
Competing interests
The authors report no conflicts of interest. RRO is a member of the editorial board of BMC Geriatrics. The authors alone are responsible for the content and writing of the paper.
Publisher’s Note
Springer Nature remains neutral with regard to jurisdictional claims in published maps and institutional affiliations.
Figures
References
-
- Ravindrarajah R, Lee DM, Pye SR, Gielen E, Boonen S, Vanderschueren D, et al. The ability of three different models of frailty to predict all-cause mortality: results from the European male aging study (EMAS) Arch Gerontol Geriatr. 2013;57(3):360–368. doi: 10.1016/j.archger.2013.06.010. - DOI - PubMed
Publication types
MeSH terms
LinkOut - more resources
Full Text Sources
Other Literature Sources
Medical
