. 2018 Mar 5;215(3):761-771.
doi: 10.1084/jem.20171738. Epub 2018 Jan 26.

A broad atlas of somatic hypermutation allows prediction of activation-induced deaminase targets

Affiliations

A broad atlas of somatic hypermutation allows prediction of activation-induced deaminase targets

Ángel F Álvarez-Prado et al. J Exp Med. .

Abstract

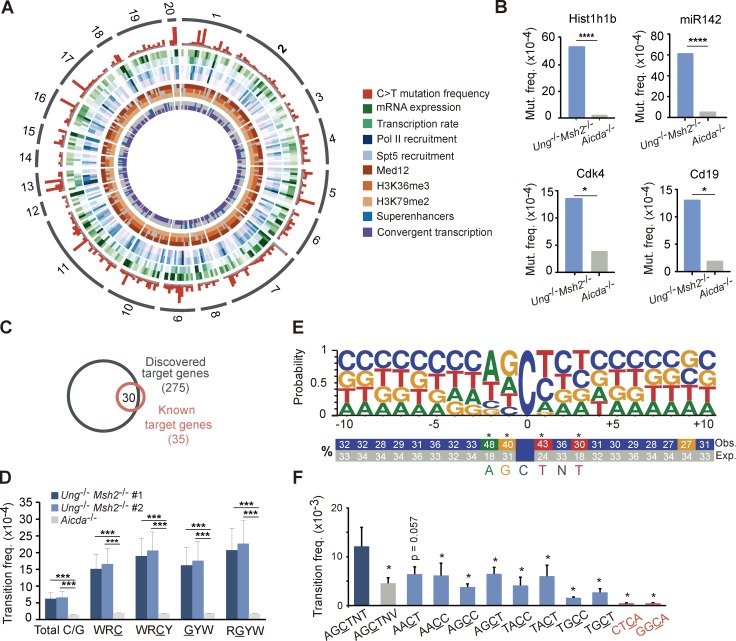
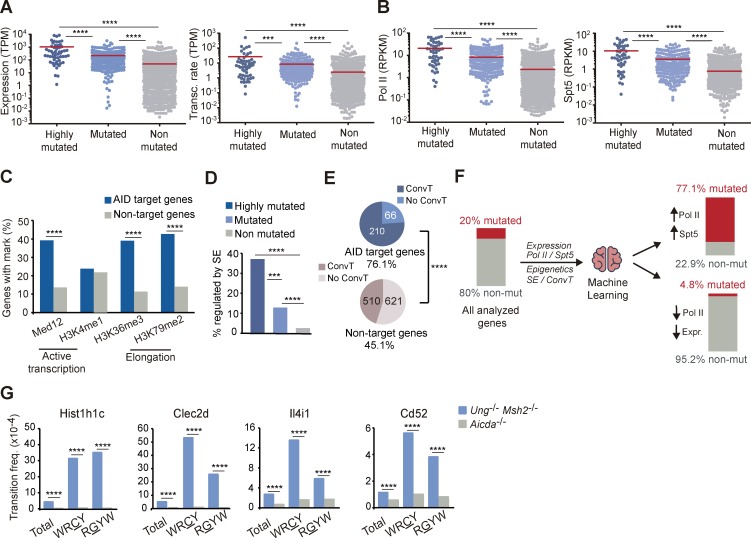
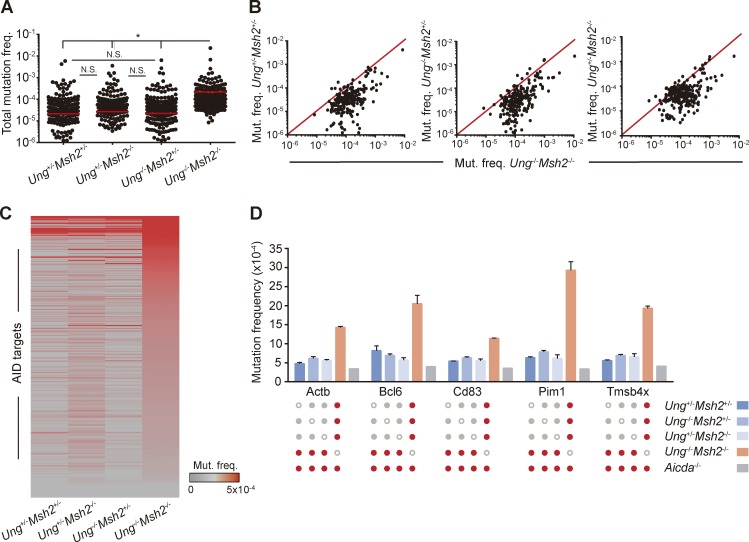
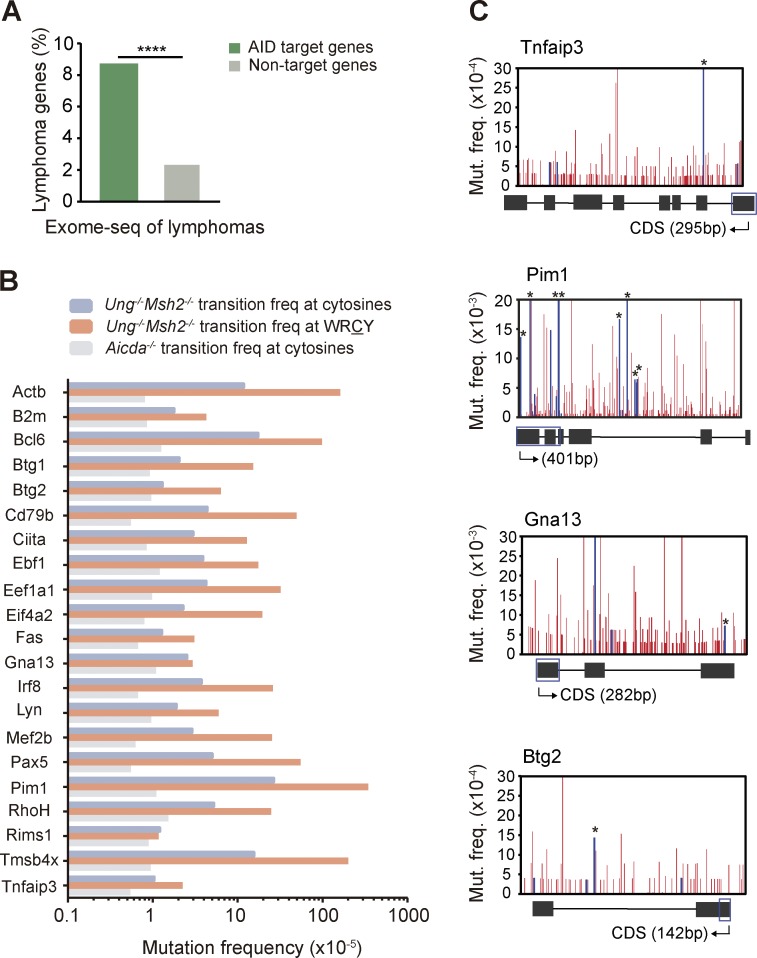
Activation-induced deaminase (AID) initiates antibody diversification in germinal center (GC) B cells through the deamination of cytosines on immunoglobulin genes. AID can also target other regions in the genome, triggering mutations or chromosome translocations, with major implications for oncogenic transformation. However, understanding the specificity of AID has proved extremely challenging. We have sequenced at very high depth >1,500 genomic regions from GC B cells and identified 275 genes targeted by AID, including 30 of the previously known 35 AID targets. We have also identified the most highly mutated hotspot for AID activity described to date. Furthermore, integrative analysis of the molecular features of mutated genes coupled to machine learning has produced a powerful predictive tool for AID targets. We also have found that base excision repair and mismatch repair back up each other to faithfully repair AID-induced lesions. Finally, our data establish a novel link between AID mutagenic activity and lymphomagenesis.


Figures

Figure 1.
Figure 1.
High-throughput analysis of AID-induced mutations. DNA from Peyer's patch GC B cells was captured with a probe library for 1,588 genomic regions (Table S1) and deep sequenced. AID targets were identified as those regions accumulating significantly more C→T transition mutations in Ung−/−Msh2−/− than in Aicda−/− mice (Table S2; FDR ≤0.05, one-tail Fisher test and Benjamini-Hochberg correction; two independent experiments; see Materials and methods). (A) Circos plot representation of the AID targets identified in this study and their associated molecular features. The outer ring shows chromosome location and is followed by C→T transition mutation frequency in Ung−/−Msh2−/− (red) and Aicda−/− (gray) mice. (B) Validation of representative AID targets by Sanger sequencing (one-tail Fisher test; Table S3). (C) Overlap between the targets discovered in this study and previously reported AID targets. (D) Mean transition frequency in total C/G nucleotides and in C/G within WRC(Y)/(R)GYW hotspots (W = A/T; R = G/A; Y = C/T) of the 291 AID targets (two-tailed Student’s t test; two independent experiments). (E) Logo representation of the sequence context of mutated cytosines (mutation frequency ≥4 × 10⁻³). Statistically significant enrichment of nucleotides surrounding the mutated C is indicated (*, FDR ≤10−3, one-tail Fisher test and Bonferroni correction; see Materials and methods), and numbers indicate percentages. (F) Mean mutation frequency of cytosines within the indicated motifs (dark blue bar, newly identified hotspot; gray bar, control motif for newly identified hotspot; light blue bars, WRCY hotspots; red bars, random four-nucleotide motifs; two-tailed Mann-Whitney test). *, P ≤ 0.05; ***, P < 10−3; ****, P < 10−4. Error bars depict SEM.
Figure 2.
Figure 2.
Molecular features of AID targets predict mutability. (A) Expression level of highly mutated (top 20% mutated genes, C→T transition frequency >3 × 10⁻⁴), mutated (rest of mutated), and nonmutated genes in Peyer's patch GC B cells as measured by RNA-Seq and transcription rate of AID targets in GC B cells from lymph nodes as measured by GRO-Seq. TPM, transcripts per million. (B) Recruitment of RNAPolII and Spt5 to AID targets and nontargets measured in in vitro activated splenic B cells by ChIP-Seq. RPKM, reads per kilobase per million reads mapped. (C) Transcription and transcription elongation marks in AID targets and nontargets by ChIP-Seq analysis of in vitro activated splenic B cells (Med12, H3K4me1, H3K36me3, and H3K79me2). (D) Proportion of highly mutated, mutated, and nonmutated genes regulated by superenhancers (SE) in GC B cells (see Materials and methods). (E) GRO-Seq analysis of convergent transcription (ConvT) in AID targets and nontargets from GC splenic B cells obtained from SRBC-immunized mice. (F) Representation of the machine-learning approach used for AID target prediction. (G) Validation of representative genes predicted to be mutated by the model by PCR-Seq. Statistical tests: two-tailed Student’s t test (A, B, and G) and one-tailed Fisher test (C–E). ***, P < 10−3; ****, P < 10−4.
Figure 3.
Figure 3.
BER and MMR back up each other to error-free repair AID-induced lesions. (A and B) Total mutation frequency of AID targets in Ung+/−Msh2+/, Ung−/−Msh2+/−, and Ung+/−Msh2−/− GC B cell mice compared with that of Ung−/−Msh2−/− mice (mean of two independent experiments; see Materials and methods; Table S2). (C) Heat map representation of AID targets in Ung+/−Msh2+/, Ung−/−Msh2+/−, Ung+/−Msh2−/−, and Ung−/−Msh2−/− GC B cells. (D) Mutation frequency of representative genes in Ung+/−Msh2+/−, Ung−/−Msh2+/−, Ung+/−Msh2−/−, Ung−/−Msh2−/−, and Aicda−/− GC B cells. Red dots indicate statistically different mutation frequencies between the indicated genotypes. Mutation frequency found in Aicda−/− mice was substracted before plotting A–C. (A and D) Two-tailed Student’s t test; *, P ≤ 0.05. Error bars depict SEM. N.S., not significant.
Figure 4.
Figure 4.
AID targets are recurrently mutated in human lymphomas. (A) AID targets are enriched in genes involved in lymphoma development. Percentage of lymphoma genes within AID target and nontarget genes. Annotation was done from public data on human lymphoma sequencing (see Materials and methods; two-tailed Fisher test; ****, P < 10−4). (B) Mutation frequency in total C/G nucleotides and C/G nucleotides within WRC(Y)/(R)GYW hotspots (W = A/T; R = G/A; Y = C/T) of the 21 AID target genes involved in human DLBCL development analyzed in Ung−/−Msh2−/− mice (mean of two independent experiments; see Materials and methods). (C) Mutation profiles of representative DLBCL genes analyzed in Ung−/− Msh2−/− mice. Blue bars indicate mutations identical to those found in human lymphoma tumor samples (Table S5); asterisks indicate mutations occurring in a WRC(Y) hotspot. The diagrams below the graphs represent the complete gene (not to scale), and blue boxes indicate the region depicted above. Mutation frequency found in each nucleotide in Aicda−/− mice was subtracted before plotting.

Comment in

References

    1. Chiarle R., Zhang Y., Frock R.L., Lewis S.M., Molinie B., Ho Y.J., Myers D.R., Choi V.W., Compagno M., Malkin D.J., et al. . 2011. Genome-wide translocation sequencing reveals mechanisms of chromosome breaks and rearrangements in B cells. Cell. 147:107–119. 10.1016/j.cell.2011.07.049 - DOI - PMC - PubMed
    1. de Miranda N.F., Georgiou K., Chen L., Wu C., Gao Z., Zaravinos A., Lisboa S., Enblad G., Teixeira M.R., Zeng Y., et al. . 2014. Exome sequencing reveals novel mutation targets in diffuse large B-cell lymphomas derived from Chinese patients. Blood. 124:2544–2553. 10.1182/blood-2013-12-546309 - DOI - PMC - PubMed
    1. Di Noia J.M., and Neuberger M.S.. 2007. Molecular mechanisms of antibody somatic hypermutation. Annu. Rev. Biochem. 76:1–22. 10.1146/annurev.biochem.76.061705.090740 - DOI - PubMed
    1. Dong J., Panchakshari R.A., Zhang T., Zhang Y., Hu J., Volpi S.A., Meyers R.M., Ho Y.-J., Du Z., Robbiani D.F., et al. . 2015. Orientation-specific joining of AID-initiated DNA breaks promotes antibody class switching. Nature. 525:134–139. 10.1038/nature14970 - DOI - PMC - PubMed
    1. Feng J., Liu T., and Zhang Y.. 2011. Using MACS to identify peaks from ChIP-Seq data. Curr. Protoc. Bioinformatics. 2:14. - PMC - PubMed

Publication types

Substances